Length-Weight Relationships of Pseudorasbora parva (Temminck and Schlegel, 1842) Around the World
Length-Weight Relationships of Pseudorasbora parva (Temminck and Schlegel, 1842) Around the World
Guangcan Lin1,2,3, Xingyu Chen1,2,3, Xiaohao Shi1,2,3, Xiaolin Li1,2,3,
Anwar Tanwari Kamran4, Zhengxiang Wang1,2,3, Qing Zhu5, Gaodao Liang5* and Lei Pan1,2,3*
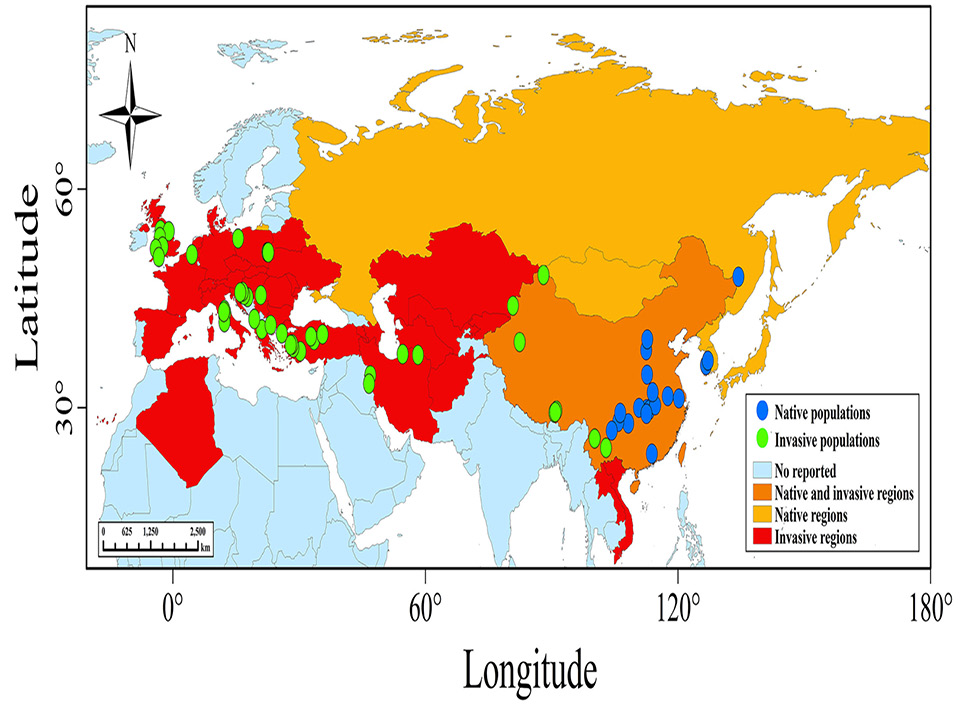
As a result of the distribution study in the Fishbase, Pseudorasbora parva (Temminck and Schlegel, 1842) was found in 43 countries (Froese and Pauly, 2022). In spite of the fact that China is classified as the source of this fish in Fishbase, vast swaths of western China have been invaded by this species and have caused great harm (Jia et al., 2019). In accordance with this, China was categorized as both a native and an invasive region (dark yellow range), whilst the Korean peninsula, Japan, Russia, and Mongolia were categorized as native regions (light yellow ranges) and others as invasive regions (red ranges). There have been reports of both native (blue solid circles) and invasive (green solid circles) length-weight relationships (LWRs) for this species in 12 different countries.
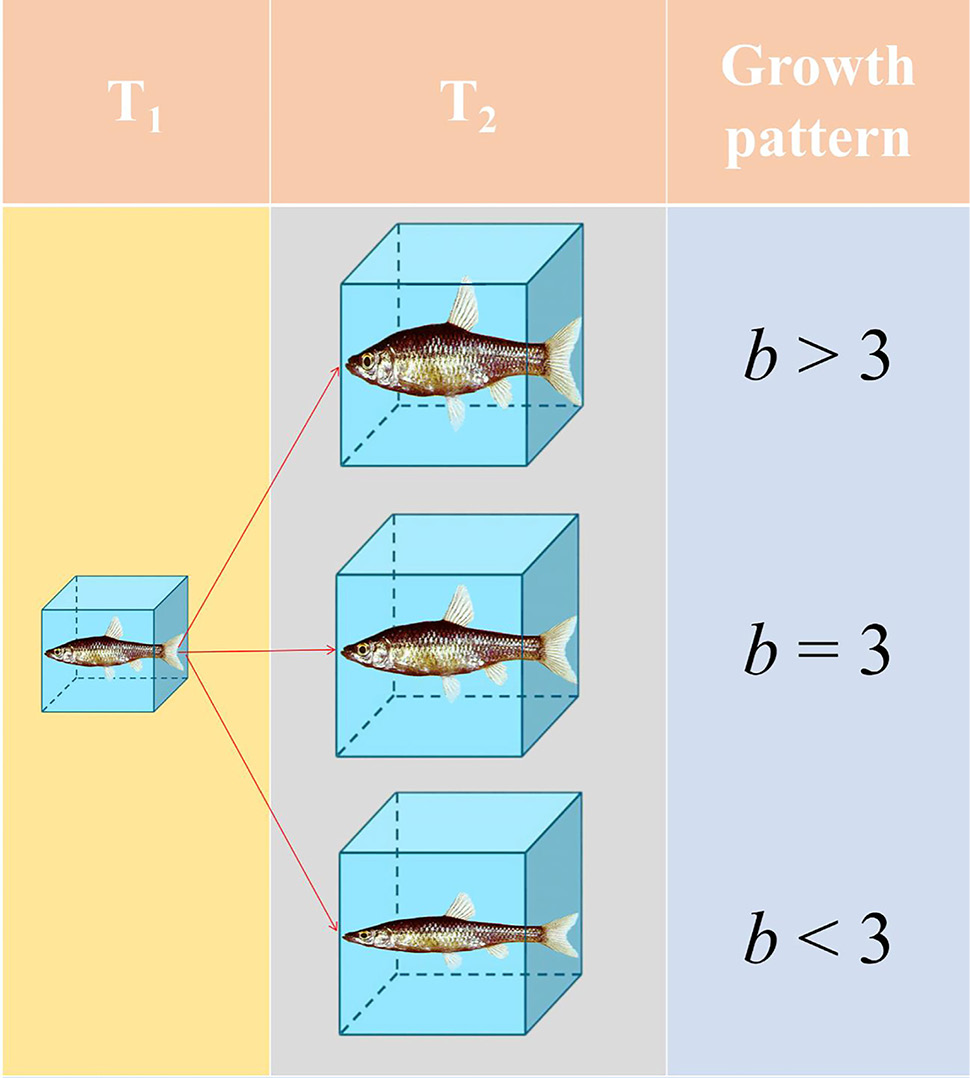
A simple diagram of three growth patterns. When a small fish (T1) grows to the assumed length of the large fish (T2). If b = 3, then this species is isometric growth, that is, T1 has the same form and condition as T2. If b > 3, then this species is positive-allometric growth, that is, T2 increases in relative body thickness or plumpness more than T1. If b < 3, then this species is negative-allometric growth, that is, body shapes of T2 are changed to become more elongated.
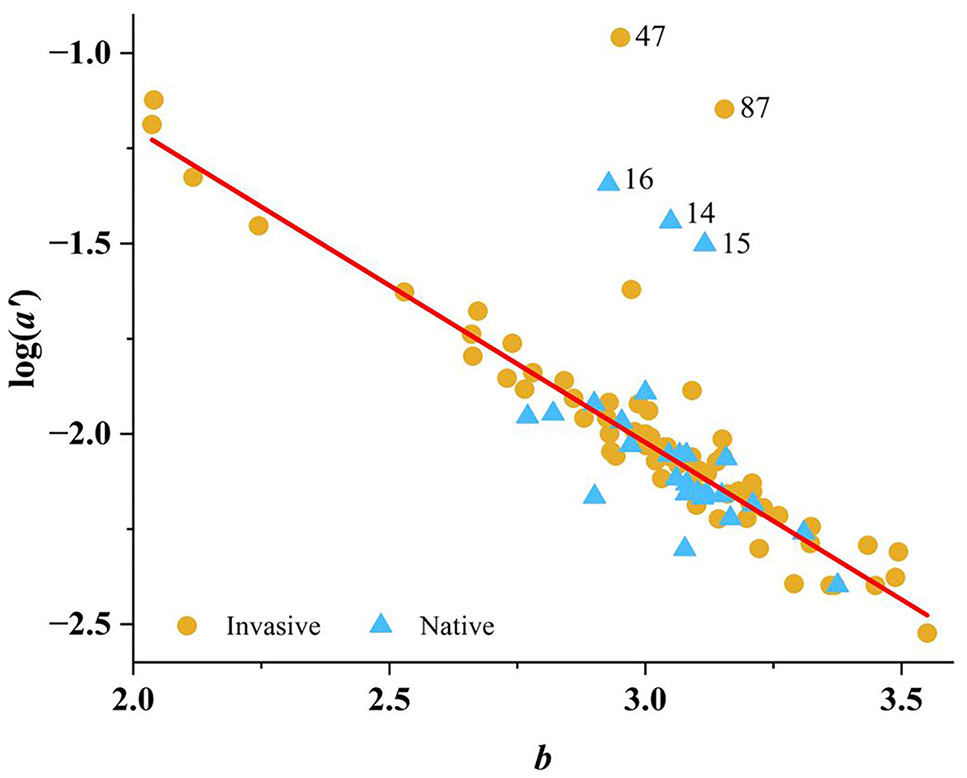
Plots of log (a’) vs b for 93 LWRs of P. parva. Five outliers were marked by row number of Supplementary Table I in the graphs, and eliminated in subsequent analysis. Regression line: log(a’) = 0.45 - 0.83b, n = 88, R2 = 0.84, P < 0.05.
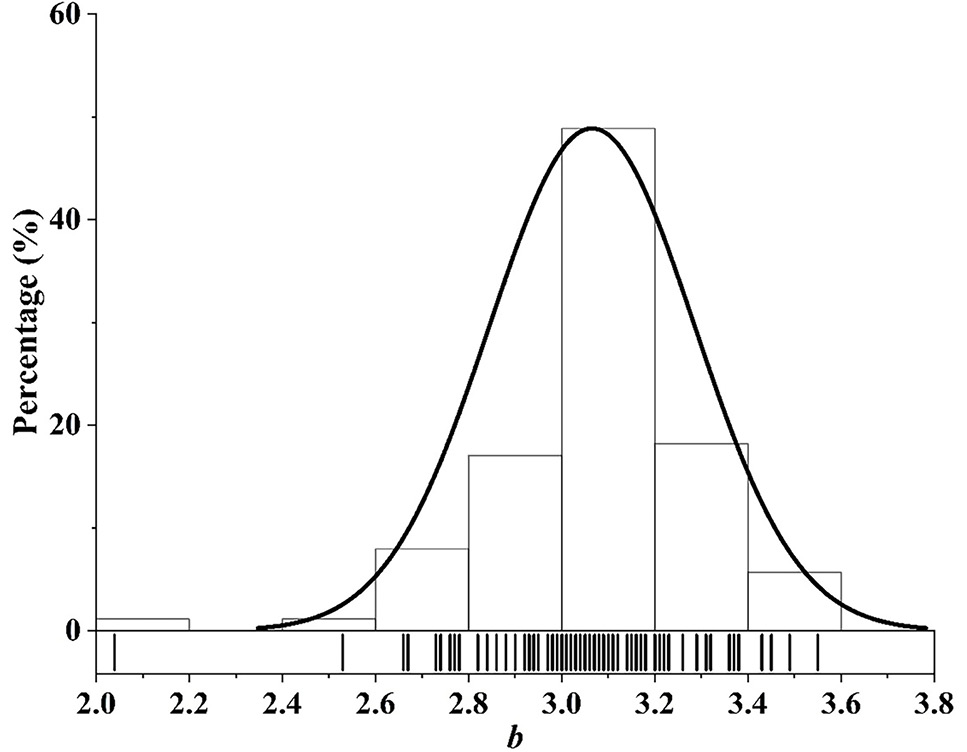
Frequency distribution of mean exponent b based on 88 records for P. parva, with 5th percentile = 2.70 and 95th percentile= 3.44. Gaussian distribution line was overlaid.


