Influence of Biochar on Yield and Heavy Metal Accumulation in Roots of Brassica Rapa under Groundwater and Wastewater Irrigation
Influence of Biochar on Yield and Heavy Metal Accumulation in Roots of Brassica Rapa under Groundwater and Wastewater Irrigation
Feroza Haider1,2, Shamim Gul2,3*, Javaid Hussain4, Sadaf Asalam Ghori5, Muhammad Naeem Shahwani6, Muhammad Murad6 and Abdul Manan Kakar7
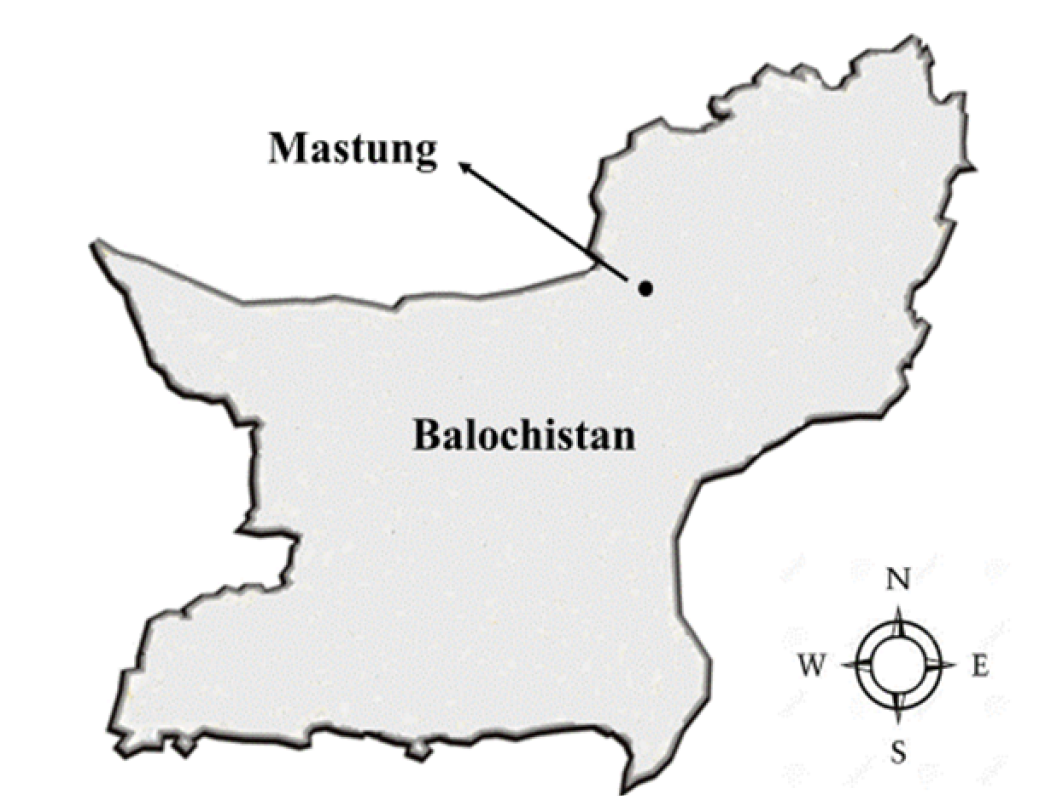
Map of Balochistan indicating location of Mastung.
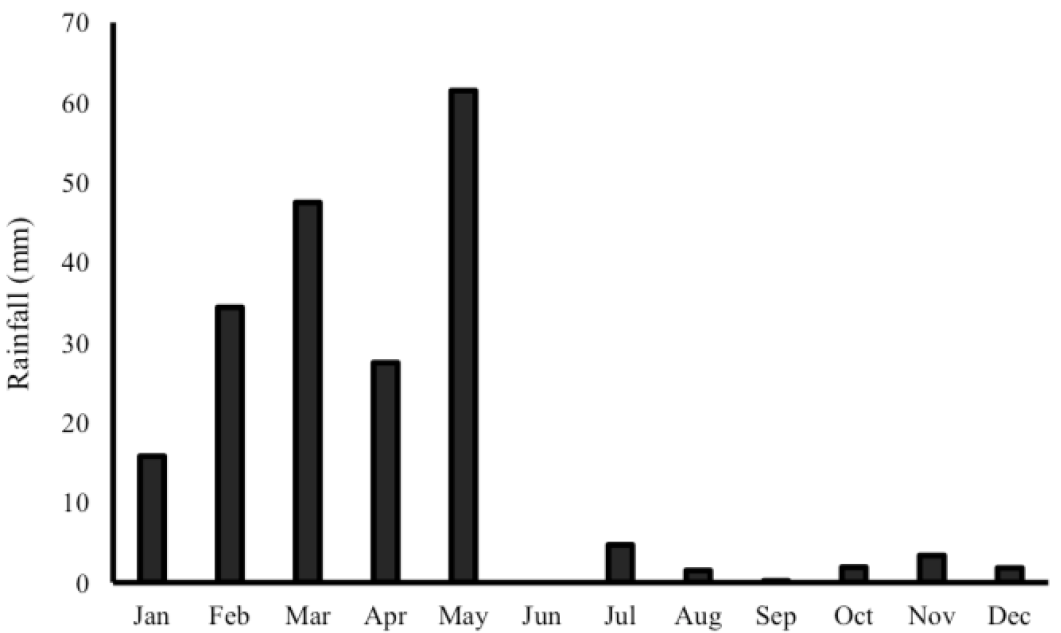
Rainfall distribution during 2015.
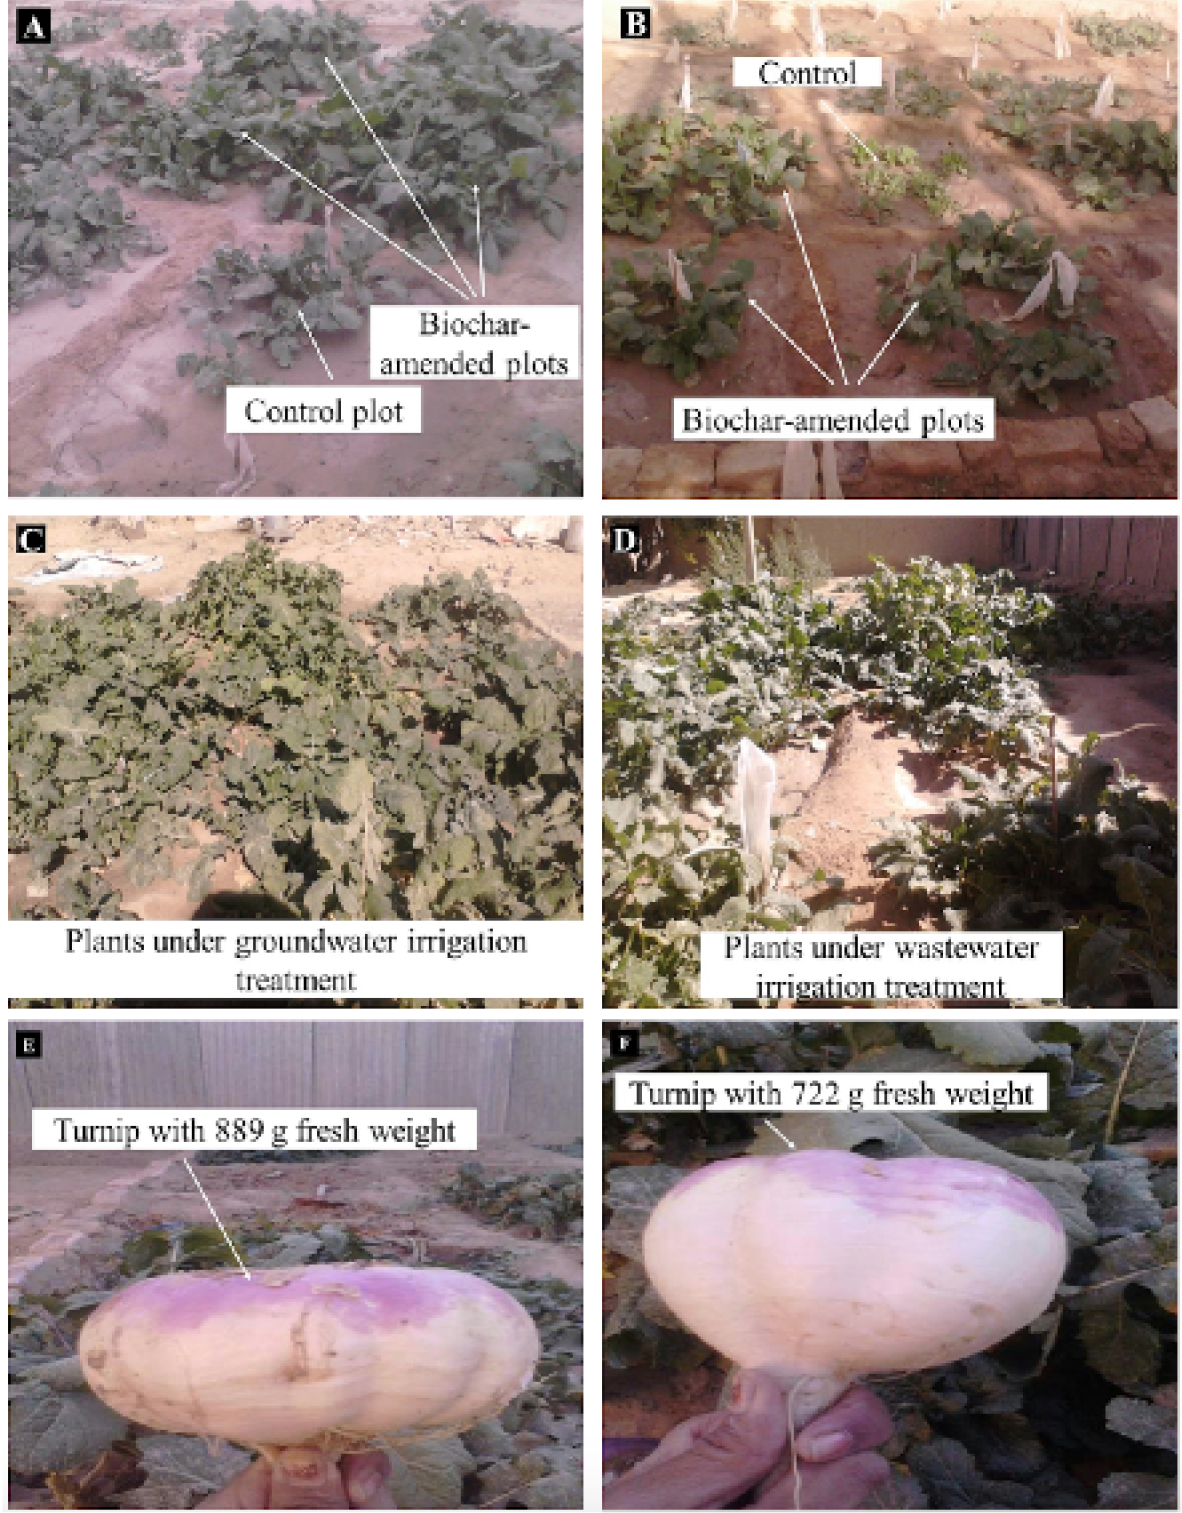
Two weeks old plants receiving groundwater irrigation (A), ten days old plants grown receiving wastewater irrigation (B), one month old plants receiving groundwater irrigation (C), one month old plants receiving wastewater irrigation (D), fresh turnip from soil amended with 1 kg manure derived-biochar under wastewater irrigation (E), fresh turnip from soil amended with 1 kg wood-derived biochar under wastewater irrigation (F).
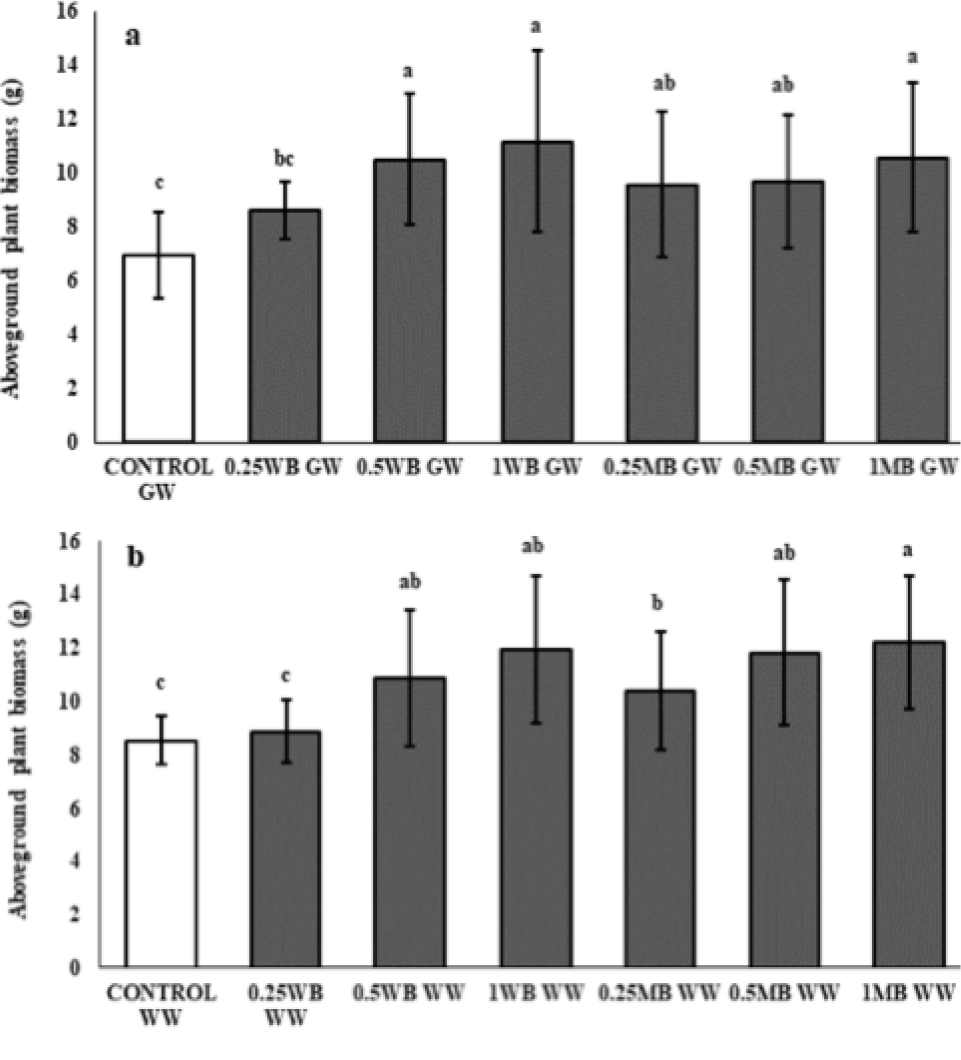
Mean ± SD of aboveground plant biomass (n = 15; five plants per plot) of B. rapa grown under groundwater (a) and wastewater (b) treatments. Bars with different letters represent significant difference at P<0.05 (n = 15; 5 plants per plot). GW-groundwater, WW-wastewater, WB-wood-derived biochar, MB-manure-derived biochar, 0.25-application rate of biochar as 0.25 kg m-2, 0.5-application rate of biochar as 0.5 kg m-2, 1-application rate of biochar as 1 kg m-2.
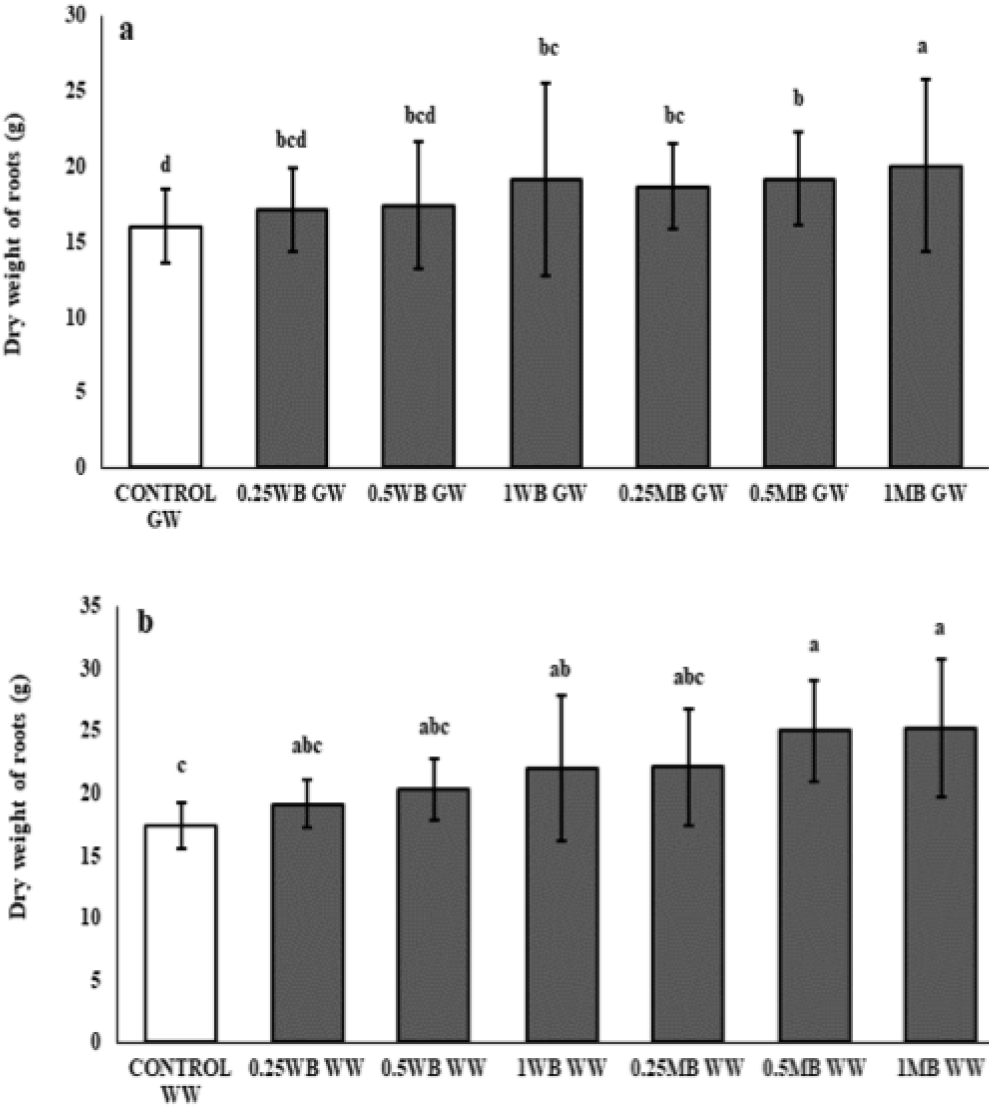
Mean ± SD of dry weight of B. rapa roots (n = 15; five plants per plot) grown under groundwater (a) and wastewater (b) treatments. Bars with different letters represent significant difference at P<0.05 (n = 15; 5 plants per plot). GW-groundwater, WW-wastewater, WB-wood-derived biochar, MB-manure-derived biochar, 0.25-application rate of biochar as 0.25 kg m-2, 0.5-application rate of biochar as 0.5 kg m-2, 1-application rate of biochar as 1 kg m-2.


