Improved Soil Physical Properties, Yield and Water Productivity under Controlled Traffic, Raised-Bed Farming
Improved Soil Physical Properties, Yield and Water Productivity under Controlled Traffic, Raised-Bed Farming
Ghani Akbar, Muhammad Munir Ahmad, Muhammad Asif, Iqbal Hassan, Qurban Hussain3 and Greg Hamilton
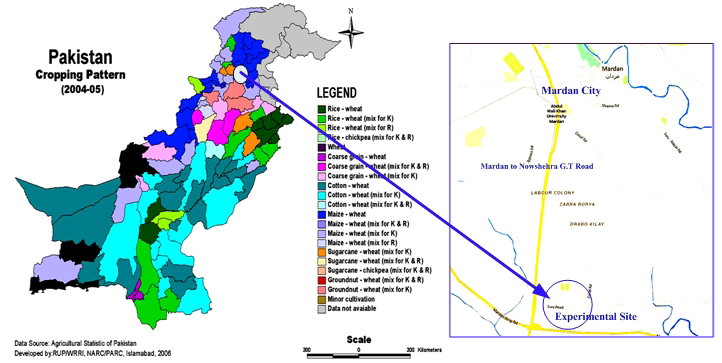
Location map of site with map of Pakistan showing cropping pattern (Source of cropping pattern map is CAEWRI-NARC Islamabad 2005)
Controlled traffic raised bed treatments with WB emplaced during experiment 1 (2000-2004) and MB and NB emplaced during experiment 2 (2005-2009) under maize wheat cropping pattern
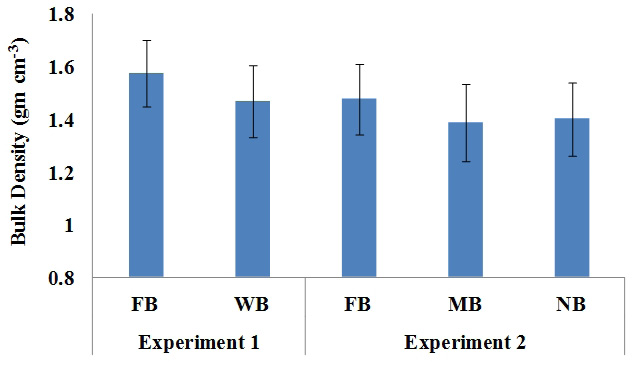
Average bulk density variations among treatments (FB-Flat Basin, WB-Wide bed, MB-Medium Bed and NB-Narrow Bed) during two experimental periods (Experiment 1: 2000-2004, Experiment 2: 2005-2009) under wheat maize cropping pattern (vertical bars show SD)
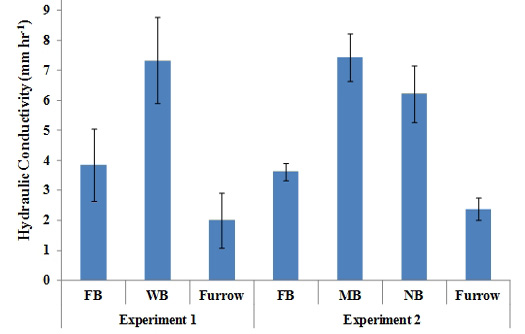
Comparison of average soil hydraulic conductivity for different raised beds (WB: Wide Bed, MB: Medium Bed, NB: Narow Bed), furrows and flat basin (FB) during two experiments (Experiment 1: 2000-2004 and Experiment 2: 2005-2009) under wheat maize cropping pattern (vertical bars show SD)
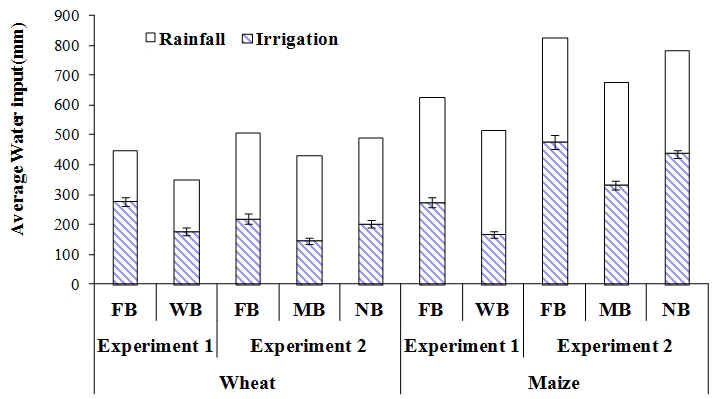
Total water input for different raised bed sizes (WB, MB and NB) compared with flat basin (FB) during two experiments (Experiment 1: 2000-2004 and experiment 2: 2005-2009) under wheat maize cropping pattern (vertical bars show SD)
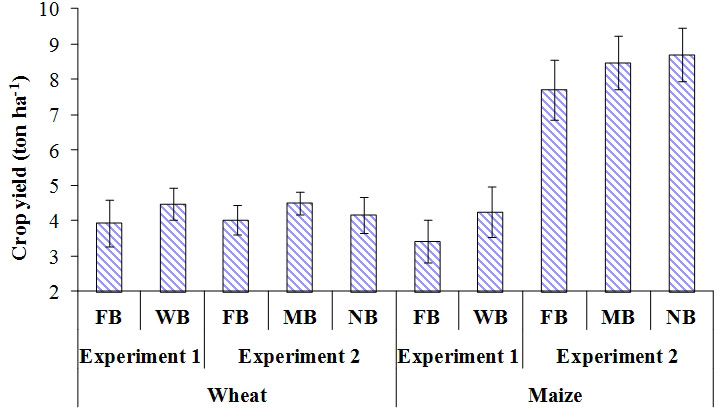
Impact of different raised bed sizes (WB, MB, NB) compared with flat basin (FB) on crop yield during two experiments (Experiment 1: 2000-2004 and experiment 2: 2005-2009) under wheat maize cropping pattern (vertical bars show SD)
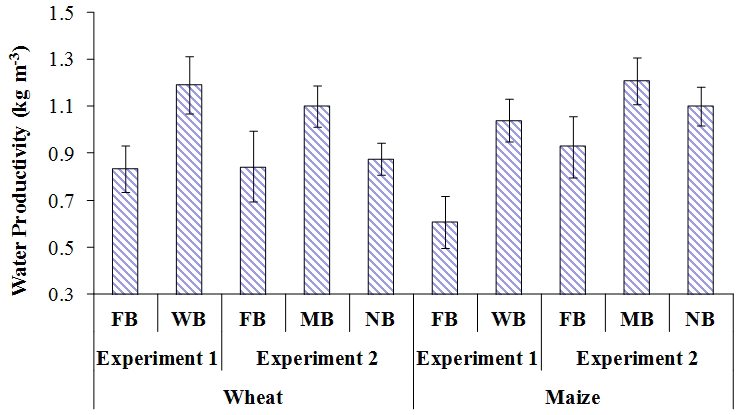
Impact of different raised bed sizes (WB, MB, NB) and flat basin (FB) on water productivity during two experiments (Experiment 1: 2000-2004 and experiment 2: 2005-2009) under wheat maize cropping pattern (Vertical bars show SD)


