


Research Article
Impact of Various Factors on Crop Diversification Towards High Value Crops in Pakistan: An Empirical Analysis by using THI
Asif Ali Abro1* and Iqbal Ahmed Panhwar2
1Newports Institute of Communications and Economics, Sindh, Pakistan; 2Institute of Science, Technology and Development, Mehran University, Jamshoro, Sindh, Pakistan.
Abstract | This paper is based on empirical evidence from Pakistan for 1981-2018. To analyze the impact of various factors on the diversification of crops towards high value crops, the Herfindahl Index (HI) was used to check the level of concentration or diversification in the structure of crops in Pakistan. The values of the Herfindahl index obtained as a result of the analysis indicate a high level of crop concentration and need to be diversified towards high value crops. The ARIMA time series model (1,1,1) was used to study the impact of various factors on the Transformed Herfindahl Index (THI) of diversity. To check the impact of improved infrastructure; the length of the road was adopted and showed a positive and significant relationship with crop diversification. Per capita income, urbanization, and profitability of minor crops were taken as demand side factors. Per capita income, urbanization and profitability of minor crops regression coefficients showed positive and significant impact on crop diversification. The technology was determined using fertilizers, the number of tubewells, Net Area Sown (NAS) and the production of tractors in quantity. The regression coefficients of fertilizers, number of tubewells and production of tractors showed positive and significant impact on crop diversification except Net Area Sown which showed negative impact but it was insignificant. The resource was identified with water availability (MAF) for irrigation purposes, which demonstrated a positive and significant association with crop diversification. To determine the effects of climate, rainfall was adopted in the model and showed a negative and significant relationship with crop diversification. It was found that development of infrastructure received a low priority in rural areas and it is recommended that cold storage in relevant areas, vibrant roads net work and consistency in power supply for cold storage should be developed on priorities basis that will help to minimize the post harvesting losses. The judicious use of fertilizer, efficient utilization of water and support price for fruits, vegetables, pulses and oilseeds are required for the promotion of high value crops.
Received | January 24, 2020; Accepted | November 04, 2020; Published | December 05, 2020
*Correspondence | Asif Ali Abro, Newports Institute of Communications and Economics, Sindh, Pakistan; Email: aliasifabro15@gmail.com
Citation | Abro, A.A. and I.A. Panhwar. 2020. Impact of various factors on crop diversification towards high value crops in Pakistan: An empirical analysis by using THI. Sarhad Journal of Agriculture, 36(4): 1254-1265.
DOI | http://dx.doi.org/10.17582/journal.sja/2020/36.4.1254.1265
Keywords | Crop concentration, Diversification, Herfindahl index, Major crops, Minor crops
Introduction
Agriculture sector plays a significant role in the economy of Pakistan; it contributed about 19 percent in Gross Domestic Product (GDP) and accounting for 38.5 percent of the total employment in the country. About 63.10 percent of the country’s population lives in rural areas, and rural residents directly or indirectly depend on the agricultural sector in obtaining livelihoods. Pakistan produces all major food crops, oilseeds, vegetables, pulses, fruits and fodder due to its different ecological regions, soil types, climate change and availability of plenty water. Crop sector contributed 37.1 percent value addition in the agriculture sector, during 2017-18 (GoP, 2018). Food security is one of the goals of Pakistan Vision-2025, it states that everybody living in Pakistan should have physical as well as economic access to adequate, secure and nutritious food to fulfill his nutritional requirements. It ensures the availability of quality of raw materials for their industries, as well as for exports (GoP, 2014).
One of the main tasks of farmers is to increase the ability of farmers to diversify their crops and generate higher income. Diversification of crops consists in changing the production portfolio from a low value to more profitable and valuable commodities, such as fruits, vegetables, milk, meat, eggs and fish, which increase the sources of income in agriculture. This applies not only to production processes, but also to new types of agricultural activity and marketing for produced goods. This activity expands the income sources of rural households and stimulates the economy as a whole in both rural and urban areas (Joshi et al., 2007). This goal, if achieved, will also ensure the rapid development of agriculture and the most efficient way to use the country’s limited resources (GoP, NCA-1987). Diversification of crops towards high-value crops can be achieved on a sustainable basis if farmers expand their capacity to modernize their production facilities based on the efficient use of land, water and fair prices they receive; market work is better, and market surpluses are additionally introduced into processing and packaging into value-added products for local needs, as well as for export. This requires the creation of a supply and cold chain infrastructure through the mobilization of public-private partnerships to obtain full market potential, post-harvest technologies and easy access to smallholder farmers’ farms to the market through developed infrastructure, especially in the areas with good agricultural potential (GoP, 11th Five Year Plan-2013-18).
The trend shows a sluggish pattern of crop diversification in crop sector in terms of grains, cash crops, pulses, oilseeds, vegetables, fruits and other minor crops from 1981 to 2018. The share of cereal crops (wheat, rice, bajra, jowar, maize and barley) accounted for 56 percent of the total acreage during 1981 and reached to 59 percent of the total acreage during the year 2018, with a 3 percent increase over the past three decades. In addition, the contribution of cash crops in 1981 was 15 percent and increased to 18 percent in the period until 2018, showing an increase of 3 percent. The share of pulses, oilseeds, vegetables, fruits and other minor crops were remained 5 percent, 2 percent, 1 percent, 3 percent and 10 percent, respectively, during the year 2017-18. The share of oilseed declined by 1 percent and vegetables remained at same level during the period from 1981 to 2018. The share of area under fruits growth showed a slight increase of 1 percent, while pulses decreased by 1 percent during the period under study (GoP, 2017-18). The category of other various minor crops acreage declined by 37.5 percent from 1981 to 2018 and same was captured by food and cash crops. Table 1 depicted the cropping pattern under various categories of crops.
Table 1: Share of different crops in percent to total cropped area during 1980-81 to 2017-18.
|
Year |
Food crops |
Cash crops |
Pulses |
Oilseeds |
Vegetables |
Condiments |
Fruits |
Others |
|
1980-81 |
56 |
15 |
6 |
3 |
1 |
1 |
2 |
16 |
|
1990-91 |
55 |
16 |
7 |
2 |
1 |
1 |
2 |
16 |
|
2000-01 |
56 |
18 |
6 |
3 |
1 |
1 |
3 |
12 |
|
2010-11 |
58 |
21 |
6 |
3 |
2 |
1 |
4 |
9 |
|
2017-18 |
59 |
18 |
5 |
2 |
1 |
1 |
3 |
10 |
Source: Agricultural Statistics of Pakistan (Various issues, 1980-81 to 2017-18).
There are two types of crops; major crops (wheat, rice, sugarcane, maize, gram and cotton) and minor crops (vegetables, fruits, pulses, fodder and oilseeds). Major and minor crops contributed 70.7 percent of the agriculture value added, while livestock, fishing and forestry sectors contributed for 28 percent, 0.8 percent and 0.6 percent, respectively during 1980. The share of major and minor crops declined during the last thirty-eight years and reached at 26 percent and 11.1 percent, respectively and their collectively share remained at 37.1 percent as of the agricultural value added, during 2017-18. Livestock showed a significant increase in agricultural value addition and contributed 58.7 percent. Fishing and forestry sector showed a little bit increases and contributed 2.1 percent and 2 percent respectively, in value addition to the agricultural sector during 2017-18. Detail is depicted in Table 2.
Due to the significant role of the crop sector in the economy, this sector remains a priority area to address the poverty alleviation, unemployment and sustainable economic development. Pakistan is giving priority to sustainable food security, from agriculture to agricultural value addition, increasing productivity of crops, import substitution, export orientation and diversification of crops from low value crops to high value crops. About 77 percent of the total cropped acreage was allocated for six major crops (wheat, rice, sugarcane, maize, gram and cotton) and remaining 23 percent of total cropped acreage was allocated for other small crops, during the year 2017-18. This showed that there was a provision for the diversification of crops towards high-value crops at some extent to maintain and increase farmers’ income, taking into account the availability of food crops for the growing population in Pakistan (GoP, 2017-18).
Table 2: Share of various sub-sectors of agriculture sector at constant basic prices.
|
Year |
Major crops |
Minor crops |
Total crop sector |
Livestock |
Fishing |
Forestry |
|
1980 |
57.5 |
13.2 |
70.7 |
28 |
0.8 |
0.6 |
|
1990 |
47.5 |
17.5 |
65 |
30 |
4 |
1.3 |
|
2000 |
37.1 |
13.6 |
50.7 |
45 |
1.6 |
2.5 |
|
2010 |
27.4 |
13.4 |
40.8 |
55 |
2.1 |
2.1 |
|
2018 |
26.0 |
11.1 |
37.1 |
58.7 |
2.1 |
2.0 |
Source: Economic Survey of Pakistan (various issues, 1980-81 to 2018-19).
The crop sector is a large segment of the economy, has been facing various problems in the production of oilseeds, pulses, dry fruits, spices and coffee/ tea. The situation in Pakistan is not favorable due to low level of local production of these crops, despite the potential at home. The import of these agricultural commodities during 1990-91 was about Rs13.957 billion and reached at Rs541.452 billion during 2017-18 (GoP, Agricultural Statistics of Pakistan, 1980-81). The import bills of these commodities are increasing year to year basis and are shown in Table 3.
Pakistan’s agricultural commodities imports make a significant contribution to Pakistan’s total imports. The main types of agricultural imports are edible oils and grains, pulses and tea (Rehman et al., 2016). Pakistan faced an acute shortage of edible oil production, about 82.1 percent of total demand was imported, and only 17.9 percent of the edible oil demand was met through domestic production. Results showed that domestic production of edible oil in 1980 was 247 thousand tons, and 465 thousand tons of edible oil was imported, which was 65.3 percent of the total availability in the same year. The major deficit was observed during 2007, 2008, 2012 and 2013, and domestic production of edible oil was recorded at 588 thousand tons, 565 thousand tons, 567 thousand tons and 573 thousand tons, respectively. Imports for the same periods were 2700 thousand tons, 2489 thousand tons, 2502 thousand tons and 2627 thousand tons, which were 82.1 percent, 81.5 percent, 81.5 percent and 82.1 respectively of the total food oil consumption in Pakistan (Abro et al., 2016).
The local oilseed production was only 15.6 percent of the total consumption, while the remaining huge shortage of 84.4 percent was fulfilled through imports, during 2017-18 (GoP, 2017-18). The import of oilseed crops, pulses, dry fruits, spices has been growing rapidly due to decline in local production as well as low yield of these crops and causing the huge expenditure on its import. Farmers are less concerned to increase the area and production of oilseed crops on the grounds that growing season of oilseed crops coincides to growing season of wheat. They are unwilling to give up their main crop. To address the concerns of farmers by ensuring excellent return in the market, the sunflower and some other oilseed crops, pulses, dry fruits, spices and tea must be promoted and processing capacity of the country should be improved to meet the needs of the people of Pakistan.
Objectives of the study
The objective of the study is to identify the factors that induce crop diversification towards high value crops in Pakistan.
There are a number of studies that have been analyzed and discussed various aspects of crop diversification. However, chronological order was retained to understand crop diversification over the study period (1982-2016).
To analysis the impact of various factors on agricultural output, it was observed that the development of rural infrastructure, the use of agricultural loans to farmers, and the rise in land values have been associated with increased agricultural production (Anderson et al., 1982). The main parameters affecting the level of crop diversification were farm size, price volatility, net agricultural value and irrigation concentration (Gupta et al., 1985). Rural infrastructure was found to play a significant role in the profitability and success of crop diversification towards the production of minor crops and to lower transaction costs (Chand, 1995). The impact of agricultural diversification on small-farm economies has been observed in the Kangra region of Himachal Pradesh. It was noted that the diversification of agriculture, such as poultry, beekeeping, high-yielding dairy animals, floriculture, etc., tends to increase income from 6 to 138 percent. In addition, capital and credit requirements tend to increase with diversification. It has been suggested that financial institutions create appropriate conditions to diversify existing agricultural systems into the most structured, profitable and technically feasible enterprises (Saini et al., 1996).
In addition, various other diversification and concentration indices, such as the Herfindahl Index (HI), the Ogive Index (OI), the Entropy Index (EI), and the Modified Entropy Index (MEI), were used to test the degree of crop diversification and its variation in various parts of West Bengal. It has been observed that large-scale differences in crop diversification in overtime areas are dependent on increased use of improved agricultural technologies (De, 2000). To test the structure of crop diversification in Indian states using the model with double log equation of ordinary least square (OLS) with Simpson Index for Diversification (SID) as dependent variable.
Table 3: Import of other agricultural commodities from 1985-86 to 2017-18.
|
(Value in Million Rs.) |
||||||||
|
Year |
Palm oil |
Soyabean oil |
Oilseeds and oleagionous fruits |
Pulses |
Dry fruits/fruits |
Spices |
Tea/coffee |
Total |
|
1990-91 |
5,259.60 |
3,760.70 |
|
651.8 |
209.3 |
346.5 |
3,728.70 |
13,956.60 |
|
1991-92 |
8,057.60 |
1,967.60 |
|
1,269.20 |
247.8 |
331.4 |
4,305.70 |
16,179.30 |
|
1992-93 |
11,739.10 |
3,446.60 |
|
1,735.50 |
296.8 |
306.3 |
5,395.70 |
22,920.00 |
|
1993-94 |
12,291.60 |
2,406.90 |
|
1,319.00 |
458.1 |
506 |
5,624.30 |
22,605.90 |
|
1994-95 |
25,642.00 |
5,138.80 |
|
1,916.30 |
488.9 |
455.6 |
5,799.70 |
39,441.30 |
|
1995-96 |
24,777.70 |
3,897.00 |
|
2,965.50 |
679.2 |
273.1 |
5,733.10 |
38,325.60 |
|
1996-97 |
19,236.00 |
4,670.00 |
|
1,133.20 |
735.5 |
405.3 |
9,373.30 |
35,553.30 |
|
1997-98 |
29,022.70 |
4,281.70 |
|
1,753.00 |
776.8 |
414.4 |
9,840.80 |
46,089.40 |
|
1998-99 |
29,303.50 |
11,232.20 |
|
2,687.00 |
1,038.50 |
2,312.90 |
11,157.90 |
57,732.00 |
|
1999-00 |
16,828.60 |
4,573.30 |
|
2,762.10 |
1,471.40 |
1,580.00 |
10,916.00 |
38,131.40 |
|
2000-01 |
16,489.40 |
2,555.40 |
|
6,587.50 |
3,176.70 |
1,097.10 |
12,042.70 |
41,948.80 |
|
2001-02 |
23,247.30 |
787 |
|
8,311.10 |
3,083.00 |
1,039.60 |
9,627.50 |
46,095.50 |
|
2002-03 |
31,532.60 |
2,755.90 |
|
6,800.90 |
2,765.80 |
1,337.10 |
10,095.20 |
55,287.50 |
|
2003-04 |
35,294.40 |
2,622.80 |
3,508.00 |
4,312.20 |
1,055.30 |
2,348.70 |
11,078.30 |
60,219.70 |
|
2004-05 |
41,730.70 |
3,244.30 |
14,481.10 |
7,269.80 |
2,592.90 |
2,806.80 |
13,202.00 |
85,327.60 |
|
2005-06 |
42,926.50 |
1,285.60 |
19,351.20 |
10,406.50 |
3,459.20 |
3,158.70 |
13,336.00 |
93,923.70 |
|
2006-07 |
55,528.80 |
2,467.60 |
25,561.80 |
14,838.70 |
4,137.60 |
3,274.60 |
12,965.00 |
118,774.10 |
|
2007-08 |
101,971.10 |
6,456.20 |
28,840.30 |
12,689.30 |
4,963.00 |
5,378.40 |
12,653.20 |
172,951.50 |
|
2008-09 |
109,052.60 |
6,989.50 |
26,361.00 |
18,544.20 |
6,629.20 |
5,543.10 |
17,417.30 |
190,536.90 |
|
2009-10 |
109,948.70 |
2,339.40 |
45,785.90 |
21,978.10 |
7,316.40 |
6,768.00 |
22,712.10 |
216,848.60 |
|
2010-11 |
172,702.00 |
5,722.20 |
42,217.30 |
34,477.40 |
7,537.70 |
8,892.90 |
28,560.40 |
300,109.90 |
|
2011-12 |
211,826.20 |
4,560.50 |
58,569.30 |
38,810.90 |
8,123.40 |
8,992.50 |
31,291.60 |
362,174.40 |
|
2012-13 |
189,618.00 |
7,157.90 |
43,875.10 |
31,500.60 |
7,955.10 |
6,495.30 |
35,631.50 |
322,233.50 |
|
2013-14 |
195,230.20 |
11,724.90 |
39,269.90 |
31,526.20 |
10,515.10 |
9,469.90 |
30,827.20 |
328,563.40 |
|
2014-15 |
180,316.00 |
10,264.00 |
83,861.30 |
41,447.70 |
11,898.50 |
11,058.20 |
34,532.50 |
373,378.20 |
|
2015-16 |
176,102.20 |
19,097.60 |
88,512.60 |
62,063.70 |
17,941.30 |
15,366.30 |
53,491.30 |
432,575.00 |
|
2016-17 |
199,473.30 |
12,854.40 |
109,277.40 |
99,721.30 |
18,894.50 |
14,514.80 |
54,839.50 |
509,575.20 |
|
2017-18 |
223,878.70 |
14,683.50 |
154,717.20 |
58,783.70 |
10,626.10 |
18,394.50 |
60,368.50 |
541,452.20 |
Source: Agricultural statistics of Pakistan (1986-87 to 2017-18).
It was found that road density, number of regulated markets, area under high yielding varieties, percentage of irrigated area, number of electrified villages, fertilizer consumption per hectare of net cultivated area, per capita value of agricultural output and population per hectare of net sown area, were the factors that influenced the agricultural diversification towards high value crops (Singh et al., 2006).
Urbanization was another important factor in the growth of high value crops; it was also found that infrastructure development, the provision of credit to farmers, and technological progress were other determinants that helped to increase the production of high value crops (Joshi et al., 2007). The Simpson Index of Diversity (SID) was used to identify crop diversification as the main strategy to increase income and reduce rural poverty in rural northern Nigeria, which concluded that tractor availability, huge returns to crop production, respondent’s age, educational level, the number of extension visits and the availability of electricity have determined crop diversification in favor of high value crops (Ibrahim et al., 2009). The choice in favor of agricultural growth remained diversifying land use to grow environmentally friendly and more profitable crops. The choice of highly profitable crops also depended on having adequate infrastructure requirements to ensure easy access to markets, timely harvest, protection from post-harvest losses, and proper marketing of these crops (De, 2013).
The other variables that influenced crop yields in Pakistan were examined using time series data from 1972 to 2012. Various factors such as yield, water availability, number of tubewells, number of tractors, improved seeds, agribusiness work and compost use were used to test the impact on horticultural yields. Johansen co-integration approach was used to achieve results. The number of tubewells, the number of tractors, access to water, labor employed in the farming area, and improved seed were the significant determinants of horticultural output in Pakistan (Raza and Siddiqui, 2014). The OLS technique was used to test the influence of various factors on the Index of High Value Crops (IHVC) in Pakistan. The coefficient of import of oilseeds demonstrated a negative and significant relationship with IHVC. The coefficient of accessibility of credit, farm apparatus, number of tubewells and local production of oilseed crops indicated positive significant connection with the IHVC (Abro et al., 2016).
Materials and Methods
Measurement of crop diversification
Diversification of crops can be studied using various indices, such as the Herfindahl Index (HI), the Simpson Index (SI), the Entropy Index (EI), the Modified Entropic Index (MEI) and the Ogive Index (OI). The most widely used indices in the diversification of agriculture are HI, SI and the entropy index. Here we use the Herfindahl Index (HI), commonly known as Herfindahl Hirschman Index or HHI, to record changes in the level of concentration and diversification in the structure of crops in Pakistan.
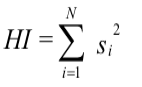
The Herfindahl Index (HI) is defined as the sum of the squares of the “n” proportion. This is a simple measure of concentration, which shows an increase in diversification, the value of the Herfindahl index decreases. The increasing value of the Herfindahl index indicates that diversification of crops is declining, and this is an inverse relationship. That is;
Where;
si represents the proportion of area under ith crop to Gross Cropped Area (GCA). The value of Herfindahl index lies between one and zero but if we use whole percentages then the index ranges from 0 to 10,000 points. It takes value one (or 10,000 points) in case of perfect specialization and zero (or 0 points) in case of perfect diversification i.e an index of 0.25 is equal to 2,500 points. This index gives more weight to large proportion of farm acreage involved in a particular category of crops in relation to concentration ratio. Lower the value of Herfindahl index indicates the more crop diversification and more the value of Herfindahl index resulting less crop diversification.
We examined the share of different crops categories in gross cropped area of Pakistan, during 1980-81 to 2017-18. The data on area under various crops such as; food crops, cash crops, pulses, oilseeds, vegetables, condiments, fruits and others was sourced from Agricultural Statistics of Pakistan (various issues).
Basic criteria of herfindahl index (HI)
- Herfindahl index below 100 (or 0.01) indicates a high level of crop diversification in the country.
- Herfindahl index below 1,500 (or 0.15) shows dispersion in crop diversification.
- Herfindahl index between 1,500 (or 0.15) to 2,500 (or 0.25) indicate a moderate level of crop diversification.
- Herfindahl index above 2,500 (or 0.25) indicates a high level of crop concentration in the country’s cropping pattern (Abro, 2017).
Calculation of Herfindahl index by using percent of crop share
The Herfindahl index is used as the square of the percentage crop share of each crop sum of squares of ‘n’ proportion. This is a simple measure of concentration which shows for increasing diversification, Herfindahl index is decreasing and vice versa. That is;
HI= (share of food crops)2 +(share of cash crops)2+(share of pulses)2 +(share of oilseeds)2 +(share of vegetables)2 +(share of condiments)2+(share of fruits)2+(share of others)2
The values of Herfindahl Index and Transformed Herfindahl Index obtained from the share of percentage of various categories of crops from 1980-81 to 2017-18 are given in Table 4.
The values of Herfindahl Index obtained from the share percentage of various categories of crops are plotted in Figure 1. Index pattern showed that the values of Herfindahl Index were all above the range of 2,500 points (or 0.25) which indicated a high level of crop concentration in the country’s cropping pattern. It is a need of time that the crop diversification towards various other high value crops could be initiated for the sustainable income of the rural household.
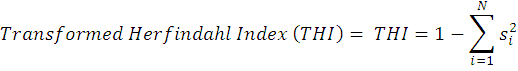
Since the Herfindahl index is a measure of concentration and it has an inverse relationship with diversification. Lower the value of index shows the higher level of diversification. Due to that reason, we transformed Herfindahl Index by subtracting it from 1 (one) i.e THI= 1-HI or = 1-ΣNi=1 si2 to have a direct relationship. This measure has a similarity with the Simpson diversity index which is also a diversity index used in ecology. The Transformed Herfindahl Index (THI) formula is as under;
After transforming Herfindahl Index, now it shows the direct relationship between the transformed value of Herfindahl Index (1-HI) and diversification. It increases with the increase in diversification and decreases with the decreasing in diversification. Zero value of transformed index in this case shows a perfect concentration where only one crop is cultivated and one shows the high level of diversification. One null hypothesis “Demand side and supply side factors do not affect crop diversification towards high value crops in Pakistan” is framed to test against alternatives hypothesis that states “Demand side and supply side factors induce crop diversification towards high value crops in Pakistan” by using the following analytical/ mathematical tools.
We used ARIMA (Autoregressive Integrated Moving average) time series data model. This is a combination of Autoregressive-AR (p), difference data and Moving average-MA (q) models. Estimation and forecasting of the model of one-dimensional time series is carried out using the Box-Jenkins methodology (B-J). It has three main stages, such as identification, evaluation and diagnostic verification. The methodology B-J is applicable only to stationary variables. Autoregressive-AR(p) model is one in which Yt depends only on its own past values such as; Yt = f (Yt-1 , Yt-2 , Yt-3 .......ϵt). A common representation of an Autoregressive model where it depends on ‘ρ’ of its past values is as under;
Yt = β0 + β1Yt-1 + β2Yt-2 + β3Yt-3 + ......+βpYt-p + ϵt ….(1)
Moving average-MA(q) model is one in which Yt depends only on the random error terms which follow a white noise process i.e Yt = f(ϵt , ϵt-1, ϵt-2 ......). A Common representation of a Moving average model where it depends on ‘q’ of its past values called MA(q) model and is represented as under;
Yt = β0 + ϵt + ϕ1ϵt-1+ ϕ2ϵt-2 + ϕ3ϵt-3+ .....+ ϕq ϵt-q ..(2)
The error terms ϵt are assumed to be white noise with mean- E(ϵt) equal to zero and variance (ϵt ) equal to δ2.
Table 4: Herfindahl index and transformed Herfindahl index values.
|
Year |
HI (in points) |
HI (in decimals) |
THI/SID= 10000-HI |
THI/SID= 1-HI |
|
1980-81 |
3668 |
0.3668 |
6332 |
0.6332 |
|
1981-82 |
3668 |
0.3668 |
6332 |
0.6332 |
|
1982-83 |
3668 |
0.3668 |
6332 |
0.6332 |
|
1983-84 |
3676 |
0.3676 |
6324 |
0.6324 |
|
1984-85 |
3652 |
0.3652 |
6348 |
0.6348 |
|
1985-86 |
3570 |
0.3570 |
6430 |
0.6430 |
|
1986-87 |
3676 |
0.3676 |
6324 |
0.6324 |
|
1987-88 |
3702 |
0.3702 |
6298 |
0.6298 |
|
1988-89 |
3520 |
0.3520 |
6480 |
0.6480 |
|
1989-90 |
3676 |
0.3676 |
6324 |
0.6324 |
|
1990-91 |
3596 |
0.3596 |
6404 |
0.6404 |
|
1991-92 |
3520 |
0.3520 |
6480 |
0.6480 |
|
1992-93 |
3520 |
0.3520 |
6480 |
0.6480 |
|
1993-94 |
3604 |
0.3604 |
6396 |
0.6396 |
|
1994-95 |
3668 |
0.3668 |
6332 |
0.6332 |
|
1995-96 |
3571 |
0.3571 |
6429 |
0.6429 |
|
1996-97 |
3408 |
0.3408 |
6592 |
0.6592 |
|
1997-98 |
3562 |
0.3562 |
6438 |
0.6438 |
|
1998-99 |
3576 |
0.3576 |
6424 |
0.6424 |
|
1999-00 |
3637 |
0.3637 |
6363 |
0.6363 |
|
2000-01 |
3660 |
0.3660 |
6340 |
0.6340 |
|
2001-02 |
3516 |
0.3516 |
6484 |
0.6484 |
|
2002-03 |
3602 |
0.3602 |
6398 |
0.6398 |
|
2003-04 |
3566 |
0.3566 |
6434 |
0.6434 |
|
2004-05 |
3558 |
0.3558 |
6442 |
0.6442 |
|
2005-06 |
3647 |
0.3647 |
6353 |
0.6353 |
|
2006-07 |
3536 |
0.3536 |
6464 |
0.6464 |
|
2007-08 |
3552 |
0.3552 |
6448 |
0.6448 |
|
2008-09 |
3800 |
0.3800 |
6200 |
0.6200 |
|
2009-10 |
3835 |
0.3835 |
6165 |
0.6165 |
|
2010-11 |
3952 |
0.3952 |
6048 |
0.6048 |
|
2011-12 |
3851 |
0.3851 |
6149 |
0.6149 |
|
2012-13 |
3693 |
0.3693 |
6307 |
0.6307 |
|
2013-14 |
4176 |
0.4176 |
5824 |
0.5824 |
|
2014-15 |
4286 |
0.4286 |
5716 |
0.5716 |
|
2015-16 |
3828 |
0.3828 |
6172 |
0.6172 |
|
2016-17 |
4243 |
0.4243 |
5757 |
0.5757 |
|
2017-18 |
3945 |
0.3945 |
6055 |
0.6055 |
Source: Agricultural Statistics of Pakistan (1980-81 to 2017-18).
Note: Calculations made by Author.
A series which is non-stationary can be stationary after differencing. A series is stationary after differentiated once is said to be Integrated of order-1 and is denoted by I(1). In general, the series is stationary after the differentiated “d” times are said to be integrated in the order “d”, denoted by I(d). There is a situation where time series can be represented as a combination of AR (p), the data difference i.e Δ(delta) and MA (q), called the ARIMA (p, d, q) model. The general appearance of such a time series model, which depends on the “p” of its past values and “q” from past values of white noise disturbances, takes the form as under;
ΔYt = β0 + β1ΔYt-1 + β2ΔYt-2 + β3ΔYt-3 +....+βpΔYt-p + ϵt + ϕ1ϵt-1 + ϕ2ϵt-2 + ϕ3ϵt-3 +....+ ϕq ϵt-q …(3)
In time series models, the problem of autocorrelation is common. This violates the assumption that erroneous conditions are uncorrelated. Autocorrelation exists in time series models due to models with lagged endogenous variables, omitting an important variable or incorrect functional form of the model. It has various forms that lead to a different structure of the matrix of the auto-covariance error. In all these forms, the first order AR (1) represents a large part of the main part of the earlier, experimental concrete circumstances. Holding tabulation in front of this form, researchers in this area have developed procedures for its first detection, and then to solve the problem of autocorrelation.
The following econometric model is used to analyze the data to examine the determinants of crop diversification towards high value crops in Pakistan;
THI = f (Tech, Infer, Res, Dema, Rain, є)
The Transformed Herfindahl Index will be included as explained variable and other explanatory variables categorically grouped into “technology (Tech), infrastructure (Infr), resource (Res), demand (Dema) side and climate (Rain) related variables will be included in the model. To determine the impact of explanatory variables, a few proxy variables will be adopted. Such as for technology (Tech); number of tube wells/minor crops acreage in thousand hectares, for mechanization (production of tractors in numbers/ minor crops acreage in thousand hectares), Fertilizer off-take (000 N/T)/ NAS in million hectares and Net Area Sown in million hectares. For infrastructure (INFER), length of roads/ minor crops acreage in thousand hectares will be used as a proxy variable for the infrastructural development. Availability of water (MAF) will be used as proxy for available resources. Urban population in million, Profitability of minor crops in percent and Per capita income of the country will be included in the model as demand side variables. To determine the impact of climate on crop diversification, the annual rainfall (mm) will be included in the model.
Data sources
Data is collected from the Economic Survey of Pakistan (ESP) various issues, Federal Bureau of Statistics (FBS) various issues, Statistical Year Book (SYB) various issues, National Fertilizer development Centre, Government of Pakistan, Development Statistics of Pakistan (DSP) various issues, Agricultural Statistics of Pakistan (various issues), Population Census Reports (PCR) various issues and World Bank- data indicators.
Results and Discussion
The objective of the study was to identify the factors that induce crop diversification towards high value crops in Pakistan. A multiple regression analysis was performed to identify the impact of various factors on crop diversification towards high value crops. The Transformed Herfindahl Index (THI) was taken as an explained variable, and as the explanatory variables, various other factors influencing the diversification of crops were included. The following econometric model was used to analyze data from 1981 to 2018.
THI = f (Length of roads, Number of tubewells, PCI, Rainfall, Profitability of minor crops, availability of water, Number of tractors, use of fertilizer, NAS, Urbanization, є)
Results of the multivariate regression model are presented in Table 5. The F-value was 15.71 and found overall significant. The R2 value of 0.8997 meant 89.97 percent fits data extremely well keeping in view the nature of the data used in the model. The model was free from the heteroscedasticity and auto-correlation problems after performing its relevant tests.
To check the effect of infrastructural improvement; the length of the roads was added in the model. This demonstrated a positive and significant connection with the diversification of crops in relation to high-value crops. It concluded that a well-developed road network reduce transaction cost as well as marketing cost and has easy access to markets for the disposal of these crops; such facilities reduce losses after harvesting in the event of perishable products and encourage farmers to produce more high value crops to enhance their income.
Table 5: Determinants of crop diversification towards high value crops: double log estimates of generalized least square technique.
|
Explanatory variables; Method: ARMA Generalized Least Squares (Gauss-Newton) Sample: 1981-2018 |
Dependent variable: Transformed Herfindahl Index (THI) |
||||
|
Coefficient |
Std. Error |
t – value |
P. Value |
||
|
Length of roads |
0.089996 |
0.036322 |
2.477709 |
0.0218** |
|
|
Number of Tubewells (in 000) |
0.143323 |
0.026891 |
5.329727 |
0.0000* |
|
|
Per Capita Income in rupees |
0.156441 |
0.041454 |
3.773797 |
0.0011* |
|
|
Rainfall (in mm) |
-0.025902 |
0.009932 |
-2.608020 |
0.0164** |
|
|
Profitability of Minor crops (in percent) |
0.126440 |
0.020634 |
6.127837 |
0.0000* |
|
|
Availability of Water (MAF) |
0.297335 |
0.066589 |
5.465257 |
0.0002* |
|
|
Number of Tractors |
0.040034 |
0.006738 |
5.941222 |
0.0000* |
|
|
Use of fertilizer in thousand tons |
0.119766 |
0.027319 |
4.383974 |
0.0003* |
|
|
Net Area Sown in million hectares |
-0.052002 |
0.069953 |
-0.743387 |
0.4655 |
|
|
Urbanization |
2.712796 |
0.560812 |
4.837262 |
0.0001* |
|
|
C |
14.10982 |
1.328921 |
10.61750 |
0.0000* |
|
|
* 1 percent, ** 5 percent level of significance |
|||||
|
R-squared |
0.899771 |
||||
|
Adjusted R-squared |
0.842498 |
||||
|
Durbin-Watson stat |
2.015916 |
||||
|
F-statistic |
15.71007 |
||||
|
Prob(F-statistic) |
0.000000 |
||||
|
Author’s estimation |
|||||
Author’s estimation.
To observe the effect of demand side factors on the Transformed Herfindahl Index. The per capita income, urbanization and profitability of minor crops were adopted in the model. The regression coefficient of per capita income showed a positive and significant impact on diversification of agricultural crops. Results showed that increase in per capita income of individuals, enhanced the demand for high-value commodities. This is due to increase in the purchasing power of residents; they can demand more vegetables, fruits, pulses and oilseeds for their daily needs. The regression coefficient of urbanization showed a positive and significant impact on crop diversification towards high valuable crops. Due to the huge migration of people from rural areas to the big cities, the population of cities is growing rapidly; resulting into increase in the demand for minor crops. This demand for fruits, vegetables, pulses and oilseeds persuaded farmers to produce more commodities to fulfill the need of urban population consequentially more earning from these crops in addition to sustainability in their income. The profitability of minor crops regression coefficient showed positive and significant impact on diversification of crops. This has led to the fact that huge profitability in production of minor crops encouraged farmers to produce more vegetables, fruits, pulses and oilseeds in order to increase their income.
The technology was determined using fertilizers, the number of tubewells, Net Area Sown (NAS) and the production of tractors in quantity. The regression coefficient of fertilizers and the number of tubewells showed positive and significant effect on the diversification of crops. Results suggested that due to increase in the number of tubewells and the proper usage of fertilizers, the diversification of crops towards high value crops increased. The regression coefficient of agricultural machinery (tractors) had a positive and significant impact on the Transformed Herfindahl Index. This showed that farmers with tractors can diversify towards production of high value crops. Farmers could timely carry out various types of agricultural activities and easily deliver their products to the market. The regression coefficient of the Net Area Sown showed a negative relationship with the diversification of crops, but it was insignificant. This has led to an increase in the net cultivated area resulting in a decrease in crop diversity for valuable crops.
The resource was identified with water availability (MAF) for irrigation purposes, which demonstrated a positive and significant association with crop diversification. This led to the fact that the availability of water supported farmers, expanding them towards the production of valuable crops to increase their income.
To determine the impact of climate on crop diversification, the model adopted rainfall to assess the impact of climate on crop diversification. The Rainfall regression coefficient showed a negative and critical effect. This showed that crop diversification towards smaller crops will be limited in areas with higher rainfall. The farmers of these regions were inclined to grow rice and other water-loving crops. Farmers who are living in low to medium rainfall regions tend to expand towards high-value crops in order to increase their income and reduce risk.
Conclusions and Recommendations
Agricultural sector plays a significant role in Pakistan’s economy; it accounts for about 19% of gross domestic product (GDP), and it accounted for 38.5% of total employment in the country. About 63.10% of the country’s population lives in rural areas, and rural residents directly or indirectly depend on the agricultural sector in obtaining livelihoods. Pakistan produces all major food crops, oilseeds, vegetables, pulses, fruits and fodder due to various ecological regions, soil types, climate change and the availability of plenty water. Crop sector contributed 37.1% value addition in the agriculture sector, during 2017-18. The current trend shows a sluggish pattern of crop diversification in crop sector in terms of grains, cash crops, pulses, oilseeds, vegetables, fruits and other minor crops from 1981 to 2018.
To analyze the impact of various factors on the diversification of crops towards high value crops, the Herfindahl Index (HI) was used to check the level of concentration or diversification in the structure of crops in Pakistan. The values of the Herfindahl index obtained as a result of the analysis indicate a high level of crop concentration and need to be diversified towards high value crops. The ARIMA time series model (1,1,1) was used to study the impact of various factors on the Transformed Herfindahl Index (THI) of diversity. To check the impact of improved infrastructure; the length of the road was adopted and showed a positive and significant relationship with crop diversification. Per capita income, urbanization, and profitability of minor crops were taken as demand side factors. Per capita income, urbanization and profitability of minor crops regression coefficients showed positive and significant impact on crop diversification. The technology was determined using fertilizers, the number of tubewells, Net Area Sown (NAS) and the production of tractors in quantity. The regression coefficients of fertilizers, number of tubewells and production of tractors showed positive and significant impact on crop diversification except Net Area Sown which showed negative impact but it was insignificant. The resource was identified with water availability (MAF) for irrigation purposes, which demonstrated a positive and significant association with crop diversification. To determine the effects of climate, rainfall was adopted in the model and showed a negative and significant relationship with crop diversification. Results showed that we accepted the alternative hypothesis and concluded that demand side and supply side factors impacted crop diversification towards high value crops in Pakistan. It was observed that production of fruits, pulses, oilseeds and vegetables give farmers greater profitability due to the high net profit per unit of production and the numerous employment opportunities due to the labor-intensive nature. The following recommendations are offered to promote high value crops.
Development of rural infrastructure
The development of infrastructure in rural areas has received a low priority. There is a direct relationship between quality and quantity of infrastructure and quality of life. Development of infrastructure such as an access to cold storage, markets, stable power supply and transportation facilities play significant role for the promotion of high value crops due to perishable in nature, these crops are fragile in nature and are required to reach consumer’s doorstep in a short period of time for consumption. In Pakistan, the present status of infrastructure for agro-processing is insufficient and it is the need of time to develop the cold storage in relevant areas, vibrant roads net work and consistency in power supply for cold storage are the basic requirements for development of high value crops and to minimize the post harvesting losses.
Judicious use of fertilizer
Fertilizer is one of the most important and costly input used in crop production. The proper usage of fertilizers in crops increased about 30 to 50 percent yield in various production zone in Pakistan. It is noted that almost hundred percent of the soils are insufficient for nitrogen, 80-90% for phosphorus and 30% for potassium (GoP, 2014-15). While applying correct manuring/ fertilization amount, time and method of application and stage of crop growth must increase yield of high value crops.
Efficient utilization of water
The availability of water resources is also one of the important determinants of diversification of crops towards high value crops. This led to the fact that the water availability motivated farmers for diversifying the crops towards high value crops to increase their income. It is suggested that efforts should be made to keep the water channels clean and straight, leveling the fields, reduction in water transit losses by lining the canals and adoption of improved on farm water management techniques.
Support price for fruits, vegetables, Pulses and oilseeds
In Pakistan, the minimum support price for fruits, vegetables, pulses and oilseeds are not provided to farmers, the production and prices of these commodities are unstable and small farmers are facing income lost risk to grow these crops without the minimum support price due to volatility in their prices. It is stated that minimum support price for fruits, pulses, vegetables and oilseeds should be fixed to smoothing the income of farmers.
Novelty Statement
This research paper is innovative and adds new knowledge about the impact of various factors on crop diversification towards high value crops in Pakistan, which is the beginning of new ways to promote minor crops to ensure sustainable income for farmers.
Author’s Contribution
In this manuscript initial idea, data collection, methodology, write up was contributed by Asif Ali Abro while results and suggestions and proof reading was contributed by both authors Asif Ali Abro and Iqbal Ahmed Panhwar.
Conflict of interest
The authors have declared no conflict of interest.
References
Abro, A.A. and S. Mahapara. 2010. Poverty alleviation through diversifying towards high value crops in Pakistan. Int. J. Buss. Mgt. Eco. Res., 1(1): 1-8. http://www.ijbmer.com/docs/volumes/vol1issue1/ijbmer2010010101.pdf
Abro, A.A., 2012. Determinants of crop diversification towards high value crops in Pakistan. Int. J. Buss. Mgt. Eco. Res., 3(3): 536-545. http://www.ijbmer.com/docs/volumes/vol3issue3/ijbmer2012030304.pdf
Abro, A.A., 2017. Crop diversification towards high value crops and its determinants in Pakistan: An empirical analysis. Ph.D dissertation submitted to Department of Economics, University of Karachi (Unpublished, 2017) http://prr.hec.gov.pk/jspui/handle/123456789/9298.
Abro, A.A., Z. Atique and I.A. Panhwar. 2016. Does diversification towards oilseeds production reduce the import burden in Pakistan? sijmb.iba-suk.edu.pk., 3(1): 1-12. https://www.iba-suk.edu.pk/Content/pdf/publications/SIJMB/Volume%20%203%20No%201%20%20April%202016.pdf, https://doi.org/10.30537/sijmb.v3i1.134
Anderson, G.W., C.G. Vandervoort, C.M. Suggs and C. Clapp-Wincek. 1982. Rural roads evaluation summary report. AID program evaluation report 5. USAID, Washington, DC.
Bala, B. and S.D. Sharma. 2005. Effect on income and employment of diversification and commercialization of agriculture in Kullu district of Himachal Pradesh. Agric. Eco. Res. Rev., 18(2): 261-269. https://ideas.repec.org/a/ags/aerrae/58476.html
Chand, R., 1995. Agricultural diversification and small farm development in western Himalayan Region, national workshop on small farm diversification: Problems and prospects, NCAP, New Delhi. http://www.ncap.res.in/upload_files/workshop/ws1_chapter5.pdf
De, U.K., 2000. Diversification of crop in west Bengal: A spatio-temporal analysis. Artha Vijnana., 42(2): 170-182. https://doi.org/10.21648/arthavij/2000/v42/i2/115897
De, U.K., 2013. Infrastructural growth, farm size and pattern of crop diversification across the districts of West Bengal. Glob. J. Sci. Fron. Res. Agric. Vet., 13(5): 1-28. https://globaljournals.org/journals/science-frontier-research-journal
Godfrey, L.G., 1996. Misspecification tests and their uses in econometrics. (econometric methodology- II) J. Stat. Pl. Infer., 49(2): 241–260. https://www.sciencedirect.com/science/article/abs/pii/0378375895000399, https://doi.org/10.1016/0378-3758(95)00039-9
GoP, Agricultural Statistics of Pakistan (1980-81, 1985-86, 1990-91, 1997-98, 2002-03, 2004-05, 2008-09, 2017-18). http://www.pbs.gov.pk/agri-stat-tables
GoP, Economic Survey of Pakistan. 1985-86, 1990-91, 2000-01, 2005-06, 2018-19. Economic Advisor’s Wing, Finance Division, Islamabad. http://www.finance.gov.pk/survey_1819.html
GoP, Eleventh Five Year Plan, 2013-18. Planning commission, ministry of planning, development and reform, Islamabad. https://www.pc.gov.pk/web/yearplan
GoP, Fifty years of Pakistan, 2005. Federal bureau of statistics, statistics division, Islamabad. http://www.pbs.gov.pk/content/50-years-pakistan-volume-i-5
GoP, Agricultural Statistics of Pakistan (1980-81, 1985-86, 1990-91, 1997-98, 2002-03, 2004-05, 2008-09, 2017-18). http://www.pbs.gov.pk/agri-stat-tables
GoP, National Commission on Agriculture,1987. Draft Report. Part, 1-3.
Gujarati, D.N., 2004. Basic Econometrics, 4th ed., McGraw-Hill, New York. https://www.amazon.com/Basic-Econometrics-4th-Damodar-Gujarati/dp/0070597936
Gunasena, H.P.M., 2001. Intensification of crop diversification in the Asia- pacific region. FAO. http://www.fao.org/3/X6906E/x6906e0e.htm
Gupta, R.P. and S.K. Tewari. 1985. Factors affecting Crop Diversification: An empirical analysis. Ind. J. Agric. Eco., 40(3): 304-311. https://ideas.repec.org/a/ags/inijae/271340.html
Herfindahl, O.C., 1950. Concentration in the steel industry (Doctoral dissertation, Columbia University).
Hirschman, A.O., 1945. National power and the structure of foreign trade. Los Angeles: University of California Press. https://dspace.gipe.ac.in/xmlui/bitstream/handle/10973/29303/GIPE-026809.pdf
Hirschman, A.O., 1964. The Paternity of an index. Am. Eco Rev., 54(5): 761-762. https://www.jstor.org/stable/1818582
Ibrahim, H., S.A. Rahman, E.E. Envulus and S.O. Oyewole. 2009. Income and crop diversification among farming households in a rural area of north central Nigeria. J. Trop. Agric. Food Env. Ext., 8(2): 84-89. https://www.ajol.info/index.php/as/article/view/51102, https://doi.org/10.4314/as.v8i2.51102
Jha, B., A. Tripathi and B. Mohanty. 2009. Drivers of agricultural diversification in India, Haryana and the greenbelt farms in India. Working paper series No. E/303/2009. http://www.iegindia.org/upload/publication/Workpap/wp303.pdf
Joshi, P.K., A. Gulati and R.J. Cummings. 2007. Agricultural diversification and smallholders in South Asia (ed.) New Delhi: Academic Foundation. https://www.ifpri.org/publication/agricultural-diversification-and-smallholders-south-asia
Joshi, P.K., 2005. Crop diversification in India: nature, pattern and drivers. New Delhi India: Asian Development Bank.
Joshi, P.K., A. Gulati and R.J. Cummings. 2007.Agricultural diversification and smallholders in South Asia (ed.) New Delhi: Academic Foundation.
Lone, R.A., 2013. Agricultural diversification towards high value commodities in South Asia. Int. J. Tra. Glob. Busi. Pers., 2(4): 688-694. https://www.academia.edu/8723302/agricultural_diversification_towarrds_high_value _commodities_in_south_asia
Mishra, A. and H. El-Osta. 2002. Risk management through enterprise diversification: A farm level analysis. Paper presented at AAEA meetings in Long Beach, CA, USA. http://citeseerx.ist.psu.edu/viewdoc/d?doi=10.1.1.533.895andrep=rep1andtype=pdf
Ojo, M.A., A.O. Ojo, A.I. Odine and A. Ogaji. 2014. Determinants of crop diversification among small-scale food crops farmers in north central, Nigeria. PAT 10(2): 1-11. https://www.semanticscholar.org/paper/Determinants-of-Crop-Diversification-among-Small-%E2%80%93-Odine/1ba6bd5ecff710881be0c135d2f736e0e85bd4?p2df
Pingali, P.L. and M.W. Rosegrant. 1995. Agricultural commercialization and diversification: Processes and policies. Food Policy, 20(3): 171-186. http://213.154.74.164/invenio/record/14001/files/pingalia.pdf, https://doi.org/10.1016/0306-9192(95)00012-4
Raza, J., and W. Siddiqui. 2014. Determinants of agricultural output in Pakistan: A Johansen co-integration approach. Acad. Res. Int., 5(4): 30-46. http://www.savap.org.pk/journals/ARInt./Vol.5(4)/2014(5.4-04).pdf
Rehman, A., L. Jingdong and I. Hussain. 2016. Pakistan’s major exports and imports role and importance for agriculture and economic development. ARIS J., 12(01): 162-172. https://www.uacm.edu.mx/andamios
Saini, A.S., K.D. Sharma and B.K. Singh. 1996. Impact of Diversification on small farms economy in Himachal Pradesh. Ind. J. Agric. Eco., 51(4): 697-698. https://www.semanticscholar.org/paper/Crop-Diversification-in-Himachal-Pradesh%3A-Patterns%2C-Sharma/1adb7608220b642359201694a10d8a0bc4fb8c0
Sharma, V.P. and D. Jain. 2011. High-value agriculture in India: Past trends and future prospects. Ind. Inst. of Mgt. Ahmedabad, India. https://web.iima.ac.in/assets/snippets/workingpaperpdf/21442132562011-07-02.pdf
Singh A.J., K.K. Jain and S. Inder. 1985. Diversification of Punjab agriculture: An econometric analysis. Ind. J. Agric. Eco., 40(3): 298-303. https://ageconsearch.umn.edu/record/271339?ln=en DOI: 10.22004/ag.econ.271339
Singh N.P., R. Kumar and R.P. Singh. 2006. Diversification of Indian agriculture: Composition, determinants and trade implications. Agric. Eco. Res. Rev., 19 (Conf-2006): 23-36. https://core.ac.uk/download/pdf/6689676.pdf
To share on other social networks, click on any share button. What are these?


