
Impact of Early Immune Challenge by LPS on Nitric Oxide Release Dynamics in the Neonatal Rat Brain: Triggering Long-lasting Sex- and Age-Related Affective Behavioral Alterations in Adolescence


Impact of Early Immune Challenge by LPS on Nitric Oxide Release Dynamics in the Neonatal Rat Brain: Triggering Long-lasting Sex- and Age-Related Affective Behavioral Alterations in Adolescence
Laila Ibouzine-Dine1*, Inssaf Berkiks1,2, Hasnaa Mallouk1, Mouloud Lamtai1, Zineb El Marzouki1, Amal Dimaoui1, Abdelhalem Mesfioui1, Aboubaker El Hessni1
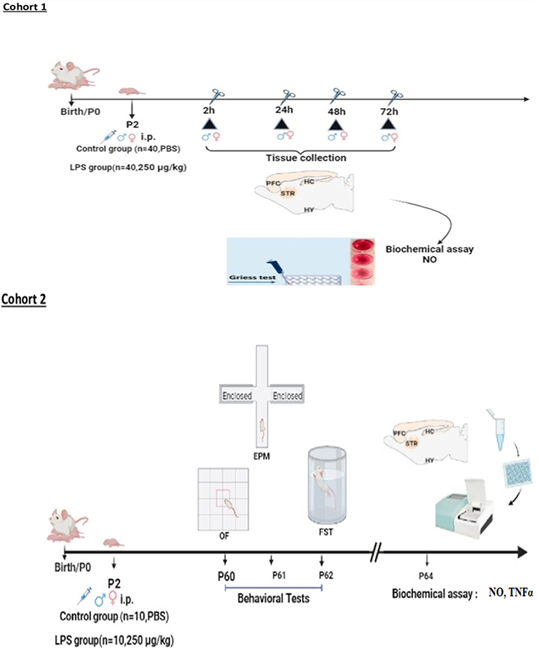
Schematic of the study design and timeline for the experimental process. Two cohorts of rats were employed. In Cohort 1, male (♂ blue) and female (♀ red) Wistar rat pups were sacrificed at 2, 24, 48, and 72 hours post-injection of either (lipopolysaccharide) LPS or PBS (Phosphate Buffer Saline) at postnatal day 2 (P2). The prefrontal cortex (PFC), striatum (STR), hippocampus (HC), and hypothalamus (HY) were dissected to assess nitric oxide (NO) levels. In the second cohort, male and female rats were administered LPS at P2 and subjected to three different behavioral tasks in the following order: open field (OF), elevated plus maze (EPM), and forced swim test (FST) at P60. After sacrifice, brain structures (prefrontal cortex, striatum, hippocampus, and hypothalamus) were collected to assess NO and TNFα levels.
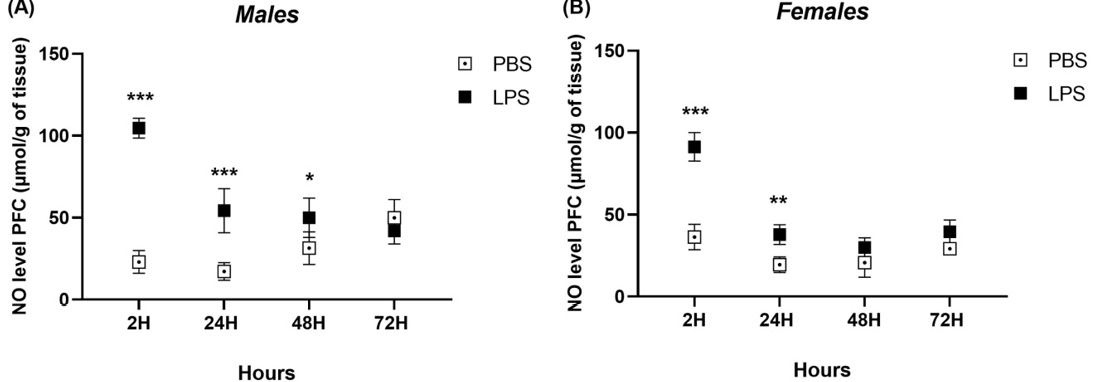
Kinetics of nitric oxide (NO) levels in the prefrontal cortex (PFC) of male (A) and female (B) rats following a single intraperitoneal injection of either lipopolysaccharide (LPS) or phosphate-buffered saline (PBS) as a control over 72 hours in PND2. The significance level is 0.05. *p < 0.05 vs. PBS group, according to two-way ANOVA following post-hoc (comparisons Bonferroni’s multiple comparisons test).
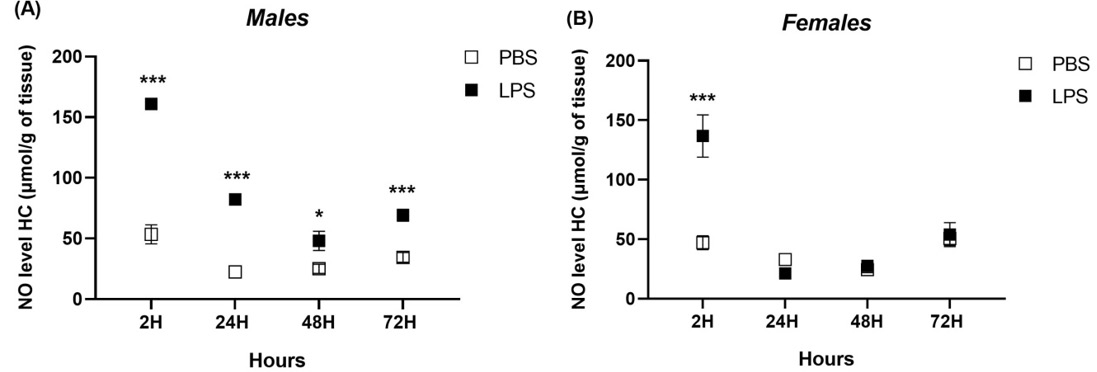
Kinetics of nitric oxide (NO) levels in the hippocampus (HC) of male (A) and female (B) rats following a single intraperitoneal injection of either lipopolysaccharide (LPS) or phosphate-buffered saline (PBS) as a control over 72 hours in PND2. The significance level is 0.05. *p < 0.05 vs. PBS group, according to two-way ANOVA following post-hoc (comparisons Bonferroni’s multiple comparisons test).
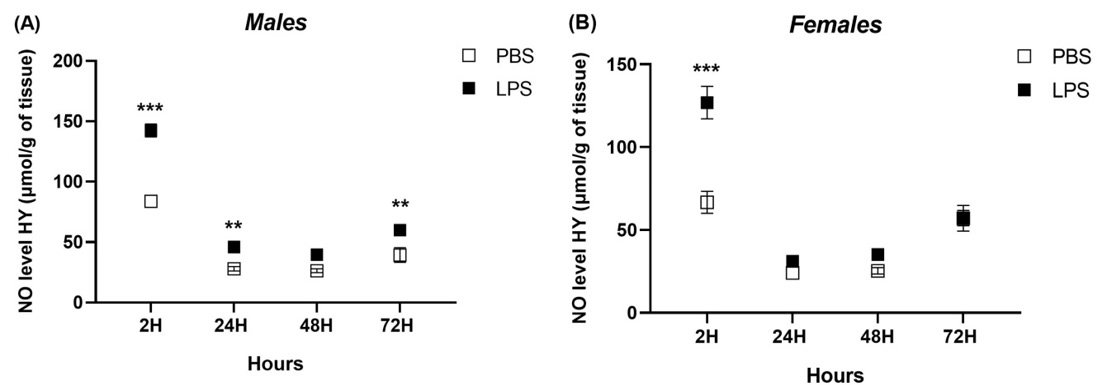
Kinetics of nitric oxide (NO) levels in the hypothalamus (HY) of male and female rats following a single intraperitoneal injection of either lipopolysaccharide (LPS) or phosphate-buffered saline (PBS) as a control over 72 hours in PND2. The significance level is 0.05. *p < 0.05 vs. PBS group, according to a two-way ANOVA following post-hoc (comparisons Bonferroni’s multiple comparisons test).
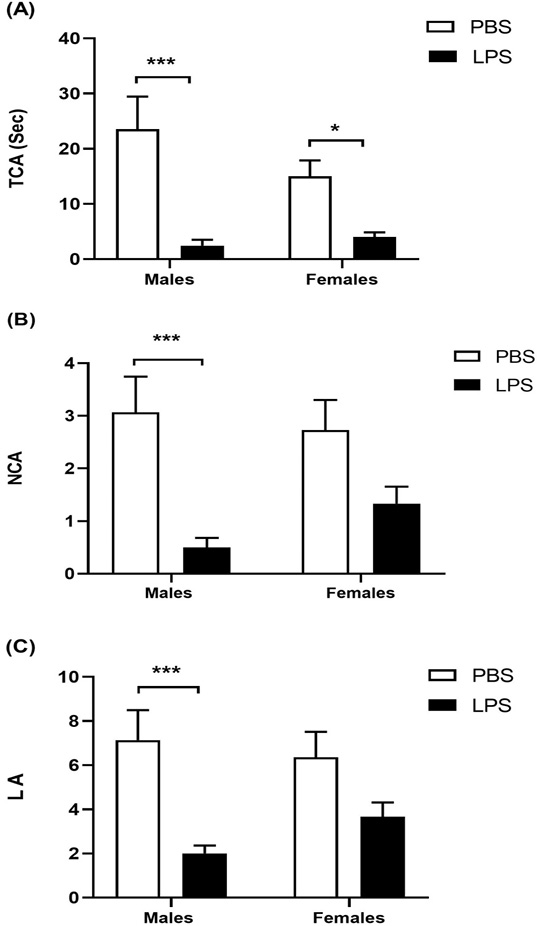
Behavioral performances of male and female rats in the open field test. A) Total amount of time spent in the central area (TCA) measured in seconds, B) Number of entries into the center area (NCA), C) Locomotor Activity (LA). The data are presented as means; ± SEM. *p < 0.05 vs. PBS group; and #p < 0.05 vs. gender counterpart.
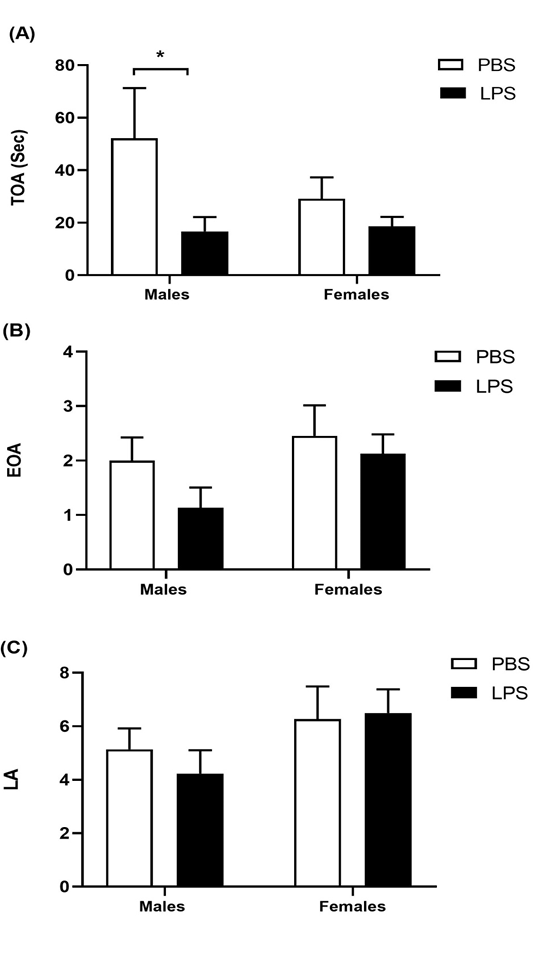
Behavioral performance of male and female rats measured in the elevated plus maze test. A) Total amount of time spent in the open arms (TOA), measured in seconds; B) Number of entries in the open arms (EOA); C) Locomotor Activity (LA). The data are presented as means ± SEM. *p < 0.05 vs. PBS group; and #p < 0.05 vs. gender counterpart.
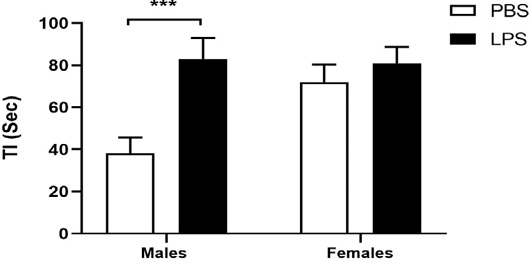
Behavioral performance of male and female rats measured in the forced swimming test. Total time of immobility (TI), measured in seconds. The data are presented as means; ± SEM. *p < 0.05 vs. PBS group; and #p < 0.05 vs. gender counterpart.
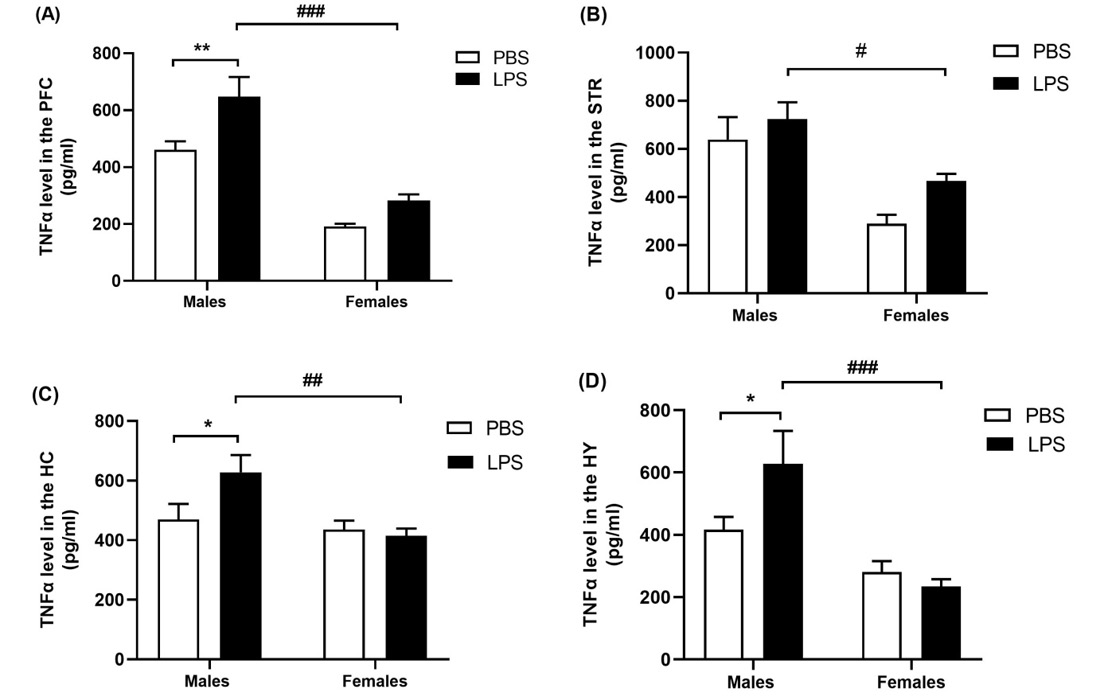
Concentrations of TNF alpha (TNFα) in different regions of male and female rat brain. A) NO level in the prefrontal cortex (PFC). B) NO level in the hippocampus (HC) .C) NO level in the striatum (STR). NO level in the hypothalamus (HY). The data are presented as means ± SEM. *p < 0.05 vs. PBS group; and #p < 0.05 vs. gender counterpart.
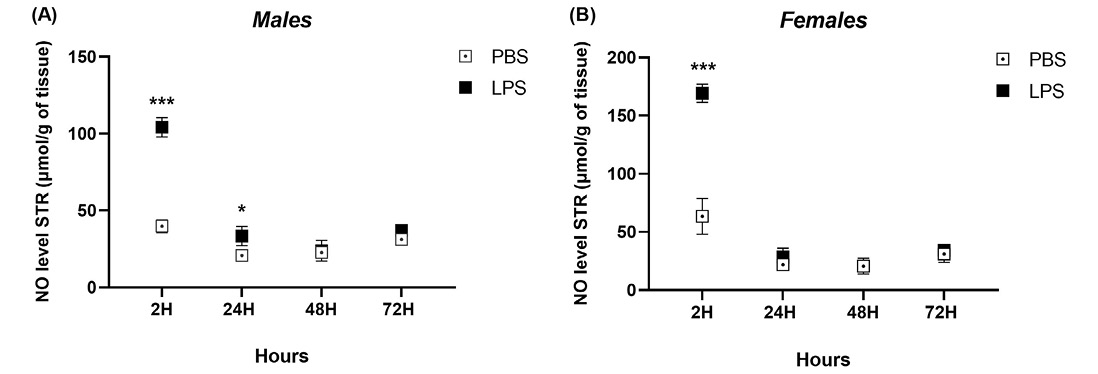
Kinetics of nitric oxide (NO) levels in the striatum (STR) of male (A) and female (B) rats following a single intraperitoneal injection of either lipopolysaccharide (LPS) or phosphate-buffered saline (PBS) as a control over 72 hours in PND2. The significance level is 0.05. *p < 0.05 vs. PBS group, according to two-way ANOVA following post-hoc (comparisons Bonferroni’s multiple comparisons test).
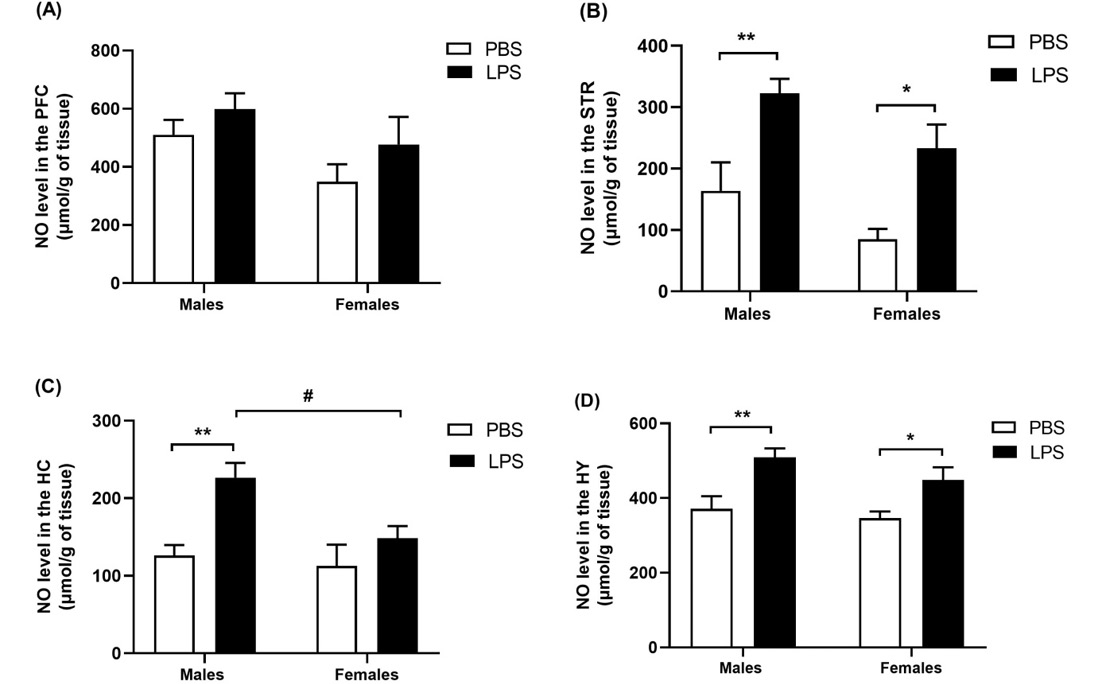
Concentrations of nitric oxide (NO) in different regions of male and female rat brain. A) NO level in the prefrontal cortex (PFC). B) NO level in the hippocampus (HC) .C) NO level in the striatum (STR). NO level in the hypothalamus (HY). The data are presented as means ± SEM. *p < 0.05 vs. PBS group; and #p < 0.05 vs. gender counterpart.


