
Impact of Destructive Fishing Practices on Fishermen Livelihoods in District Charsadda, Khyber Pakhtunkhwa Province of Pakistan


Research Article
Impact of Destructive Fishing Practices on Fishermen Livelihoods in District Charsadda, Khyber Pakhtunkhwa Province of Pakistan
Muhammad Qasim1*, Said Qasim2, Muhammad Naeem1, Amir Nawaz Khan3 and Shahid Iqbal4
1Department of Economics, University of Peshawar, Khyber Pakhtunkhwa, Pakistan; 2University of Balochistan, Quetta, Pakistan; 3Faculty of Life and Environmental Sciences, University of Peshawar, Khyber Pakhtunkhwa, Pakistan; 4Centre for Disaster Preparedness and Management, University of Peshawar, Khyber Pakhtunkhwa, Pakistan.
Abstract | This study attempted to find out the impact of destructive fishing practices on livelihoods of small-scale inland fishers for the years 2001 and 2016, in district Charsadda, Khyber Pakhtunkhwa, Pakistan. Three types of fishers were selected for the study i.e. farming fishers, fishing farmers and occasional fishers, through two stage cluster sampling. Livelihoods asset pentagons were used for the analysis. Considerable decline in physical and economic assets were noted among all the three types of fishers, whereas the total value of livelihood assets for farming fishers deteriorated from 0.40 in 2001 to 0.33 in 2016. The study recommends that concerned authorities should take initiative to create awareness regarding conservation of fishes and observe strict implementation of the fishery laws and regulations.
Received | March 26, 2019; Accepted | September 16, 2019; Published | November 12, 2019
*Correspondence | Muhammad Qasim, Ph. D Scholar Department of Economics, University of Peshawar, Pakistan; Email: mqasim78pk@gmail.com
Citation | Qasim, M., S. Qasim, M. Naeem, A.N. Khan and S. Iqbal. 2019. Impact of destructive fishing practices on fishermen livelihoods in district Charsadda, Khyber Pakhtunkhwa Province of Pakistan. Sarhad Journal of Agriculture, 35(4): 1155-1165.
DOI | http://dx.doi.org/10.17582/journal.sja/2019/35.4.1155.1165
Keywords | Inland fishing, Livelihood assets, Freshwater source, Destructive fishing practices, Charsadda, Khyber Pakhtunkhwa
Introduction
Small-scale inland fisheries are an important source of livelihoods for millions of poor people (Stanford et al., 2017), particularly in developing countries. The importance of the fisheries and aquaculture sector to the livelihoods of people living near coastal areas is well documented (APFIC, 2010; Whittingham et al., 2003; Bene et al., 2007; World Bank, 2004; World Bank, 2008), however less is known regarding inland fisheries (Bahadur et al., 2017). Some research studies have enumerated multiple ways in which fish and fishing contribute to the livelihoods of rural people living in inland areas of developing countries (Nasielski et al., 2016), but small scale inland fisheries are vulnerable to global and local stresses (Stanford et al., 2017). Inland fish represent a very important and accessible source of high quality cheap animal protein crucial to balance diets in marginally food secure communities (Akpaniteaku et al., 2005). Inland fishing is common in Pakistan, taking place in rivers, streams, lakes, ponds, dams, barrages and wetlands in almost all provinces and districts (GoP, 2013a). Pakistan ranks 18th in inland fisheries production in the world, producing some 120,240 tons of fish in 2012 and 123,155 tons in 2013 (FAO, 2015). The share of inland fisheries in total fish production in Pakistan has remained 21%, 30%, 23%, 30% in 1947, 1960, 1984, and 2009, respectively (GoP, 2013b). It is estimated that some 180,000 people in the country, with almost 20,000 small craft are involved in inland fisheries, mostly part-time, for their livelihoods (FAO, 2009; GoP, 2013a).
Charsadda district is the most fertile region of Khyber Pakhtunkhwa due to the presence of rivers, which has made it agrarian and almost 35% of all employed persons’ worked in agricultural and fishery sectors (GoP, 2001). The problem of decreasing fish stocks is often compounded for fisher’s dependent on fish productivity as both a source of food and income. The fishers are forced to adapt to or change fishing practices that can impact livelihoods.
This study investigates the impacts of adapting fishing practices on fisher assets in different cohorts in the region, with a focus on the impacts of Destructive Fishing Practices (DFPs). Specifically, the study compares changes in livelihood and household’s assets from 2001 to 2016. An understanding of changes in socioeconomic condition of fishers will help inform policy makers and line agencies to mitigate the impacts of decreased fish stocks.
Literature review
The theory of livelihood focuses on “how different people in different places live” (Scoones, 2009). It refers to the means of attaining a living, comprising livelihood capabilities, and tangible and intangible assets (Ferse et al., 2012; DFID, 1999; Scoones, 1998; Chambers and Conway, 1992). The assets are required “to cope with stresses and shocks, and to maintain and enhance capabilities now and in the future for long term well-being (DFID, 1999). In this context, maintaining a living requires assets and the fisher’s livelihoods depends on the assets they hold. The livelihood concept has been described through the sustainable livelihoods’ approach (SLA), which present livelihoods as a link between capabilities, fairness and sustainability (Chambers and Conway, 1992). These approaches try to promote sustainable development in a dynamic way that incorporates the many dimensions of human livelihoods. This concept was applied, adapted and criticized by numerous researchers. The three components of a sustainable livelihoods framework are sustainable assets, vulnerability context, and techniques and interventions (Murray and Ferguson, 2001). These components are explained and used by Allison and Ellis (2001) as a framework for micro policy analysis of rural livelihoods and they applied it to understand the strategies of artisanal fisher-folk faced with fluctuating fisheries resources. Smith et al. (2005) described how inland fishers’ livelihoods have been studied in a narrow and stereotyped way which he calls an old paradigm and he modified the livelihoods model presented by Allison and Ellis (2001) by combining the traditional livelihood model with the overall determinants of inland fisheries and developed a comprehensive characteristic of livelihood outcomes of inland fisheries. Weeratunge et al. (2014) and Voyer et al. (2017) applied the lens of social wellbeing concept and wellbeing respectively and discussed the social, economic and political dimensions of small scale fisher societies. However, these approaches only integrated well being and resilience into small-scale fisheries but didn’t provide practical tools for evaluation of fisher livelihoods. A more recent study by Stanford et al. (2017) combined the principle of SLA with the methodology of RAPFISH (a rapid assessment for sustainability of fisheries) to the FLIRES (fisheries livelihoods resilience check) approach, which is used as a widely applicable tool to evaluate resilience of fisher livelihoods and used six capital assets instead of the traditional five.
As compared to developed countries, livelihoods of many people in developing countries depend on primary activities including fishing. This study adds to the growing body of work on the importance of small-scale fisheries in rural livelihoods by investigating the relationship in a poorly studied but heavily populated developing region of the world.
Conceptual framework
Inland fisheries are extremely complex, and in many cases poorly understood (Welcomme et al., 2010). At present biodiversity of 65% of the world’s river habitats is endangered by human caused stressors (Sullivan et al., 2011). One threat to these systems is the use of DFPs, which fishers can be driven to use under desperation (Munyi, 2009). For example, a study conducted at the River Swat in district Charsadda, Khyber Pakhtunkhwa Province of Pakistan, reports six species as missing in comparison with past records (Yousafzai, 2013). Out of the total 200 fish species of the Indus River system, a total of 32 fish species are known to be endemic to Pakistan (GoP, 2013a). We have constructed a conceptual framework describing the interactions between the adaptive response of fishers, the use of DFPs, impacts on the biophysical fishery productivity and the resulting consequence on fisher livelihoods (Figure 1). DFPs have led to a decline in fish stock in rivers, which has a direct effect on fishermen livelihoods through decline in fishing income, changes in the household fish consumption patterns, increase in fishing efforts, which further intensify the destructive fishing practices. These direct effects have indirectly affected the overall livelihood assets (indirect effect) of fishermen, which result in reduced level of well-being and deterioration in livelihoods.
Materials and Methods
Study area
Charsadda District lies between 34ᴼ 3 ̷ to 34ᴼ28 ̷ North and 71ᴼ 28 ̷ to 71ᴼ 53 ̷ East (Figure 2). The total area of the district is 996 square kilometers. The climate of the district is extreme i.e. summer is extremely hot with an average daily low of 27°C to an average daily high of 38°C, and winter is cold with an average daily low of 5°C to an average daily high of 19°C. There are two rainy seasons in a year, winter rainfall in the months of March and April, and summer rainfall in the months of July and August. The major crops of the study area are wheat, barley, tobacco, vegetables, sugarcane, rice and maize. The Indus River with a total length of 2,750 km (GoP, 2013a) is the most important supply of surface water and is considered as the lifeblood of Pakistan. The major tributaries of the Indus in Khyber Pakhtunkhwa i.e., the Kabul, Swat (Khiali) and Jindi rivers enter Charsadda District. Villages where Fishers are concentrated were identified from Munda to the place where they enter the Kabul River at Nisatta. The common fishing practices include use of hooks, spears, cast and drag nets, spears, and rods.
Data collection
Both primary and secondary data were used for this study. A reconnaissance survey was carried out in the study area consisting of field visits to major rivers and streams, to get an overview of the fishing practices and livelihood activities. The reconnaissance survey revealed that DFPs have severely affected the fisheries resources and ultimately the livelihoods of the fishers. Interviews and group discussions with community leaders, elders, professional fishers, government officers and fishery monitors were also carried out.
Primary data were collected between March and December 2016 through in-depth interviews, Focus Group Discussions (FGDs) and household surveys. Firstly, in-depth interviews were conducted with key informants including village heads (khans), elders and government officials. Secondly, four FGDs were carried out to obtain key information on the socioeconomic characteristics, DFPs and institutional set up of fisher communities. Thirdly, a detailed questionnaire was used to collect data from the households. Secondary data regarding licensing, litigation processes, number of monitors, fisheries rules and regulations was obtained from the provincial fisheries and irrigation departments.
In-depth interviews are very useful in giving a human face to (Mack et al., 2005; Boyce et al., 2006) and achieving a holistic understanding (Berry, 1999) of research problems. In this study one on one in-depth interview with key informants were conducted, which shared their experiences and expectations of fisheries management and helped us explore the people’s perspective on DFPs, and the changes they perceived in the livelihoods of fishers. These in-depth interviews provided the direction for further research and helped in the selection of members and content of FGDs. The in-depth interviews revealed that DFPs have degraded the fish fauna and badly affected fisher livelihoods in the study area.
Focus group interviews are commonly used to develop hypotheses that are then verified by a survey of population or other kinds of research (Stewart et al., 1990; Reid et al., 1981). To authenticate the results of the in-depth interviews and get a deeper understanding of the topic, four FGDs were carried out to obtain information regarding destructive fishing gears, socioeconomic characteristics of fisher communities and fishery regulations. A single category design (Krueger and Casey, 2000) was used for professional fishers, village elders, fishery officials and monitors consisting of 10, 7, and 8 members respectively. However, for the fourth group a multiple category design (Krueger and Casey, 2000) was used with 10 mixed participants. Each group discussion lasted from 60 to 80 minutes until saturation was reached. During the focus group interviews questions were asked regarding fishing, use of DFPs, its effects on livelihoods, and other fisher characteristics.
Sampling techniques
Two stage cluster sampling was used to select a representative sample of households. Cluster sampling simply requires a list of elements in the clusters sampled (Anderson et al., 1996). In the first stage, fishing communities with distinct fishing characteristics i.e. location near water bodies, intensive fishing and presence of large number of fishers were selected. In the second stage, sample households were selected from those fishing communities. The survey was conducted with the household heads of each sample household. Targeted villages were taken from households living near the three rivers in the study area i.e. Swat, Kabul and Jindi. Fishing is carried out throughout the year but there are two main seasons when catches are abundant - Mid-February to April and July to October. The Mid-February to April season has a particularly abundant catch and is locally known as “mainchal” (fish breeding season). Thus, the seasonality is probably influenced by ecological and biological factors.
Sampling frame
Cluster sampling was used, because recent population data was not available. Furthermore, it is economical and suitable for selecting a sample when the sampling frame of individual elements is not available. According to the 1998 Census, the population of Charsadda district was 1,022,000 (GoP, 2001). To maximize validity of research, an extended sampling frame was developed to select a larger household sample for research. A representative household sample size was determined using the equation of Tryfos, (1996):
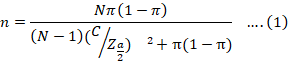
Where n is sample size, N is population size, n is ratio of a characteristic of interest in a population (e.g. literacy rate, fisher’s population, and mortality), C is ± error rate (confidence interval) and Z a/2 is a tabulated value for confidence level. The proportion of 0.5 gives the maximum variance, 0.5*(1-0.5) = 0.25, error rate (confidence interval) of ±8% and 1.96 tabulated value of Za/2 for 95% confidence level and number of households of the above-mentioned villages, sample sizes for each village were estimated. The formula gave a sample size of 277 with error acceptance (d) value of 6%. However, a sample size of 280 respondents was chosen for convenience of calculations.
Inland capture fisheries are classified as commercial, recreational, and subsistence (Grantham and Rudd, 2015). Using the above classification and to set up a representative sample, households were divided into three categories i.e. farming fishers, fishing farmers and occasional fishers. Farming fishers includes households whose primary occupation is agriculture but also catch fish to diversify their income. Farming fishers have access to farm land but get less income from farming than fishing farmers. This category of households is the least destructive in the study area. Fishing farmers are poorer households getting almost equal income from both fishing and farming. Households in this category are more destructive than farming fishers but less destructive than occasional fishers. Occasional fishers are the major threat to the fish fauna in the study area. They occasionally go fishing and use chemicals, blasting material (locally known as khateen) and electric gear. This category of households mostly includes government officials, businessmen, village khans (landlords), and police or military workers, who have not only access to these destructive methods but can use them anywhere due to their contacts. The fisher income was calculated on an annual basis, excluding personal consumption and was calculated as total average catch multiplied by average market price. Farming fishers, fishing farmers and occasional fishers account for 30%, 30% and 40% respectively of all fishing households selected for this study (Table1).
Justification and measurement of indicators
The term livelihood includes those capabilities, assets and activities required for a means of living (DFID, 2007; Serrat, 2008; Chambers and Conway, 1992). The building blocks of livelihoods are assets including social, human, physical, natural, and economic that helps to reduce vulnerability of the communities to shocks. To understand the significant changes in the livelihoods of the people residing near water bodies, two sets of data were collected regarding livelihood capitals i.e. one for the year 2001 and another for 2016.
Indicators and variables have been widely used to assess livelihood assets (Chen et al., 2013; Chambers and Conway, 1992). The indicator design was adopted from Chen et al. (2013) with slight modification and using different scaling and indexing to make them comparable. In this study, we selected 19 variables to represent the five livelihood assets. The major reasons for the selection of these variables for each type of livelihood capital depended on the state of livelihood conditions, fishing regulations and intensity of DFPs in inland waters by the fishing communities under consideration. The indices derived from the variables in this study were between 0 to 1, higher
Table 1: Population size and statistical sample.
|
Rivers |
Village Name |
Population |
Number of Households |
Household types |
|||
|
Selected Sample |
Farming Fishers 30% |
Fishing Farmers 30% |
Occasional Fishers 40% |
||||
|
Khiale |
Abazai |
2,978 |
190 |
85 |
26 |
25 |
34 |
|
Dawlat Pura |
343 |
43 |
34 |
11 |
10 |
13 |
|
|
Jangal |
131 |
16 |
15 |
5 |
4 |
6 |
|
|
Chitli Tapo |
32 |
4 |
04 |
1 |
1 |
2 |
|
|
Sardaryab |
Dogar |
373 |
47 |
36 |
11 |
10 |
15 |
|
Doaba |
356 |
45 |
35 |
10 |
10 |
15 |
|
|
Jala Bela |
67 |
8 |
08 |
2 |
3 |
3 |
|
|
Jindi |
Shahbara |
495 |
62 |
44 |
13 |
14 |
17 |
|
Majoke |
238 |
30 |
25 |
7 |
8 |
10 |
|
|
Total |
5,013 |
445 |
286 |
86 |
85 |
115 |
|
Table 2: Total value of livelihood assets from 2001 to 2016 for the three kinds of fishers.
|
Capital assets and their Indicators |
Farming fishers |
Fishing farmers |
Occasional fishers |
|||
|
Indicator weights |
||||||
|
2001 |
2016 |
2001 |
2016 |
2001 |
2016 |
|
|
Capital value of Economic Assets |
0.53 |
0.35 |
0.39 |
0.34 |
0.48 |
0.44 |
|
Fishing income |
0.53 |
0.45 |
0.47 |
0.45 |
0.49 |
0.54 |
|
Savings from fishing income |
0.49 |
0.40 |
0.40 |
0.36 |
0.47 |
0.41 |
|
Access to credits |
0.58 |
0.20 |
0.29 |
0.21 |
0.47 |
0.36 |
|
Capital value of Physical Assets |
0.38 |
0.28 |
0.32 |
0.29 |
0.55 |
0.54 |
|
House ownership |
0.69 |
0.32 |
0.23 |
0.19 |
0.33 |
0.27 |
|
Energy Supply |
0.23 |
0.25 |
0.29 |
0.34 |
0.65 |
0.75 |
|
Transport facility |
0.17 |
0.18 |
0.21 |
0.30 |
0.54 |
0.58 |
|
Fishing tools ownership |
0.43 |
0.37 |
0.54 |
0.33 |
0.67 |
0.56 |
|
Capital value of Natural Assets |
0.23 |
0.27 |
0.22 |
0.31 |
0.16 |
0.34 |
|
Licensing |
0.07 |
0.36 |
0.10 |
0.35 |
0.09 |
0.52 |
|
Watchers |
0.08 |
0.31 |
0.13 |
0.37 |
0.05 |
0.40 |
|
Litigation |
0.06 |
0.21 |
0.07 |
0.24 |
0.04 |
0.29 |
|
Fish size and amount |
0.69 |
0.21 |
0.56 |
0.27 |
0.46 |
0.15 |
|
Capital value of Social Assets |
0.50 |
0.35 |
0.50 |
0.48 |
0.41 |
0.39 |
|
Union Council membership |
0.40 |
0.63 |
0.70 |
0.77 |
0.45 |
0.62 |
|
Membership in political parties |
0.37 |
0.22 |
0.41 |
0.53 |
0.19 |
0.33 |
|
Networking with law enforcement agencies |
0.60 |
0.23 |
0.24 |
0.13 |
0.41 |
0.26 |
|
Contacts with village elders |
0.50 |
0.30 |
0.57 |
0.65 |
0.41 |
0.48 |
|
Networking with other households |
0.58 |
0.26 |
0.49 |
0.30 |
0.29 |
0.15 |
|
Kinship support |
0.57 |
0.51 |
0.57 |
0.49 |
0.69 |
0.52 |
|
Capital value of Human Assets |
0.38 |
0.38 |
0.40 |
0.47 |
0.62 |
0.74 |
|
Education |
0.25 |
0.39 |
0.36 |
0.46 |
0.60 |
0.71 |
|
Skill |
0.51 |
0.37 |
0.43 |
0.48 |
0.63 |
0.76 |
|
Total value of livelihood Assets |
0.40 |
0.33 |
0.36 |
0.38 |
0.44 |
0.49 |
values showing better livelihood assets. These indices were then depicted in the livelihood asset pentagon, which is a component of the sustainable livelihood framework (Shivakoti, and Shrestha, 2005).
Human capital relates to qualities, traits or situations that can improve or reduce the capacity of fishers and respondents in general to carry out their fishing activities. Human capital was represented by two variables i.e. education and skill. Education was considered as a variable of human capital because literate people are more aware about the disastrous impacts of DFPs (Verbeke et al., 2005; Babulo et al., 2008; Cinner, 2009). Skill is an important determinant because fishing needs knowledge of open waters and skills that many individuals might believe would exclude them from entering the sector (Chen et al., 2013; Peñalb and Elazegui, 2011; Babulo et al., 2008; Allison and Ellis, 2001). It is believed that fishers who conduct fishing as an occupation are more skillful than occasional fishers. Therefore, occupation is used as a measure of skill. Education was measured as percentage of literate and skill as percentage of skilled fishers. Then the percent values of education and skill were combined and divided by two to obtain the index of human capital.
The economic assets were measured as indices of income earned through selling fish, savings from fishing income and access to credits (Babulo et al., 2008). The word regular inflow of money from fishing is used in this study to exclude income from other sources, as some of the respondents were also related to farming occupations, part-time or seasonal fishers. The first two variables are continuous, so their mean value was used in determining the index of economic assets. A livelihood index ranging from 0–0.33 is interpreted as poor; the one with 0.34–0.66 as average and 0.67–1 as good. Three critical values: 0.33, 0.66 and 1 were selected to replace poor, average and good, respectively to facilitate calculations (Muangkaew and Shivakoti, 2005; Chen et al., 2013). The rating scale method with varying weights was used to determine these variables. Weighting of less than the “Mean” is considered “Poor”, (a weight of 0.33); greater than the “Mean” but less than 1.5 × mean” is considered “Average”, with a weight of 0.66; and greater than “1.5 × Mean” is considered “Good”, with a weight value of “1” (Chen et al., 2013). The index was calculated as;
Index of income or savings = (Mean) % × 0.33 + (Mean < Average < 1.5 × Mean) % × 0.66 + (> 1.5 × Mean) % × 1 …. (2)
To find out the index of credit, the percentage of households who had access to credit was determined. Then all three values (income, savings and credit) were added and divided by three to obtain the index of economic assets.
Access to natural resources e.g. land, forest, and water is considered as a natural asset (DFID, 2007; Babulo et al., 2008). Full access to a capital asset assume the value of 1 and no access assume the value of 0 (Shivakoti and Shrestha, 2005). Therefore, anything that restricts one’s access to the natural resource is depriving one from the use of that resource. Access to assets is enabled or hindered by the policy and institutional context of livelihoods (Allison and Ellis, 2001). Therefore, in this paper, the variables of natural assets are derived mostly from conservation efforts by the government i.e. licensing, number of monitors, litigation processes and fish size and quantity. The respondents were asked whether licensing, number of monitors and litigation has reduced their access to the water bodies or not? The response was coded as yes=0, no=1, because these factors negatively affect the amount of natural capital for the fishers. Secondly, results of the FGDs and interviews with the key informants reveal that fish populations and size have been considerably reduced over the past 15 years. So, the variable fish size and quantity was included within the natural assets, because this also affects access to the natural resource. To find out the index of natural capital, the percentage of households with the yes statement is determined. Then all four values (licensing, number of monitors, litigation process and fish size and amount) were added and divided by four to obtain the index of natural assets.
The index of physical assets was represented by four indicators - house ownership, energy supply, transport facilities and ownership of fishing gears (Babulo et al., 2008). Both transport and fishing gear ownership increase capacity to catch and earn high levels of income. The indexes of all these four indicators were measured by the same way as for access to credit natural capital.
Social capital includes social networks and membership (Babulo et al., 2008). Six variables were used to calculate the index of social capital. These include membership in union councils, membership in political parties, networking with law enforcement agencies, contacts with village elders, networking with other households and kinship support. The responses to these variables were in the form of yes or no; therefore, the same procedure was followed. After calculations of the relevant indices for the concerned variables, a composite measurement index for each type of asset was calculated using Equation 2 as;
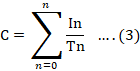
Where C= criteria score for each asset (0 ≤ C ≤ 1), n refers to the nth indictor of a criterion (n = 1, 2, . . . n); I refer to the indicator; and T refers to the total number of indicators. Whereas, the total of livelihood assets for each period is calculated as; LAs = (HA+EA+NA+PA+SA)/5, where LAs refer to livelihood assets; HA refers to human assets; EA economic assets; NA natural assets; PA physical assets; and SA social assets.
Results and Discussion
Results of focused group discussions
The focus group interviews revealed that occasional fishers mostly adopt destructive fishing methods due to lack of awareness of natural resources and reduced fish population in rivers. Most people particularly influential people don’t hold licenses due to lack of proper implementation of fishery regulations. Similarly, the use of DFPs is believed to be the underlying driver in reduced levels of income and fish consumption for fishers. Total 89% of respondents compared their present catch with the past and concluded that fish size and amount has considerably reduced in the local rivers. However, 75% of them responded that the open access nature of fishery and the use of electric generators are the major driving factors leading to reduced fishing stock in rivers. Almost 80 percent of respondents replied that DFPs can be reduced through implementation of fishery rules, increase in the number of fishery monitors and community participation.
Changes in fishers’ livelihood assets from 2001 to 2016
Changes in livelihood assets from 2001 to 2016 are shown in Table 2 and Figure 3 for farming fishers, fishing farmers and occasional fishers. Changes in livelihood assets vary across different types of households and are discussed below.
Farming fishers: The total value of livelihood assets is 0.40 in 2001 and 0.33 in 2016 (Table 2) for farming fishers. This deterioration in livelihood conditions is the product of the combined impact of all types of livelihood assets. However, variations in different kinds of asset show varying results and characteristics. The value of economic capital in 2001 is 0.53, and it dropped to 0.35 in 2016. Although there is a decrease of 18%, both values still lie within the range 0.33-0.66, which shows that in the past 15 years, the economic assets have declined. The value of physical capital in 2001 is 0.38, and it fell to 0.28 in 2010, a decrease of 10%, dropping this value from average to poor. The value of natural assets is 0.23 in 2001 and increased to 0.27 in 2016. The value in both 2001 and 2016 belong to the interval 0–0.33, which shows that conservation efforts have improved. The value of social capital in 2001 was 0.50 but fell to 0.35 in 2016. The value of human capital for farming fishers has remained the same from 2001 to 2016 (0.38), which belong to average range. These changes in livelihoods are depicted in the livelihoods asset pentagon (Figure 3), showing declines in economic, physical and social assets and an improvement in natural assets.
Fishing farmers: For fishing farmers, the total value of livelihood assets was 0.36 in 2001 and 0.38 in 2016, showing a 2% increase. A small decrease in economic, physical and social assets was witnessed during 2001 to 2016 (Table 2). However, human assets have gained 7% during the period and natural assets (conservation) have improved by 9%. These changes in livelihoods are depicted in the livelihoods asset pentagon (Figure 3), showing declines in economic and physical assets and a small improvement in social and human assets. The natural assets have improved from 0.22 to 0.31.
Occasional fishers: The total value of livelihood assets for occasional fishers was 0.44 in 2001 and increased to 0.49 in 2016 (Table 2). Although there is an increase of 5%, both values lie in the average range. The major contributors to this increase are natural (18%) and human assets (12%). Economic, social and physical assets decreased by 4%, 2% and 1% points respectively. These changes in livelihoods are depicted in the livelihoods asset pentagon (Figure 3), showing declines in economic, physical and social assets and an improvement in natural and human assets.
The paper has attempted to show the impact of DFPs on fishermen livelihoods and has made a number of important observations in this regard. The livelihood assets of farming fishers have been deteriorated from total index value of 0.40 to 0.33, due to the reason that they have access to land but getting less income from farming than fishing, which is an evidence of reduced amount of fish and fishing activity in the rivers by these fishers. The overall livelihood assets of fishing farmers have improved from 0.36 to 0.38 with human and natural assets as contributor to this increase and deterioration in the rest of the capitals, indicating the hardships fishers face due to decline in economic, physical and social assets. Considerable deterioration in physical assets among all the three types reveals that these fishers have lost, destroyed or discarded some of their fishing gears due to reduced fishing activity. Savings from fishing income and fishing tools ownership has reduced among all the three groups. The increase of fishing income only among occasional fishers reveals the fact that they catch more due to the use of DFPs. Natural assets here refer to fishers’ livelihoods, i.e. access to natural assets improves livelihoods but on the other hand overexploitation of the natural assets causes deterioration of the natural environment. In this paper it is assumed that anything that restricts fisher’s access to water bodies will negatively affect their livelihoods and improve conservation efforts. The conservation efforts show improvement in number of licensing, fisheries monitors and litigation cases but have negative effect on the livelihoods of fishermen.
There are many causes of fisheries degradation not covered in the present paper and research gap exists in this regard. These include competition and conflicts over natural resources, construction of settlements besides major rivers, social and cultural perceptions regarding water and its components as an open access, new fishing methods and technology, taste of fish caught, ineffective rules or incapacity to monitor rules and regulations, intensity of fishing effort, energy and time efficiency, existence of group relationship patterns between fishermen and the law enforcement agencies and destructive fishing materials sellers and fish as the main source of food etc. Similarly, there are many other processes that may have impact on fishermen livelihood assets, not covered under the present research. For example, alternative livelihood opportunities, access to land and economic and political marginalization etc.
Conclusions and Recommendations
This study provides insights into fisher livelihoods through livelihood assets pentagons. Analysis of the livelihood assets revealed that in all three types of household, only natural assets have shown some improvement from 2001 to 2016. The improvement in natural assets in this context shows that recent conservation efforts by the fisheries department in terms of licensing, monitors, and litigation processes may have reduced the disastrous impacts of DFPs. However, its tremendous use in the past has resulted in reduced fishing activity and livelihood assets for fishers. Monitors are hired on a temporary basis and check only seasonal fishing activities. Although cyanide and chemicals are banned they are still available at many locations in the study area. The study showed that influential people, called occasional fishers in this study, still used DFPs due to their positions and contacts with the law enforcement agencies.
Immediate actions must be taken to improve fisher livelihoods as well as to conserve local fishery resources from DFPs. In this regard, the government and line departments should strengthen local institutions and raise awareness of the local people. Awareness should be created through local radio and television networks regarding the negative impacts of DFPs, and local residents and community elders should be encouraged to discourage DFPs. The number of monitors should be increased and their employment be made permanent. The use of cyanide and chemicals should be strictly banned, and those violating should be punished. Alternative livelihood opportunities should be created for fishers in order to lessen the burden on freshwater fisheries resources. Fishers would be encouraged to start new small scale businesses like aquaculture and agro-based industries, and provisions made for necessary training and finances on easy installments by the local government.
Novelty Statement
This paper addresses one of the comtemporary agricultural economic issues, especially in Pakistani contect, where food security is an emerging challenge. This research is likely to contribute towards sustainability of food in Pakistan.
Author’s Contribution
Muhammad Qasim: Principal author, worked on all aspects of the manuscript including; topic selection, data collection, literature review, theoretical framework, analysis and the review process.
Said Qasim: Provided help in topic selection and data analysis.
Muhammad Naeem: He was PhD research supervisor of the corresponding author who helped in the revisions and approved the final draft of the manuscript.
Amir Nawaz Khan: Helped in editing, proofreading and review of the manuscript.
Shahid Iqbal: Helped in data collection, interview with respondents and focus group discussions.
References
Akpaniteaku, R.C., M. Weimin and Y. Xinhua. 2005. Evaluation of the contribution of fisheries and aquaculture to food security in developing countries. Naga, World Fish Cent. Q. 28(1-2): 28-32.
Allison, E.H. and F. Ellis. 2001. The livelihoods approach and management of small-scale fisheries. Mar. Policy. 25(5): 377-388. https://doi.org/10.1016/S0308-597X(01)00023-9
Anderson, D.R., D.J. Sweeney and T.A. Williams. 1996. Statistics for business and economics, west publishing company: St. Paul, M.N.
APFIC. 2010. Best practices to support and improve livelihoods of small-scale fisheries and aquaculture households. FAO regional office for Asia and the pacific, Bangkok, Thailand. RAP Publ. 2010/21, pp. 140.
Babulo, B., B. Muys, F. Nega, E. Tollens, J. Nyssen, J. Deckers and E. Mathijs. 2008. Household livelihood strategies and forest dependence in the highlands of Tigray, Northern Ethiopia. Agric. Syst. 98(2): 147-155. https://doi.org/10.1016/j.agsy.2008.06.001
Bahadur, K.C.K., N. Bond, E.D.G. Fraser, V. Elliott, T. Farrell, K. McCann and C. Bieg. 2017. Exploring tropical fisheries through fishers’ perceptions: Fishing down the food web in the Tonlé Sap, Cambodia. Fish. Manage. Ecol. 24(6): 452-459. https://doi.org/10.1111/fme.12246
Bene, C., G. Macfadyen and E.H. Allison. 2007. Increasing the contribution of small-scale fisheries to poverty alleviation and food security. FAO Fish. Tech. Pap. No. 481. Rome, FAO. 2007. pp.125.
Berry, R.S. 1999. Collecting data by in-depth interviewing. Br. Educ. Res. Assoc. Ann. Conf. Univ. Sussex Brighton.
Boyce, C. and P. Neale. 2006. Conducting in-depth interviews: A guide for designing and conducting in-depth interviews for evaluation input.
Chambers, R. and G. Conway. 1992. Sustainable rural livelihoods: practical concepts for the 21st century. Inst. Dev. Stud. (UK).
Chen, H., T. Zhu, M. Krott, J.F. Calvo, S.P. Ganesh and I. Makoto. 2013. Measurement and evaluation of livelihood assets in sustainable forest commons governance. Land use Policy. 30(1): 908-914. https://doi.org/10.1016/j.landusepol.2012.06.009
Cinner, J.E. 2009. Poverty and the use of destructive fishing gear near east African marine protected areas. Environ. Conserv. 36(4): 321-326. https://doi.org/10.1017/S0376892910000123
DFID, U. 2007. Sustainable livelihoods guidance sheets. UK DFID Dep. Int. Dev. London.
DFID, U.K. 1999. Sustainable livelihoods guidance sheets. London: DFID, 445.
Dudgeon, D. 2014. Threats to freshwater biodiversity in a changing world. In Glob. Environ. Change. pp. 243-253). Springer, Dordrecht. https://doi.org/10.1007/978-94-007-5784-4_108
FAO. 2009. Fishery and aquaculture country profile, Pakistan, country profile fact sheets. Bibliographic Citation [online]. Rome. Updated 1 February 2009. [Cited 29 January 2016]. http://www.fao.org/fishery/
FAO. 2015. FAO global capture production database updated to 2013 – Summary information.
Ferse, S.C., L. Knittweis, G. Krause, A. Maddusila and M. Glaser. 2012. Livelihoods of ornamental coral fishermen in South Sulawesi/Indonesia: implications for management. Coast. Manage. 40(5): 525-555. https://doi.org/10.1080/08920753.2012.694801
GoP. 2001. Population census organization, statistics division, Islamabad, pp. 10-39.
GoP. 2013a. Zoological survey of Pakistan, Ministry of climatic change, Islamabad, pp. 50-57.
GoP. 2013b. The environment and climatic change outlook of Pakistan, 2013, Minist. Clim. Change, Islamabad, pp. 85-87.
Grantham, R.W. and M.A. Rudd. 2015. Current status and future needs of economics research of inland fisheries. Fish. Manage. Ecol. 22(6): 458-471. https://doi.org/10.1111/fme.12144
Krueger, R.A. and M.A. Casey. 2000. Focus groups: A practical guide for applied research, 3rd ed. Thousand Oaks, CA: Sage Publ.
Mack, N., C. Woodsong, K.M. MacQueen, G. Guest and E. Namey. 2005. Qualitative research methods: a data collector’s field guide.
Muangkaew, T. and P.G. Shivakoti. 2005. Effect of livelihood assets on rice productivity: a case study of rice-based farming in southern Thailand. J. Int. Soc. Southeast Asian Agric. Sci. 11: 63-83.
Munyi, Fridah. 2009. The social and economic dimensions of destructive fishing activities in the south coast of Kenya, western Indian Ocean Mar. Sci. Assoc. Rep. No: WIOMSA/MARG-I/2009 –01.
Murray, J. and M. Ferguson. 2001. Women in transition out of poverty: An asset based approach to building sustainable livelihoods. Women Econ. Dev. Consortium. Retrieved from: http://www. cdnwomen. org.
Nasielski, J., K.C.K. Bahadur, G. Johnstone and E. Baran. 2016. When is a fisher (not) a fisher? Factors that influence the decision to report fishing as an occupation in rural Cambodia. Fish. Manage. Ecol. 23(6); 478-488. https://doi.org/10.1111/fme.12187
Peñalba, L.M. and D. D. Elazegui. 2011. Adaptive capacity of households, community organiza-tions and institutions for extreme climate events in the Philippines. Eepsea, Idrc Regional Office for Southeast and East Asia, Singapore, SG.
Reid, L.N., L.C. Soley and R.D. Winner. 1981. Replication in advertising research: 1977, 1978, 1979. J. Advert. 10(1): 3-13. https://doi.org/10.1080/00913367.1981.10672750
Revenga, C., J. Brunner, N. Henninger, K. Kassem and R. Payne. 2000. Freshwater Systems. Washington, DC: World Resour. Inst.
I. 1998. Sustainable rural livelihoods: a framework for analysis. In IDS working paper, Vol. 72, Brighton: IDS.
Scoones, I. 2009. Livelihoods perspectives and rural development. J. Peasant Stud. 36(1): 171-196. https://doi.org/10.1080/03066150902820503
Serrat, O. 2008. The sustainable livelihoods approach. Asian Dev. Bank. Knowl. Solut. 15: 1-4.
Shivakoti, G. and S. Shrestha. 2005. Analysis of livelihood asset pentagon to assess the performance of irrigation systems: part 1—Analytical framework. Water Int. 30(3): 356-362. https://doi.org/10.1080/02508060508691876
Smith, L.E., S.N. Khoa and K. Lorenzen. 2005. Livelihood functions of inland fisheries: policy implications in developing countries. Water Policy. 7(4): 359-383. https://doi.org/10.2166/wp.2005.0023
Stanford, R.J., B. Wiryawan, D.G. Bengen, R. Febriamansyah and J. Haluan. 2017. The fisheries livelihoods resilience check (FLIRES check): A tool for evaluating resilience in fisher communities. Fish and Fisheries. https://doi.org/10.1111/faf.12220
Stewart, D.W., P.N. Shamdasani and D.W. Rook. 1990. Analysing focus group data. Focus groups: Theory and practice, 102-121.
Sullivan, C.A., D. Dudgeon, S.E. Bunn, P.M. Davies, M.O. Gessner, S. Glidden and C.J. Vorosmarty. 2011. Saving the world’s rivers: what must be done? World Rivers Rev. 26(4): 1.
Tryfos, P. 1996. Sampling methods for applied research: text and cases (No. QA276. 6 T87).
Verbeke, W., I. Sioen, Z. Pieniak, J. Van Camp and S. De Henauw. 2005. Consumer perception versus scientific evidence about health benefits and safety risks from fish consumption. Public Health Nutr. 8(04): 422-429. https://doi.org/10.1079/PHN2004697
Vörösmarty, C.J., P.B. McIntyre, M.O. Gessner, D. Dudgeon, A. Prusevich, P. Green, S. Glidden, S.E. Bunn, C.A. Sullivan, C. Reidy Liermann and P.M. Davies. 2010. Global threats to human water security and river biodiversity. Nature 467: 553–561. https://doi.org/10.1038/nature09440
Voyer, M., K. Barclay, A. McIlgorm and N. Mazur. 2017. Connections or conflict? A social and economic analysis of the interconnections between the professional fishing industry, recreational fishing and marine tourism in coastal communities in NSW, Australia. Mar. Policy. 76: 114-121. https://doi.org/10.1016/j.marpol.2016.11.029
Weeratunge, N., C. Béné, R. Siriwardane, A. Charles, D. Johnson, E.H. Allison and M.C. Badjeck. 2014. Small-scale fisheries through the wellbeing lens. Fish and Fisheries, 15(2): 255-279. https://doi.org/10.1111/faf.12016
Welcomme, R.L., I.G. Cowx, D. Coates, C. Béné, S. Funge-Smith, A. Halls and K. Lorenzen. 2010. Inland capture fisheries. Philos. Trans. R. Soc. B. Biol. Sci. 365(1554): 2881-2896. https://doi.org/10.1098/rstb.2010.0168
Whittingham, E., J. Campbell and P. Townsley. 2003. Poverty and Reefs. DFID-IMM-IOC/UNESCO, pp. 260.
World Bank and FAO. 2008. The sunken billions. The economic justification for fisheries reform. Agric. Rural Dev. Dep. The World Bank. Washington, D.C.
World Bank. 2004. Saving fish and fishers: Toward sustainable and equitable governance of the global fishing sector. Int. Bank Reconstr. Dev. The World Bank, Washington, D.C.
Yousafzai, A.M., W. Khan and Z. Hasan. 2013. Fresh records on water quality and ichthyodiversity of River Swat at Charsadda, Khyber Pakhtunkhwa. Pak. J. Zool. 45(6): 1727-1734.
To share on other social networks, click on any share button. What are these?


