

Identification of Glycolysis-Related Gene Signature and Prediction on Prognosis of Colon Cancer


Identification of Glycolysis-Related Gene Signature and Prediction on Prognosis of Colon Cancer
Qingsen Ran1,2, Manjing Li3, Jiayin Han3, Lifang Wang3, Han Wang3,4, Shaobo Liu5* and Yanping Wang1*
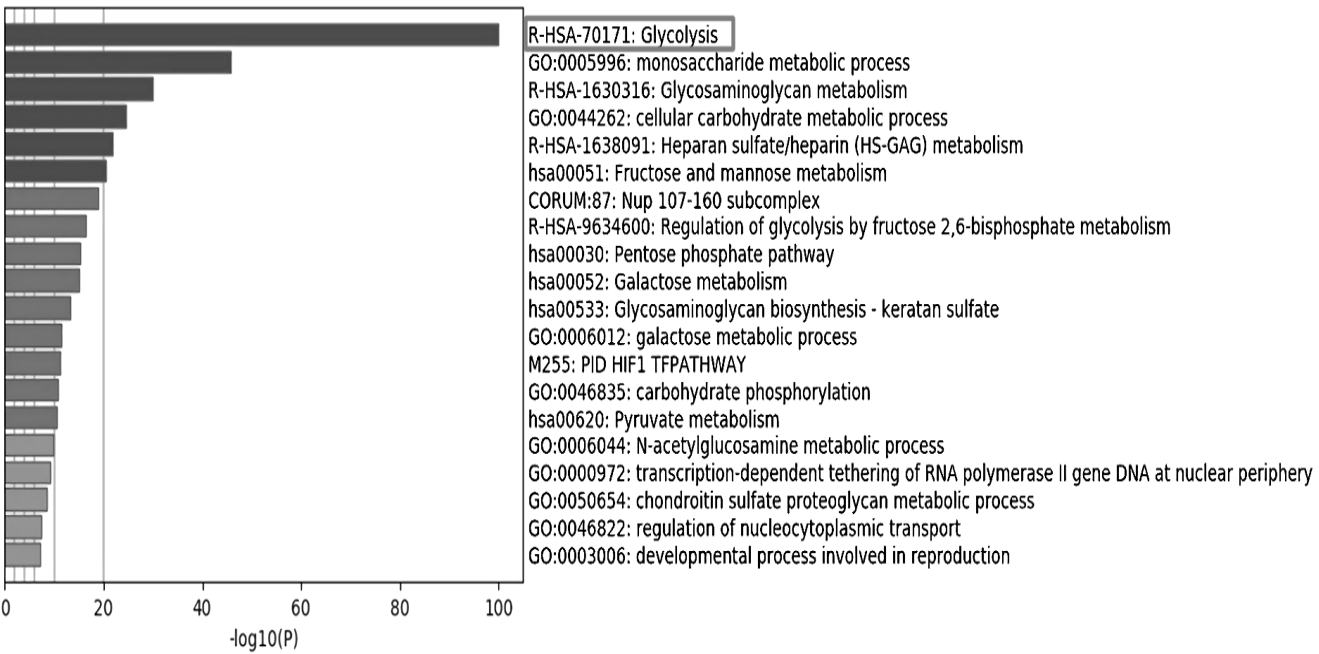
Fig. 1.
GO and KEGG pathway enrichment analysis of significant glycolysis genes based on Metascape.
Note: the significance increased from bottom to top; marked in box indicated the most significant metabolic pathway.

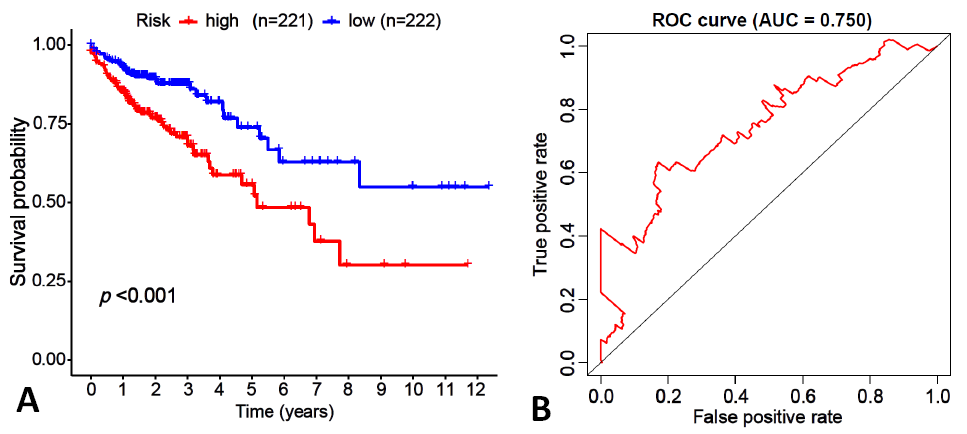
Fig. 2.
Survival curve analysis (A) and receiver operating characteristic (ROC) curve analysis (B) of glycolysis prognosis model with colon cancer patients.
Notes: A: red indicates high-risk patients (n= 221) and blue indicates low-risk patients (n= 222), and with a significant difference in survival rate (p <0.001). B: ROC curve analysis result was 0.750.

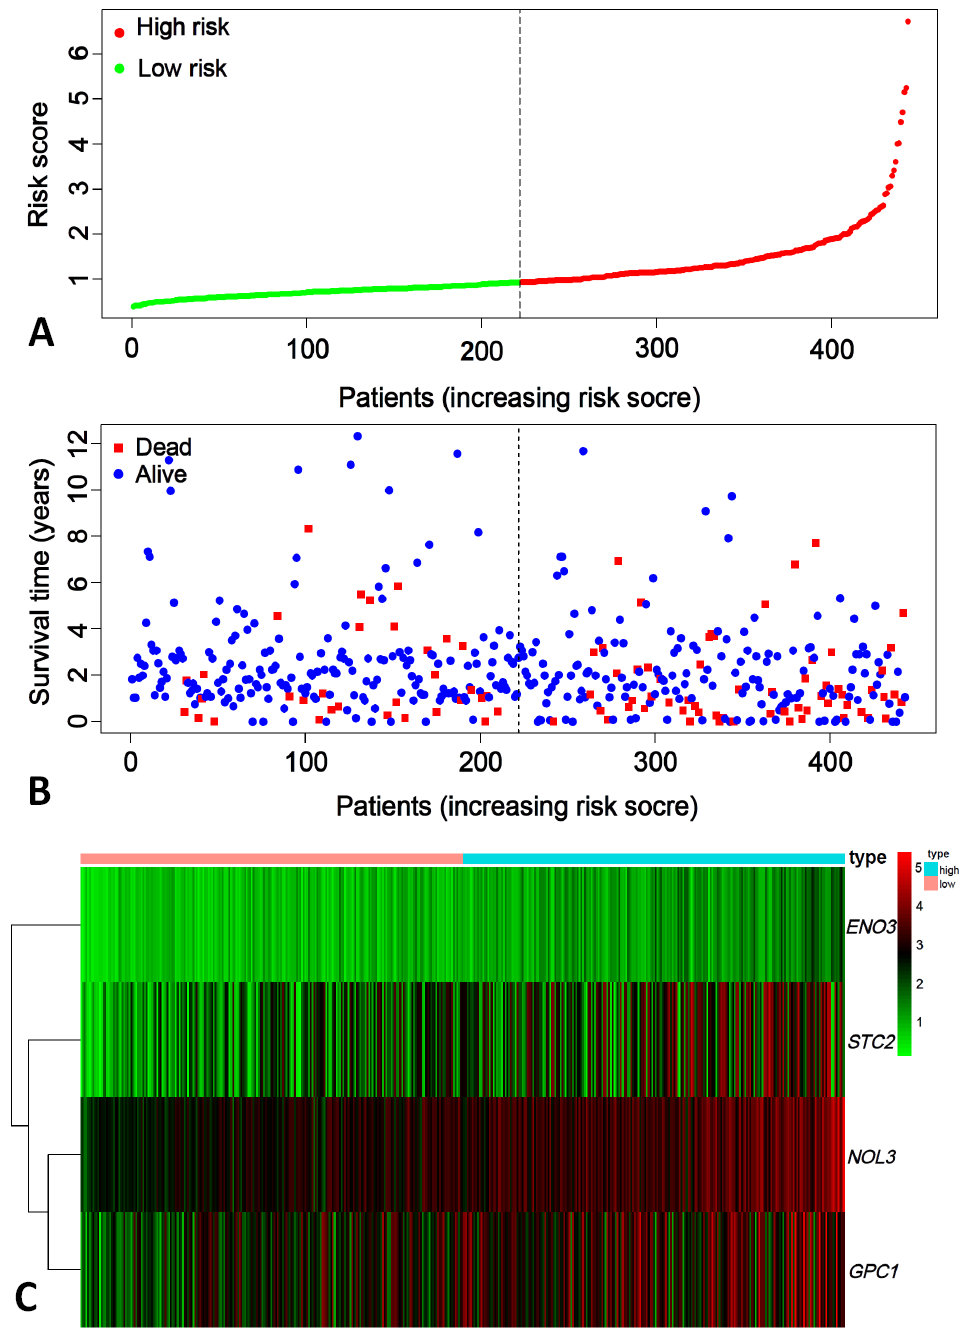
Fig. 3.
Risk map for glycolysis prognosis model in colon cancer patients.
A: risk score. B: the survival number of low risk score patients was significantly more than that of high risk score patients. C: heat map analysis. ENO3, GPC1, NOL3, STC2 genes expression in patients with high risk scores were significantly more than those with low risk scores.

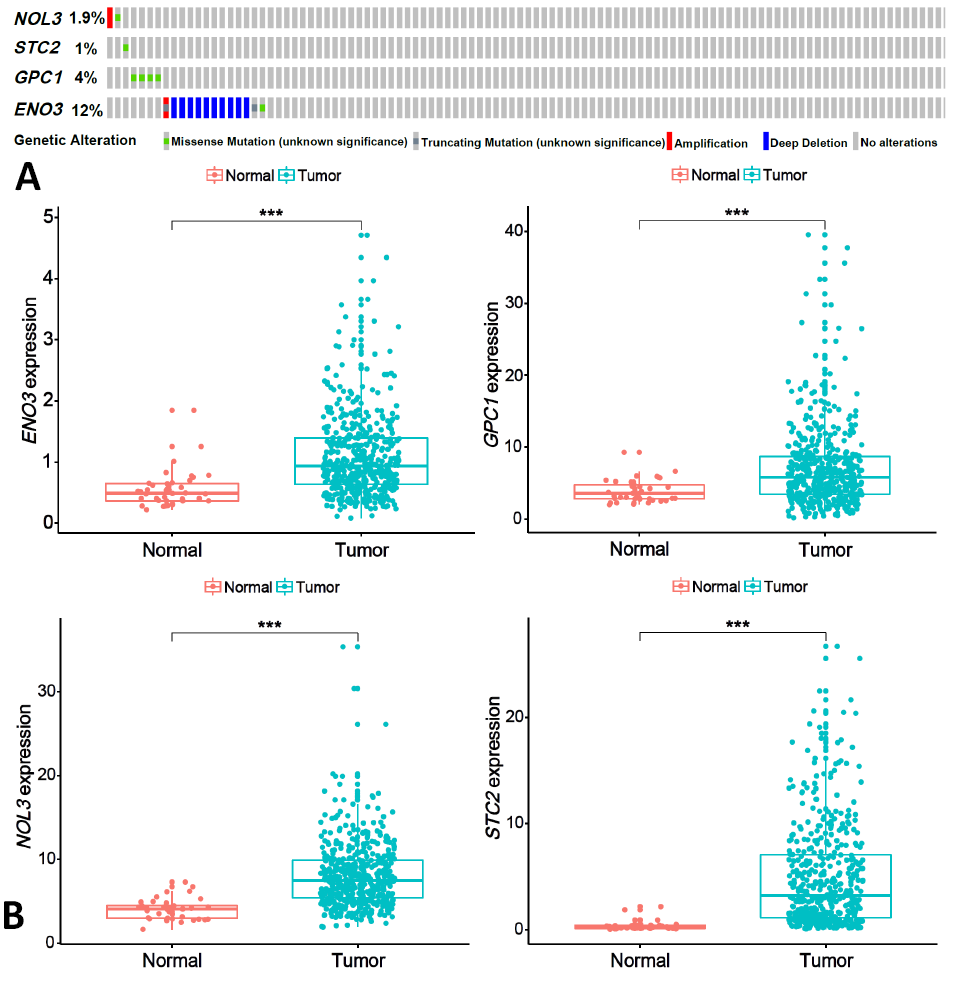
Fig. 4.
Gene mutation analysis (A) and difference analysis (B) for model samples from TCGA.
Notes: A: 105 patients samples in cBioPortal online database; NOL3: gene amplification, 1 case; missense mutation, 1 case; STC2: missense mutation, 1 case; GPC1: missense mutation, 4 cases; ENO3: deep deletion, 10 cases; truncation mutation, 1 case; missense mutation, 1 case. B: Red color: normal samples; green color: tumor samples; ***: significant difference at p <0.001.
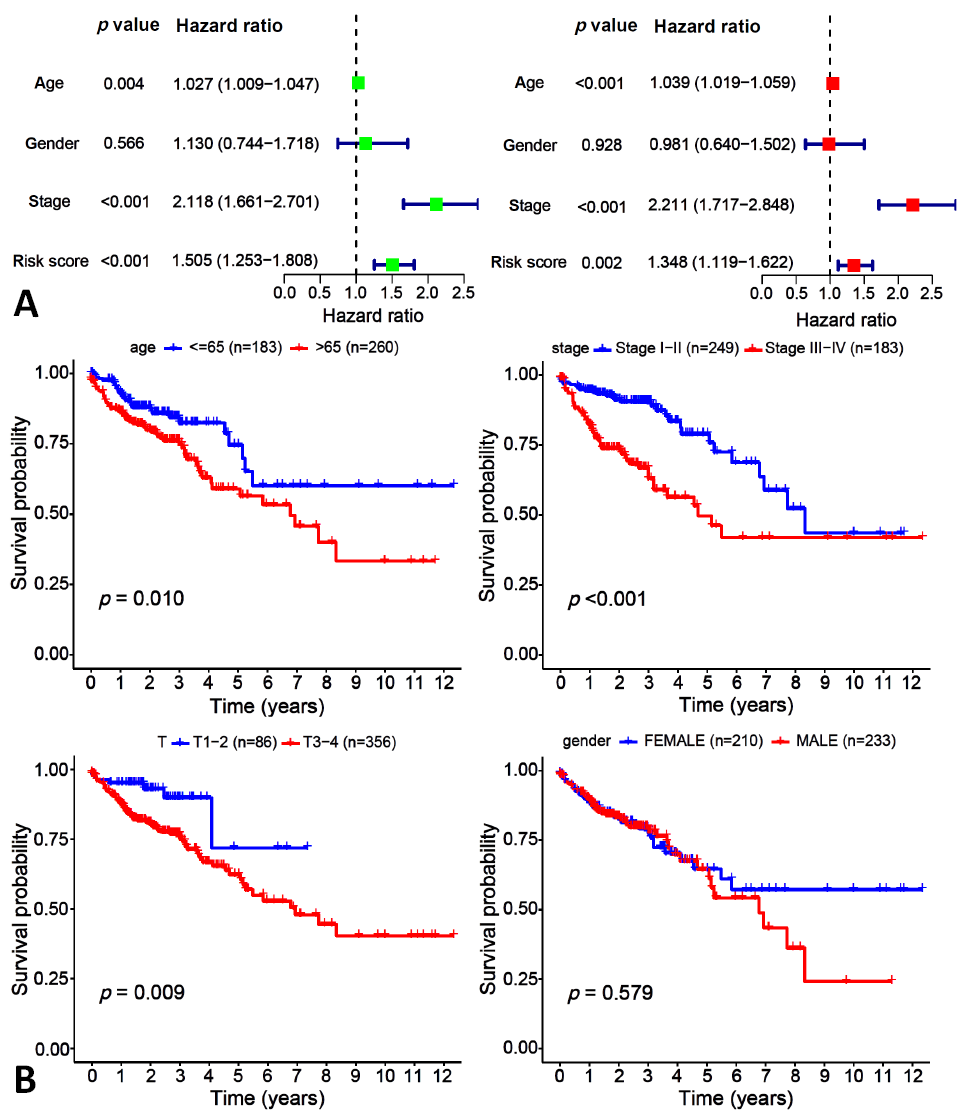
Fig. 5.
Independent prognostic analysis (A) and clinical characteristics analysis (B) for the glycolysis prognosis model. A: uniForest and multForest analysis from left to right, the stage and risk scores were statistically significant (p-value <0.05, Hazard ratio >1); B: 470 tumor samples with colon cancer based on TCGA.

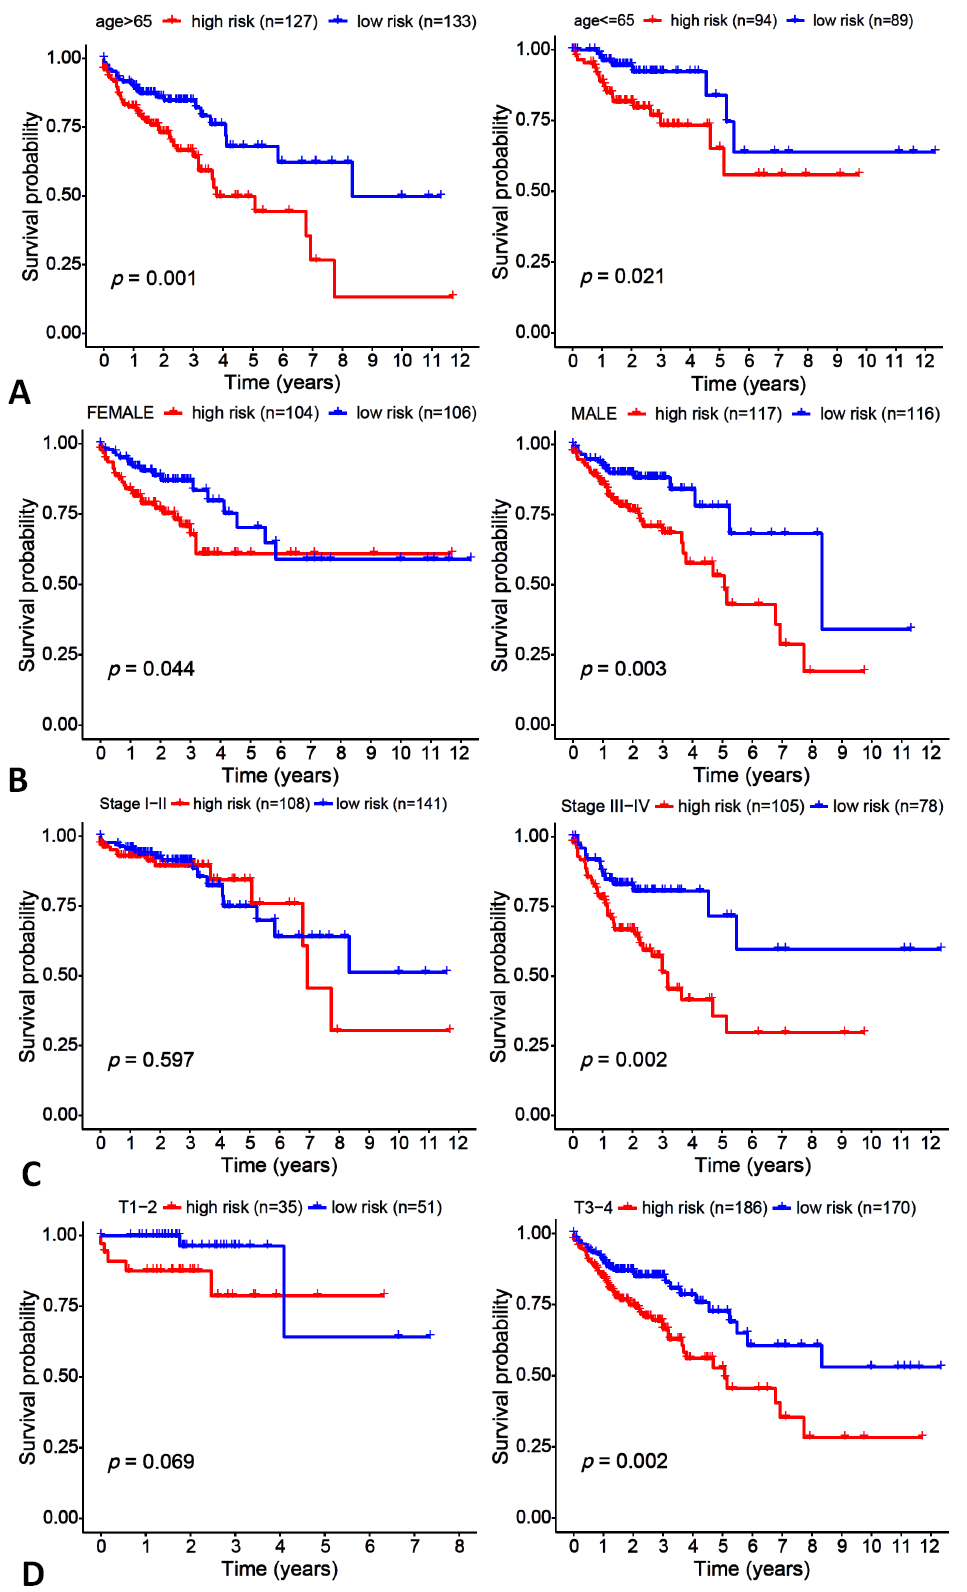
Fig. 6.
Clinical grouping verification for colon cancer patients.
A: based on age; B: based on gender; C: based on stage; D: based on T.

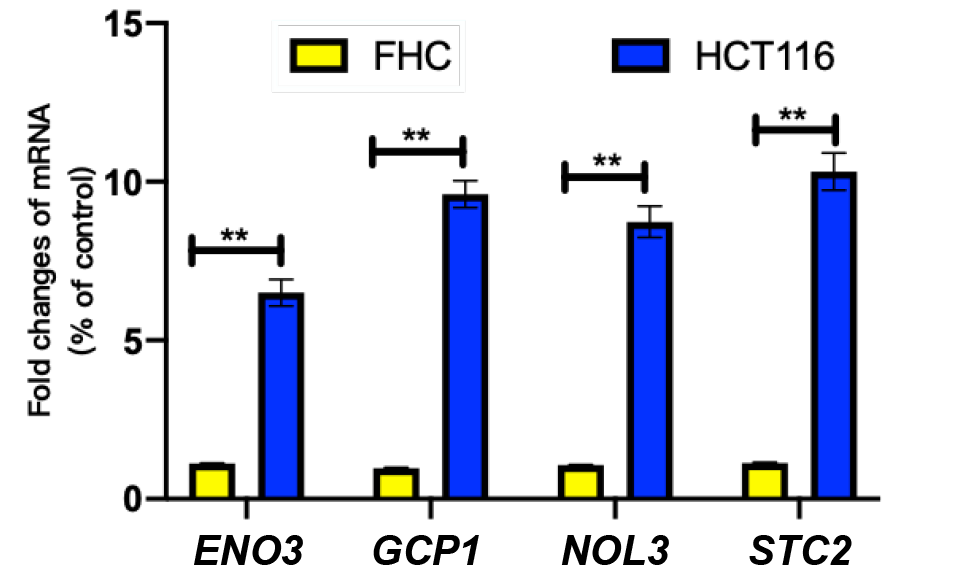
Fig. 7.
Relative expression of ENO3, GCP1, NOL3, STC2 in FHC and HCT116 cells.
FHC, human normal colorectal mucosa epithelial cells; HCT116, Human colorectal cancer cell line; Data were representative of three separate trials; ** P <0.01.

February 2024
Pakistan J. Zool., Vol. 56, Iss. 1, pp. 01-501


