Hazardous Impact of Industrial Wastewater Utilization on Quality Parameters of Tomatoes
Hazardous Impact of Industrial Wastewater Utilization on Quality Parameters of Tomatoes
Rehman Shabbir1, Ghulam Sarwar1, Noor us-Sabah1, Mukkaram Ali Tahir1, Muhammad Luqman*2, Muhammad Fahad Ullah3, Muhammad Zeeshan Manzoor1 and Imran Shahzad1
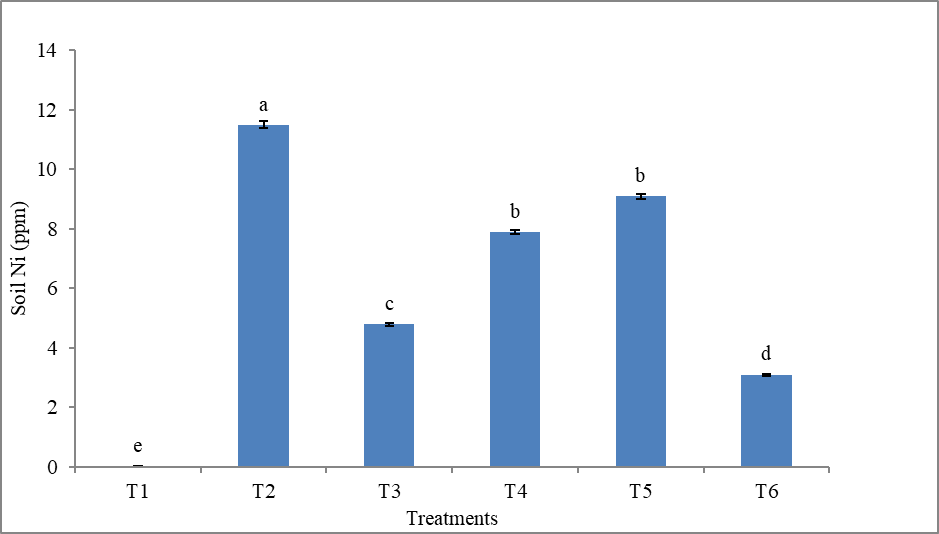
Hazardous impact of industrial wastewater utilization on Ni content (ppm) in soil. T1 = 100% CW (canal water) irrigation; T2 = 100% WW (wastewater) irrigation; T3 = CW 75% + WW 25%; T4 = CW 50% + WW 50%; T5 = CW 25% + WW 75% and T6 = Cyclic/alternate use of CW and WW.
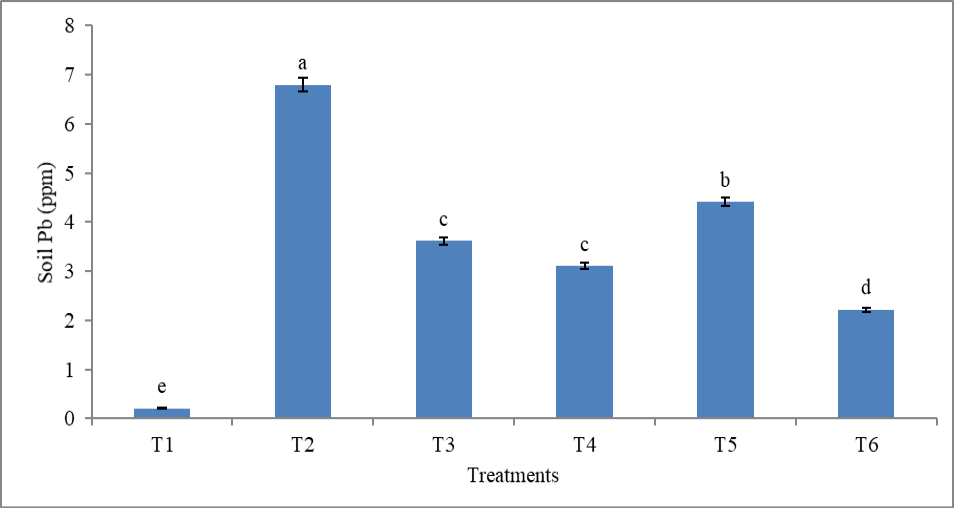
Hazardous impact of industrial wastewater utilization on Pb content (ppm) in soil. T1 = 100% CW (canal water) irrigation; T2 = 100% WW (wastewater) irrigation; T3 = CW 75% + WW 25%; T4 = CW 50% + WW 50%; T5 = CW 25% + WW 75% and T6 = Cyclic/alternate use of CW and WW.
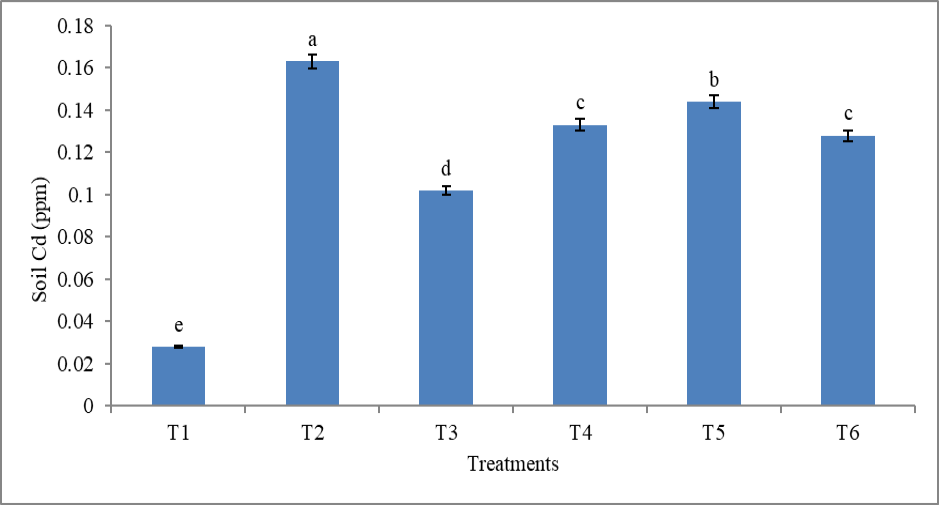
Hazardous impact of industrial wastewater utilization on Cd content (ppm) in soil. T1 = 100% CW (canal water) irrigation; T2 = 100% WW (wastewater) irrigation; T3 = CW 75% + WW 25%; T4 = CW 50% + WW 50%; T5 = CW 25% + WW 75% and T6 = Cyclic/alternate use of CW and WW.
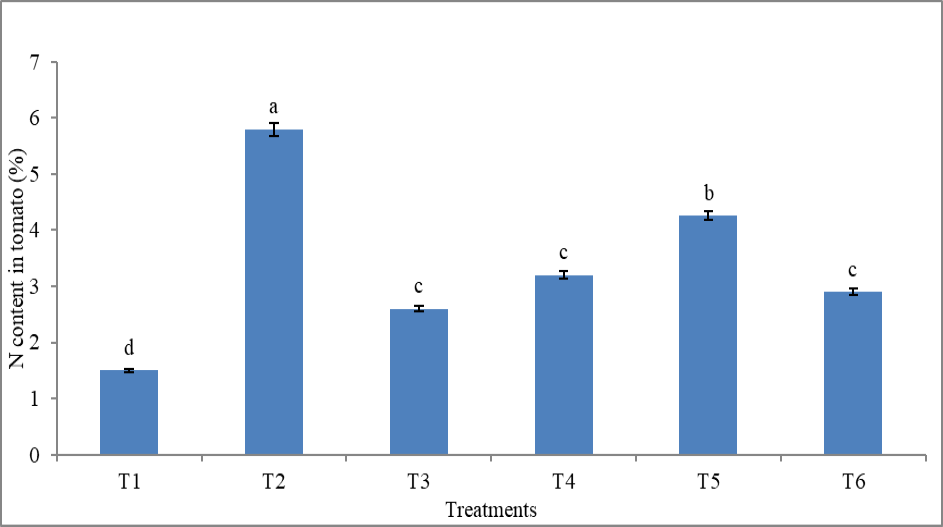
Hazardous impact of industrial wastewater utilization on N content (%) in tomato plant. T1 = 100% CW (canal water) irrigation; T2 = 100% WW (wastewater) irrigation; T3 = CW 75% + WW 25%; T4 = CW 50% + WW 50%; T5 = CW 25% + WW 75% and T6 = Cyclic/alternate use of CW and WW.
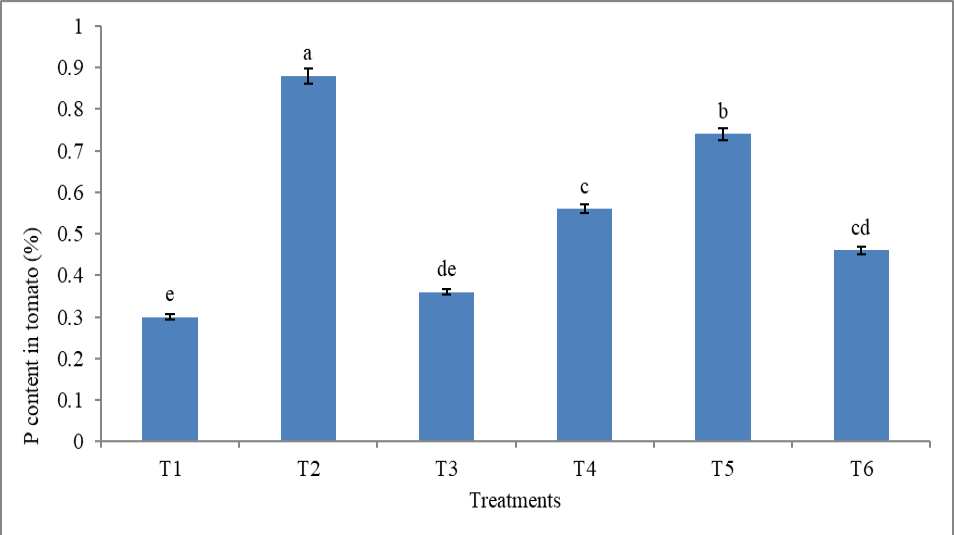
Hazardous impact of industrial wastewater utilization on P content (%) in tomato plant. T1 = 100% CW (canal water) irrigation; T2 = 100% WW (wastewater) irrigation; T3 = CW 75% + WW 25%; T4 = CW 50% + WW 50%; T5 = CW 25% + WW 75% and T6 = Cyclic/alternate use of CW and WW.
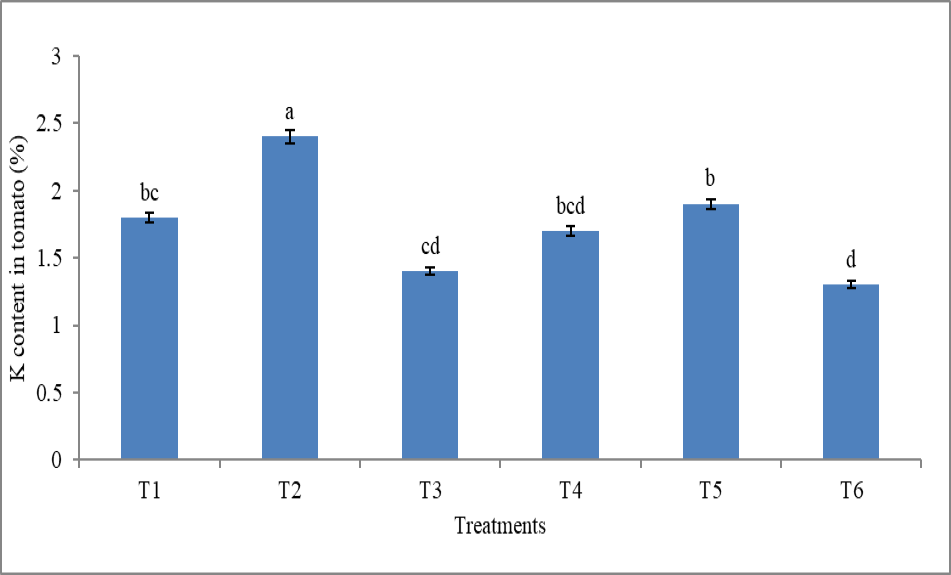
Hazardous impact of industrial wastewater utilization on K content (%) in tomato plant. T1 = 100% CW (canal water) irrigation; T2 = 100% WW (wastewater) irrigation; T3 = CW 75% + WW 25%; T4 = CW 50% + WW 50%; T5 = CW 25% + WW 75% and T6 = Cyclic/alternate use of CW and WW.


