

Genome-Wide Association Study on Chinese Merino Sheep Alopecia


Genome-Wide Association Study on Chinese Merino Sheep Alopecia
Shudong Liu1,2, Shuai Wang1,2, Haoran Cui1 and Genyuan Chen1,2*
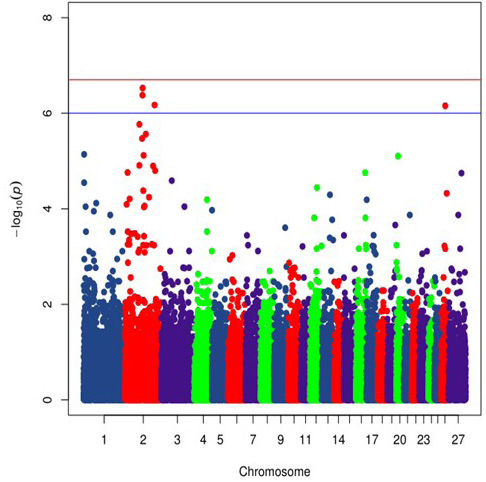
Manhattan plot of Chinese Merino sheep alopecia. The Manhattan plot shows nominal P-values from association with Merino sheep alopecia by chromosomal position. The top red line shows a genome-wide significance threshold defined by nominal P-values of 2.06x 10⁻⁷, which is P= 0.01/48335. The lower blue line shows a genome-wide suggestive significance threshold defined by nominal P-values of 1.03x 10⁻⁶, which is P= 0.05/48335.

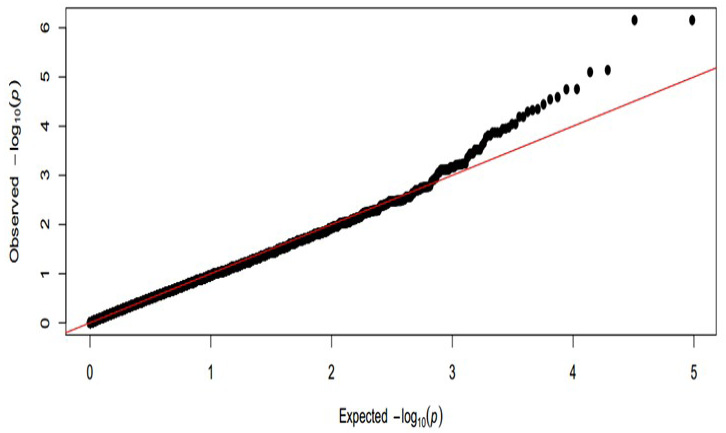
Quantile-Quantile plot of Chinese Merino sheep alopecia. Quantile-quantile plots from association with Merino sheep alopecia, where the red line shows the expected distribution. Comparison of p-value distributions when all the 48335 analyzed Illumina SNPs were included. The expected –log 10 (p) is on the x-axis and the observed –log 10 (p) is on the y-axis.
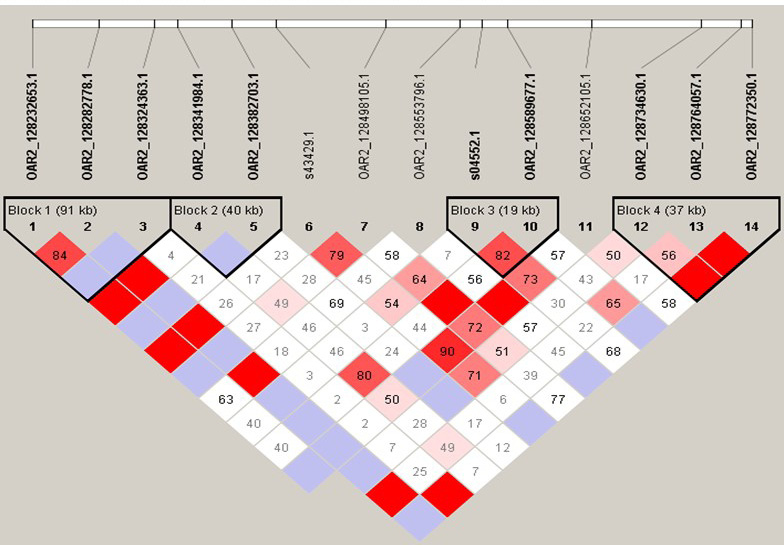
Linkage disequilibrium of the OAR2_128282778.1 surrounding 5.4 Mb, which have 4 haplotype blocks. SNP pairs are coloured according to the standard Haploview colour scheme: D = 1, red; D’<1, other colours. LOD>2 and D’ = 1, red; LOD>2 and D’ <1, shades of pink/red; LOD <2 and D’ = 1, blue; LOD <2 and D’<1, white (LOD is the log of the likelihood odds ratio, a measure of confidence in the value of D’).
Linkage disequilibrium of the OAR2_128282778.1 surrounding 5.4 Mb, which have 4 haplotype blocks. SNP pairs are coloured according to the standard Haploview colour scheme: D = 1, red; D’<1, other colours. LOD>2 and D’ = 1, red; LOD>2 and D’ <1, shades of pink/red; LOD <2 and D’ = 1, blue; LOD <2 and D’<1, white (LOD is the log of the likelihood odds ratio, a measure of confidence in the value of D’).


