Genome-Wide Assessment of Signatures of Selection in the Pakistan Sahiwal Cattle
Genome-Wide Assessment of Signatures of Selection in the Pakistan Sahiwal Cattle
Abdul Rahman Sesay1,2, Muhammad Saif-ur-Rehman1*, Faisal Ramzan1 and Faisal Saeed Awan3
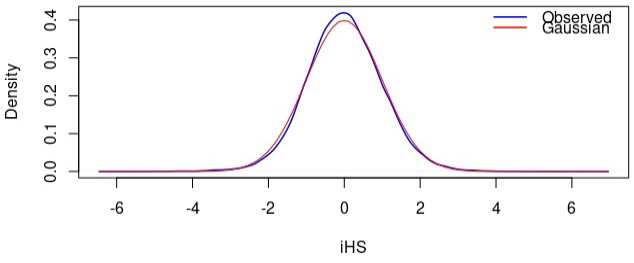
Comparison between the distribution of standardized integrated haplotype scores (iHS) and the standard Gaussian distribution.
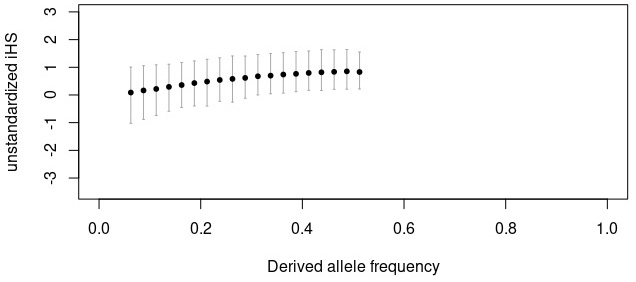
Unstandardized integrated haplotype scores (iHS) within frequency bins.
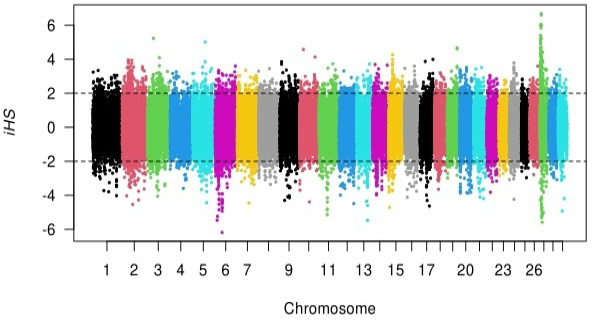
Distribution of the integrated haplotype score (iHS) across the genome.
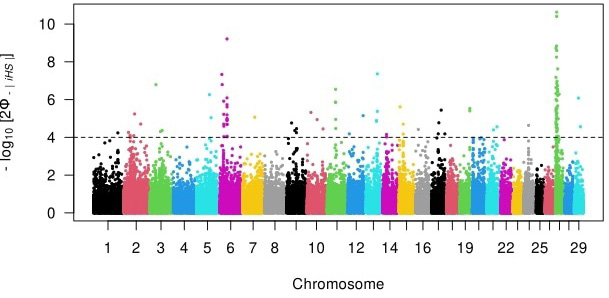
Genome-wide distribution of the logarithmic transformed Integrated haplotype scores (piHS) of each SNP per chromosome.
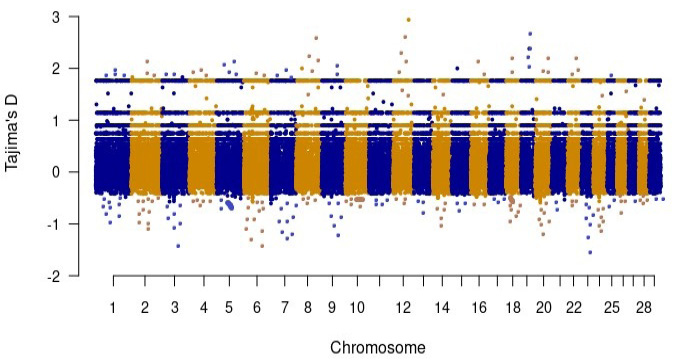
Manhattan plot of Tajima’s D values.
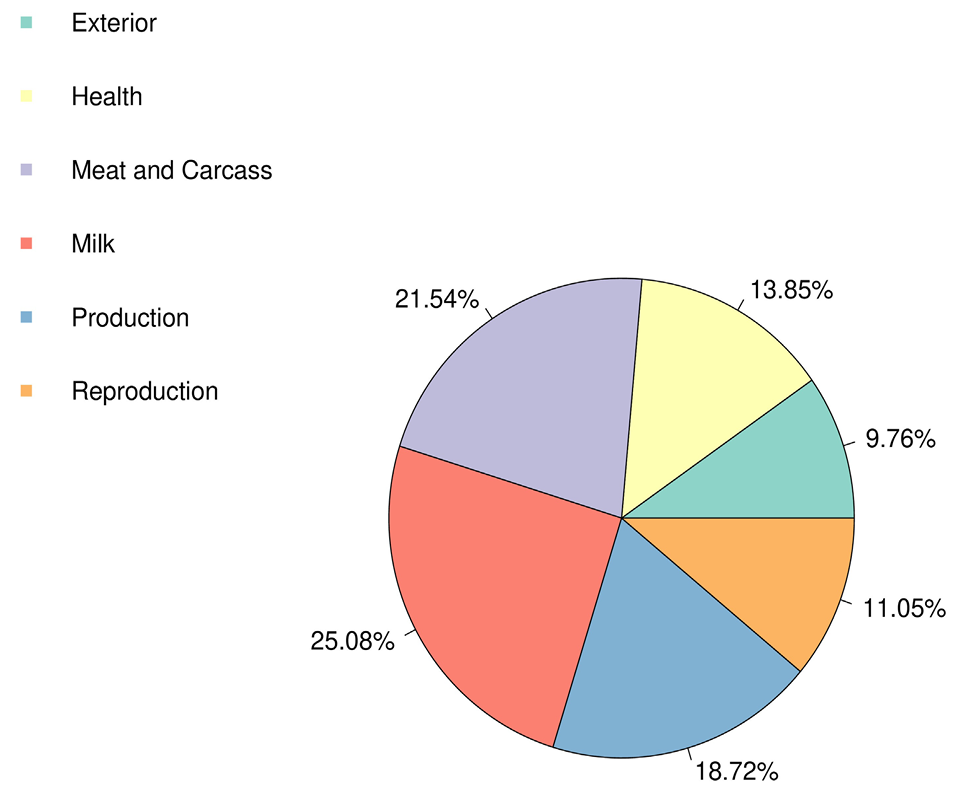
Pie plot shows the part of six quantitative trait loci (QTL) classes annotated in the substantial genomic areas.
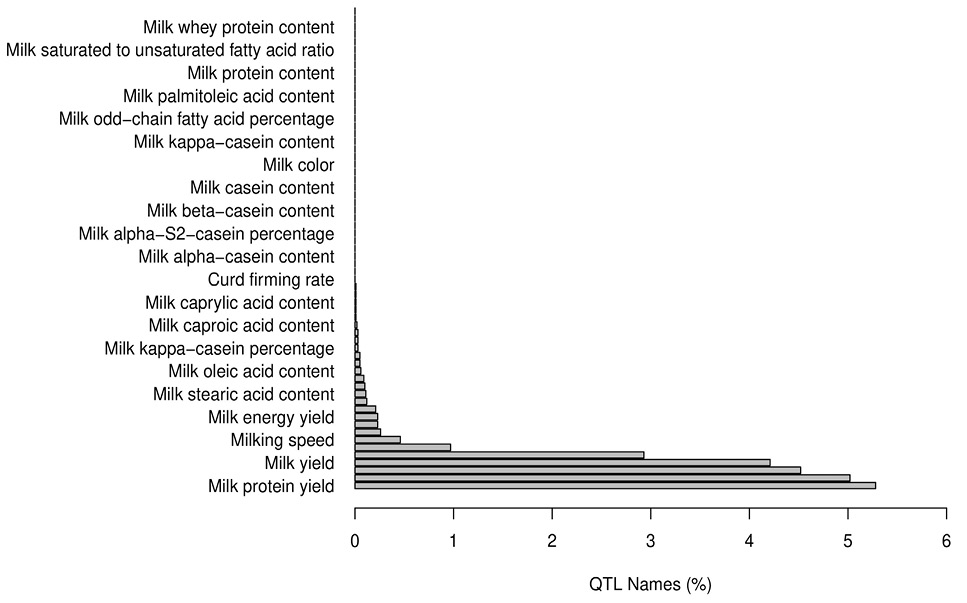
Milk-type quantitative trait loci (QTL) component.
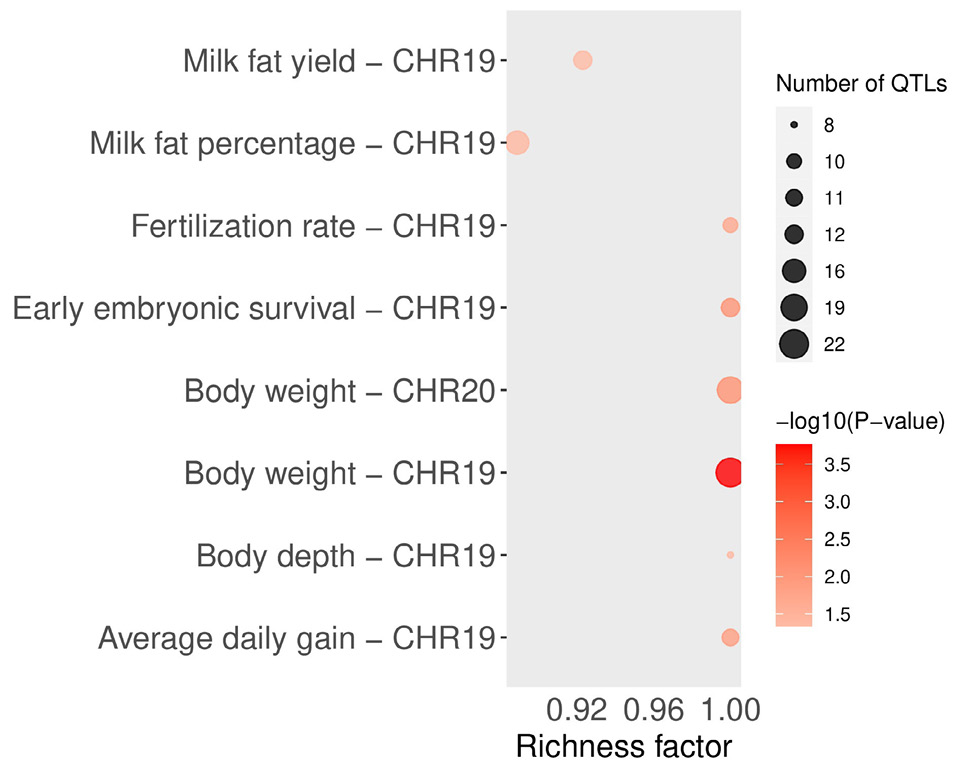
Quantitative trait loci (QTL) enrichment analysis resolute the vital traits enriched in the substantial genomic areas.
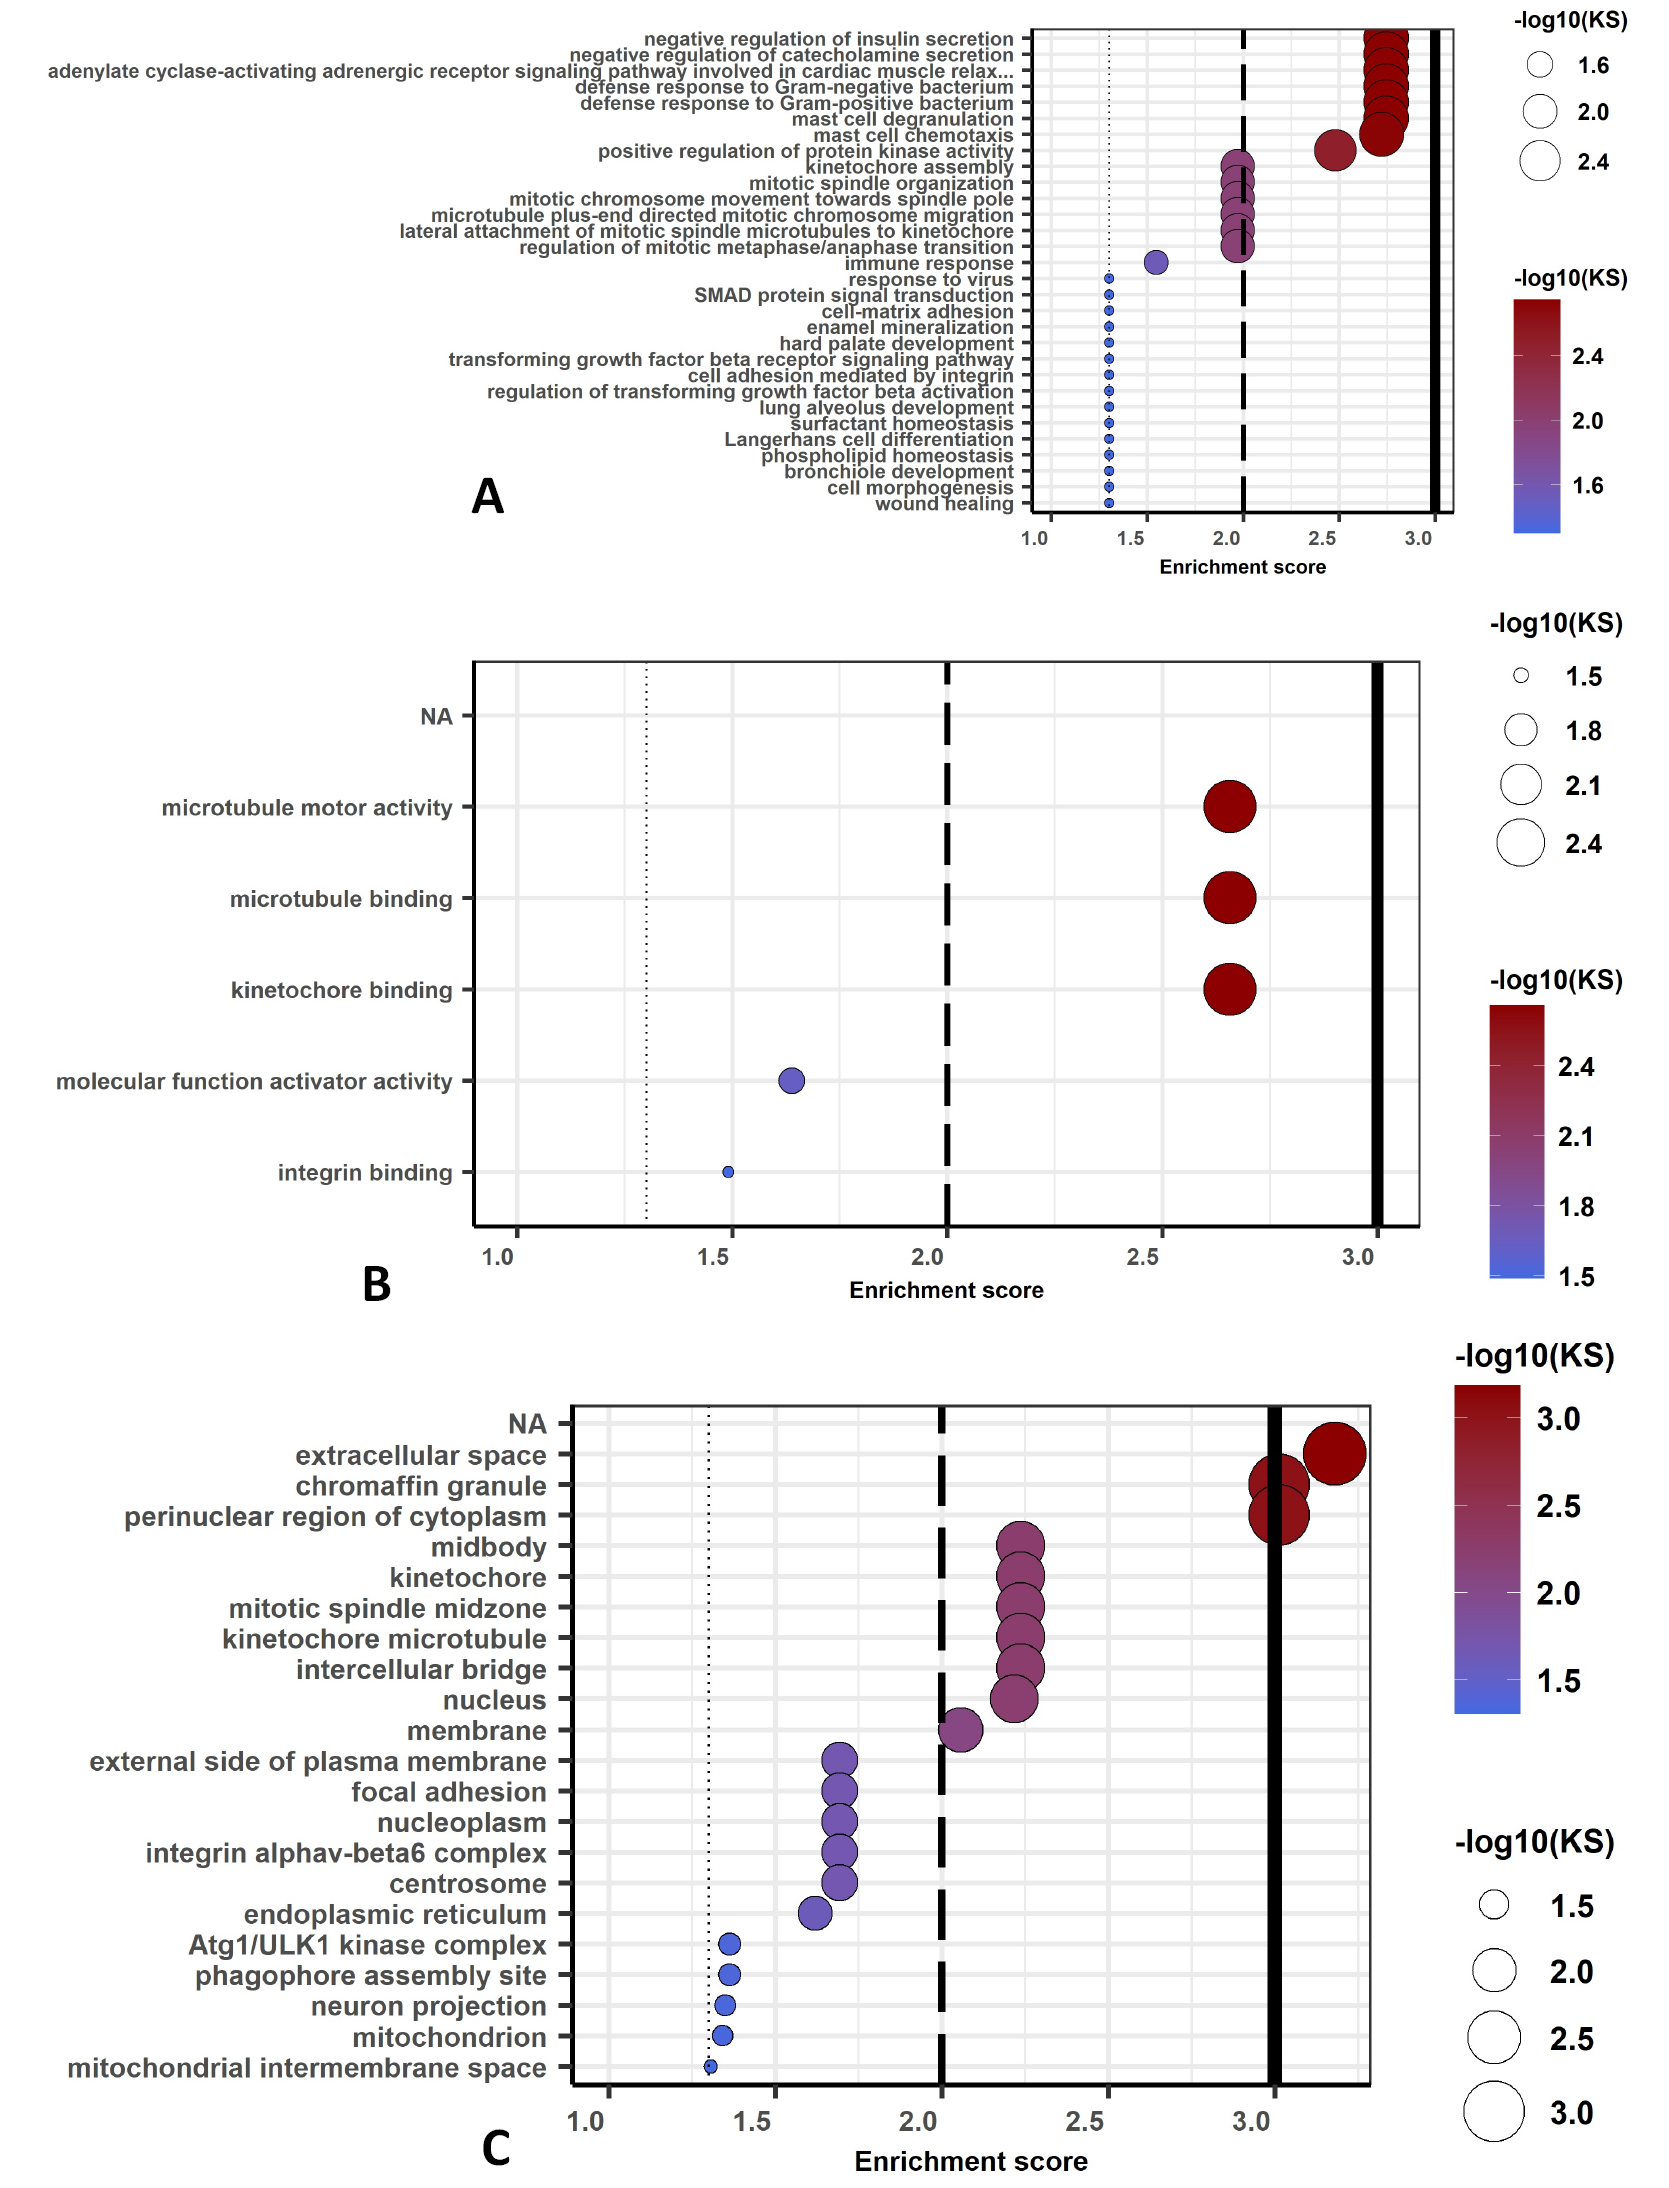
Biological process (A), molecular function (B) and cellular component (C) of gene network computed for the iHS significant potential genes. The cut off lines drawn at equivalents of p=0.05, p=0.01, and p=0.001. KS means the p-value of Kolmogorov-Smirnov test implemented in the R package ‘topGO.
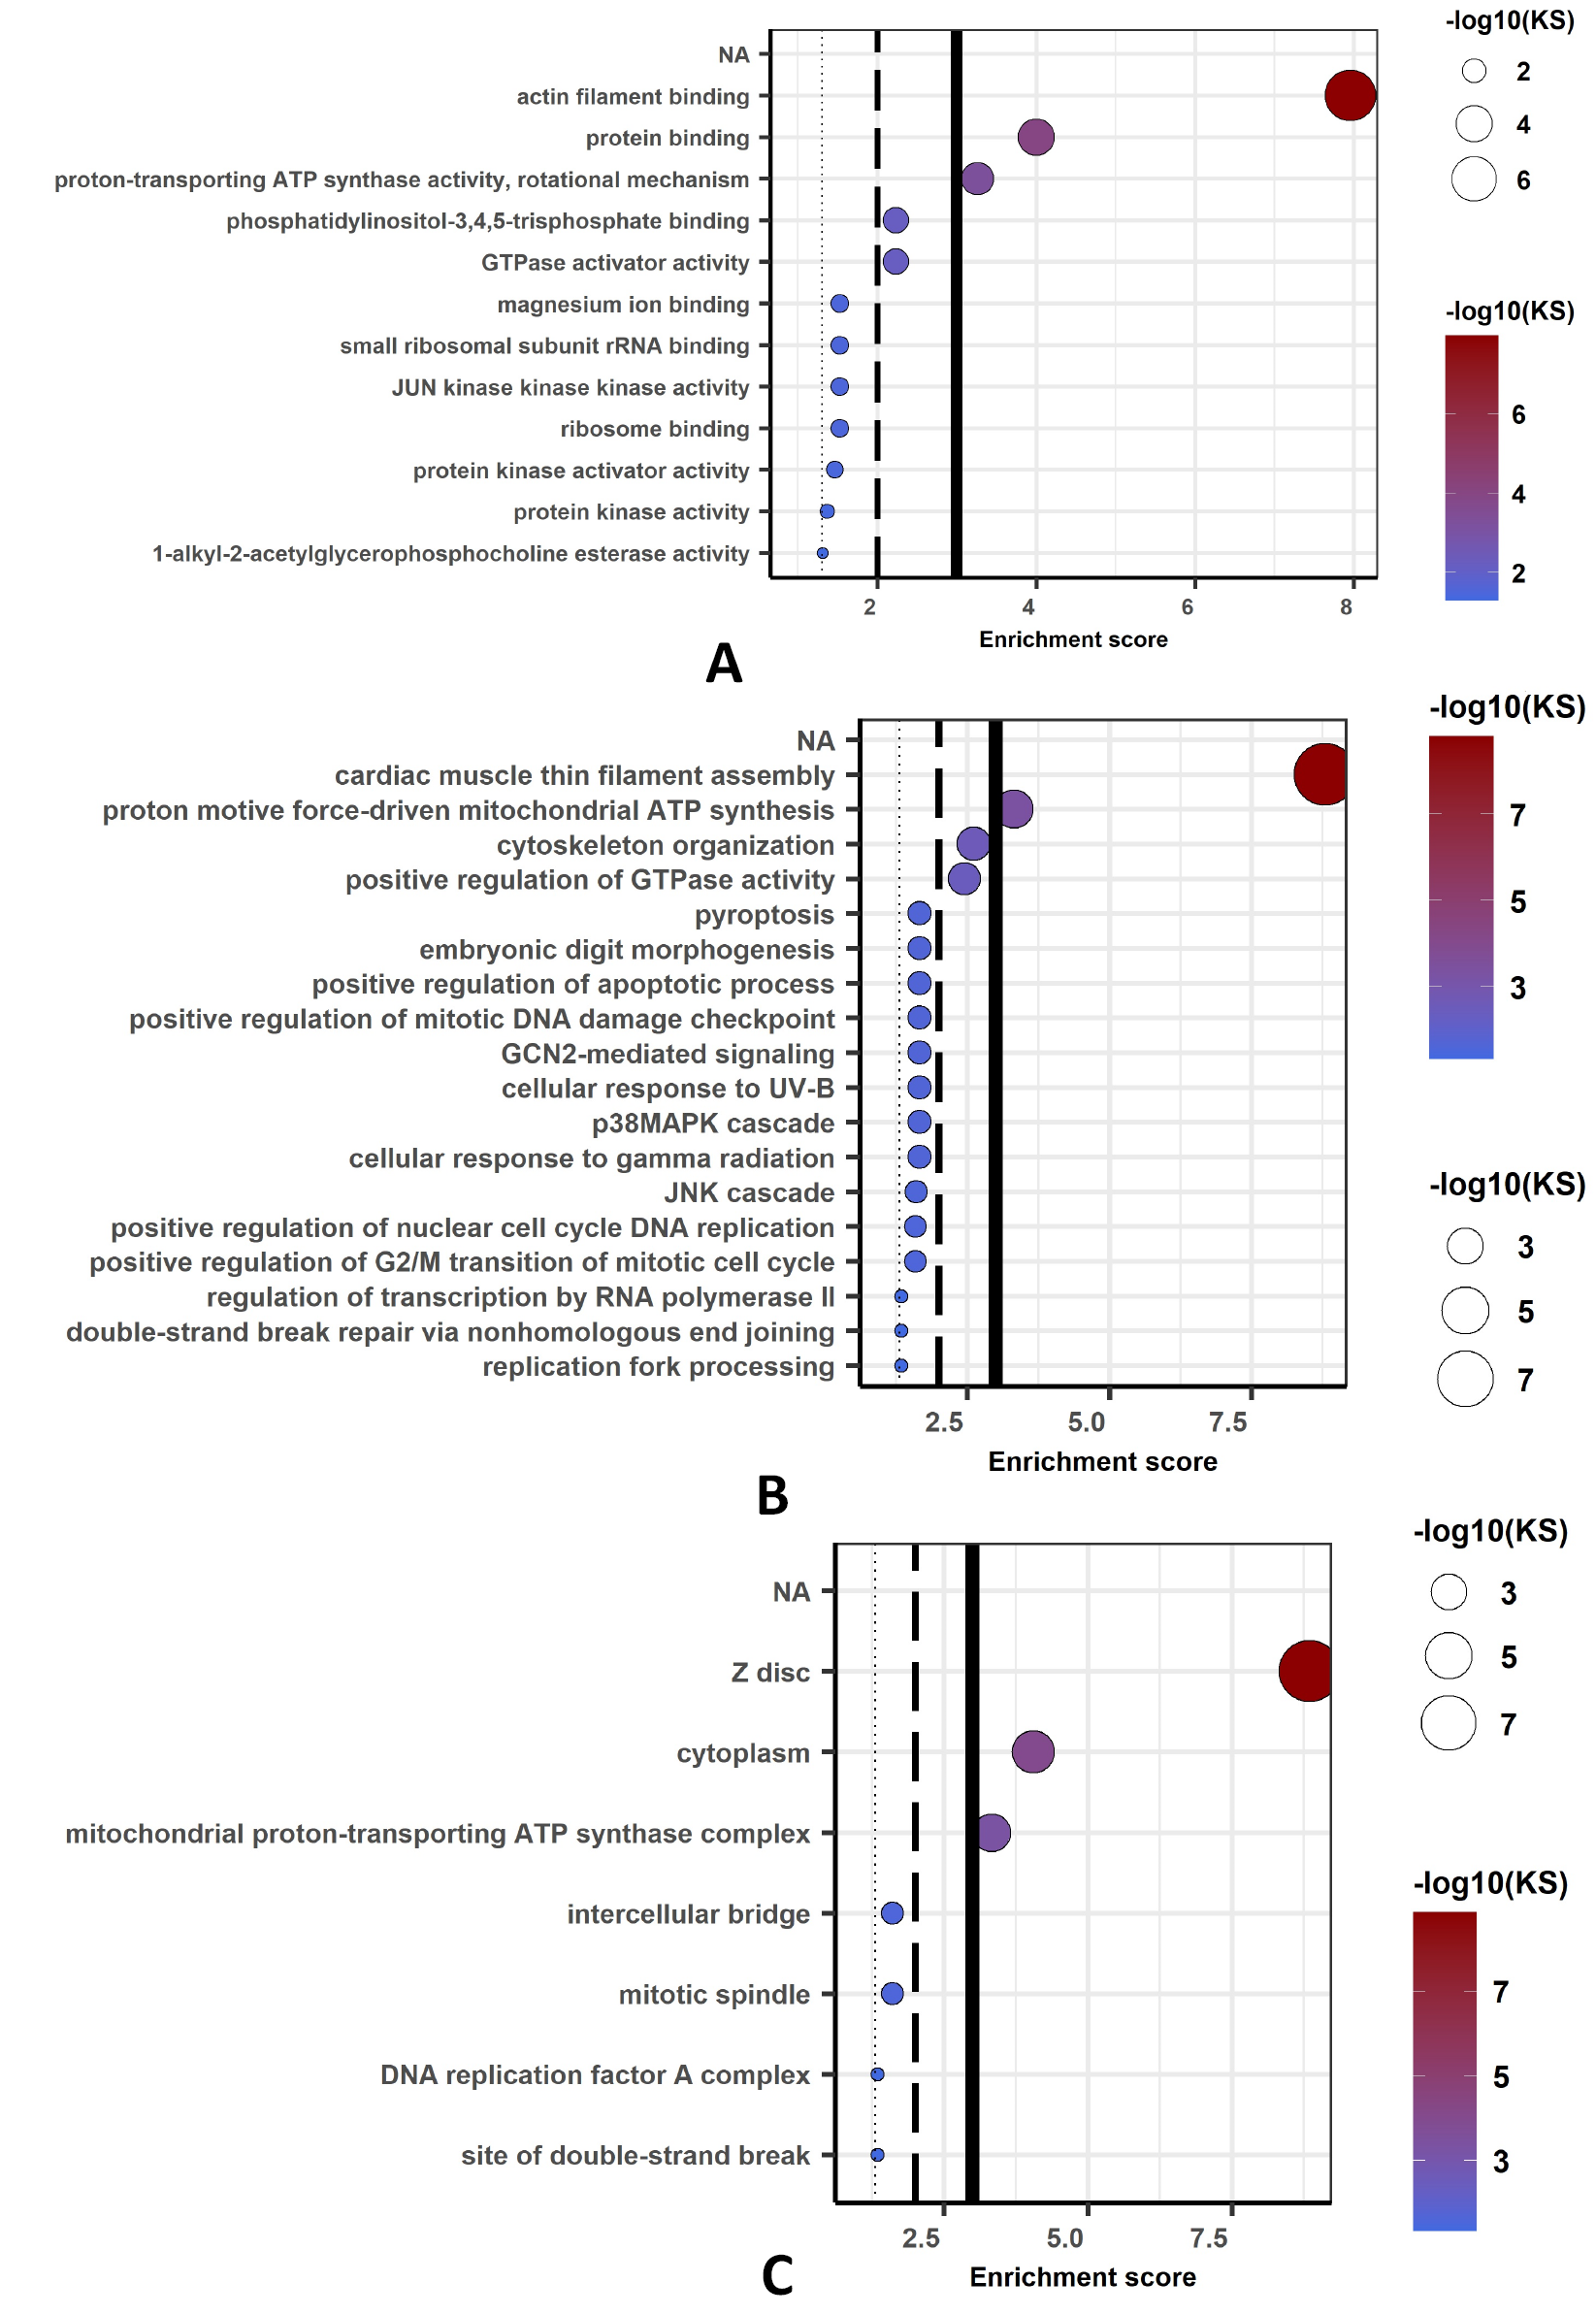
Biological process (A), molecular function (B) and cellular component (C) of gene network computed for the Tajima’s D significant potential genes. The cut off lines drawn at equivalents of p=0.05, p=0.01, and p=0.001. KS means the p-value of Kolmogorov-Smirnov test implemented in the R package ‘topGO.


