

Geniposide Can Rescue the Erythropoiesis Inhibition Caused by Chemotherapy Drug 5-Fu


Geniposide Can Rescue the Erythropoiesis Inhibition Caused by Chemotherapy Drug 5-Fu
Hong-mei Gao, Wen-long Su, Gui-bin Tao, Han-yang Li, Wen-zheng Cao and Zhi-dong Qiu*

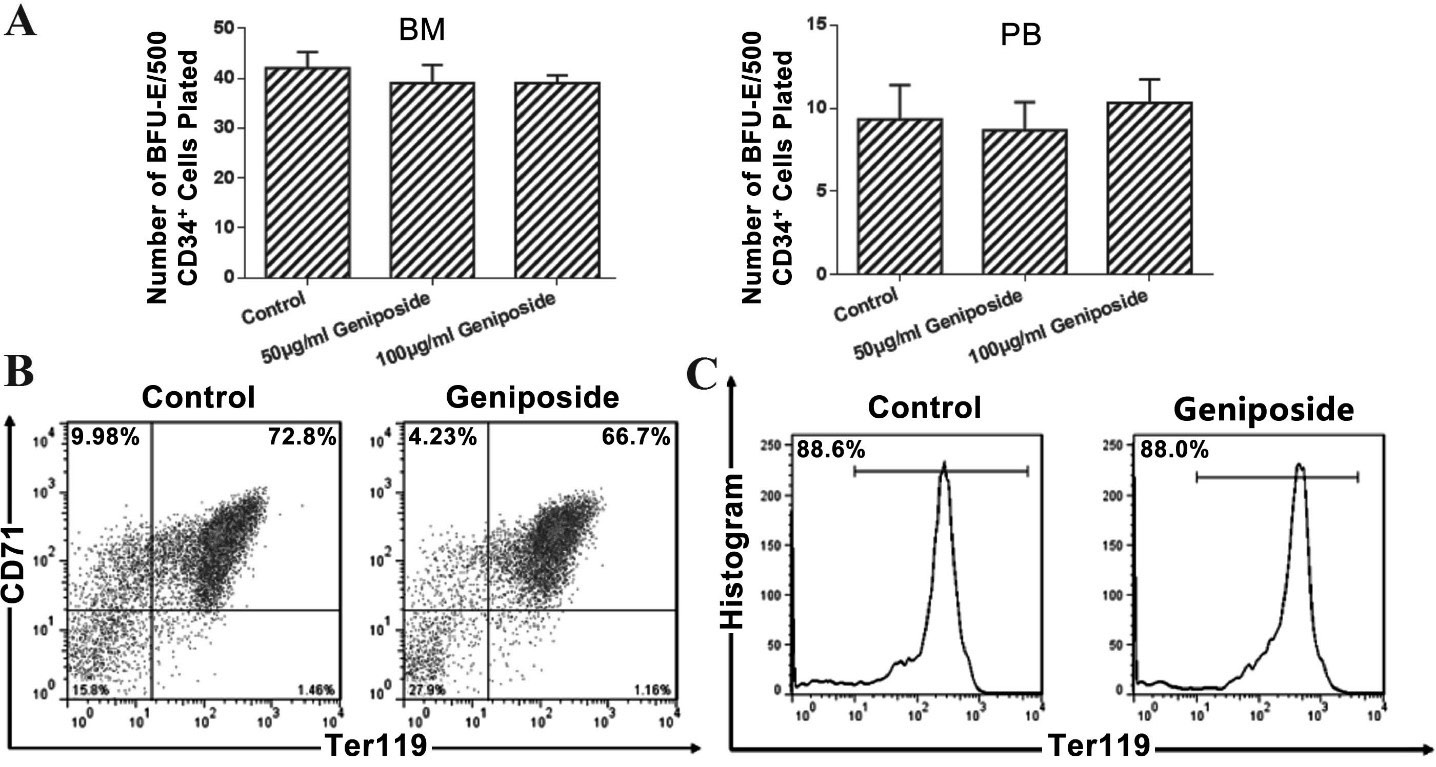
Bar chart for the geniposide effects on erythroid differentiation. (A), BFU-E colonies assayed quantification from BM and PB derived CD34+ cells after 14 days incubation, CD34+ cells cultured in a methylcellulose-based culture supplemeted with SCF, EPO, and IL-3, including control group (absence Geniposide) or experiment group (pesence of Geniposide , 50 and 100 ug/ml); (B), flow cytometric analyses of cells expression CD71 and Ter119 generated from BM derived CD34+ cells incubated for 7 days in serum-free liquid culture system (IMDM-based media with SCF and EPO) in the control group (absence Geniposide) or experiment group (presence of Geniposide, 100ug/mL); (C), flow cytometry histograms of Ter119 expression of erythroid culture after 14 days in liquid culture in the control group (absence Geniposide) or experiment group (presence of Geniposide, 100ug/mL).
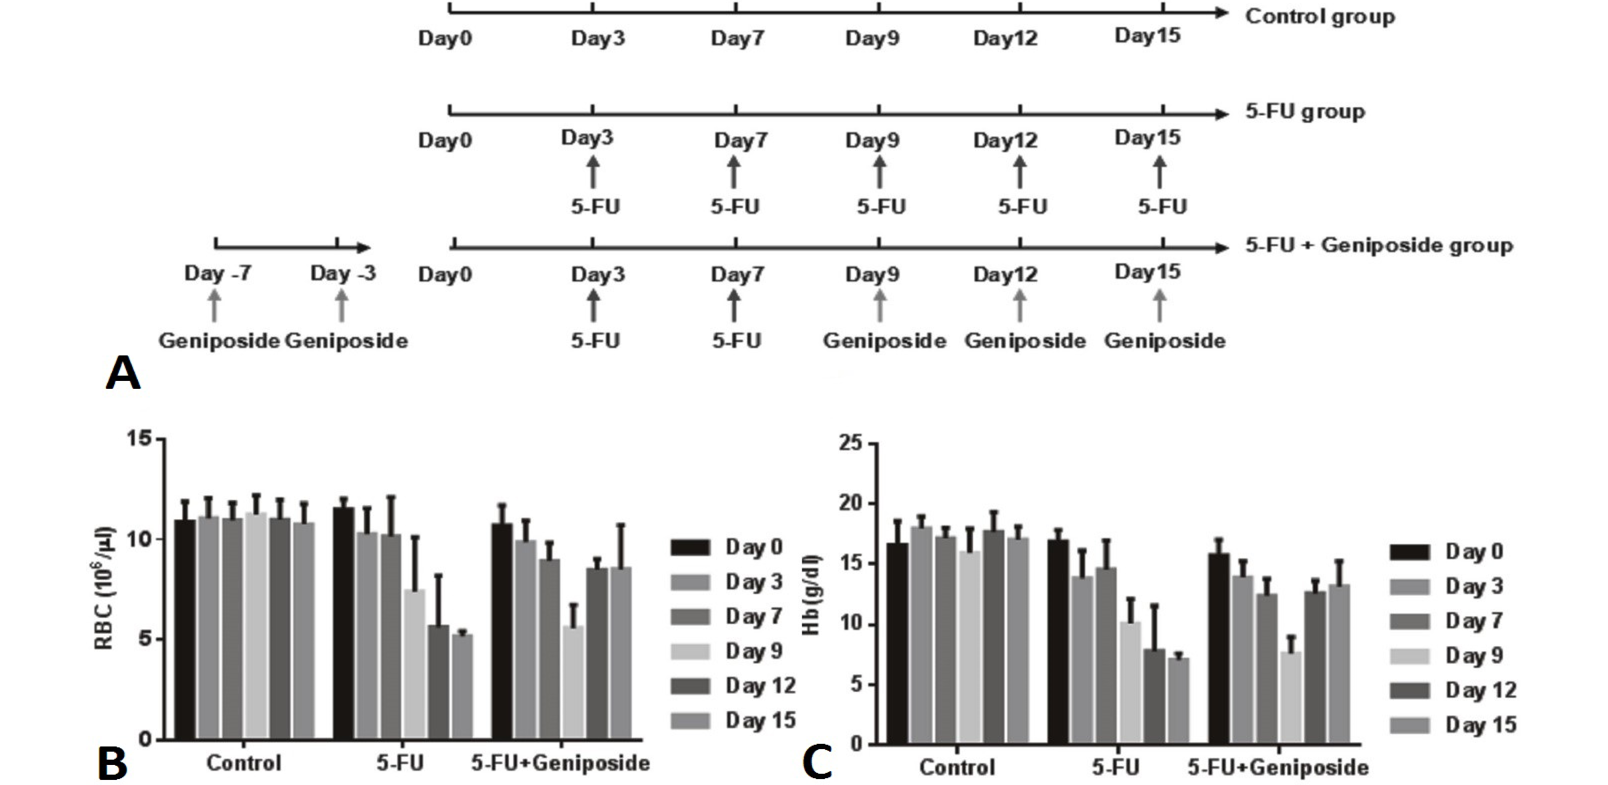
Evaluation of geniposide condition in mice. (A), schematic representation of the mouse experient design for different time point including control group, 5-Fu treatment group and 5-Fu + Geniposide group; (B, C), parameters of PB were summarized from control group, 5-Fu treatment group and 5-Fu + Geniposide group mice: RBC count (B) and Hb (C).
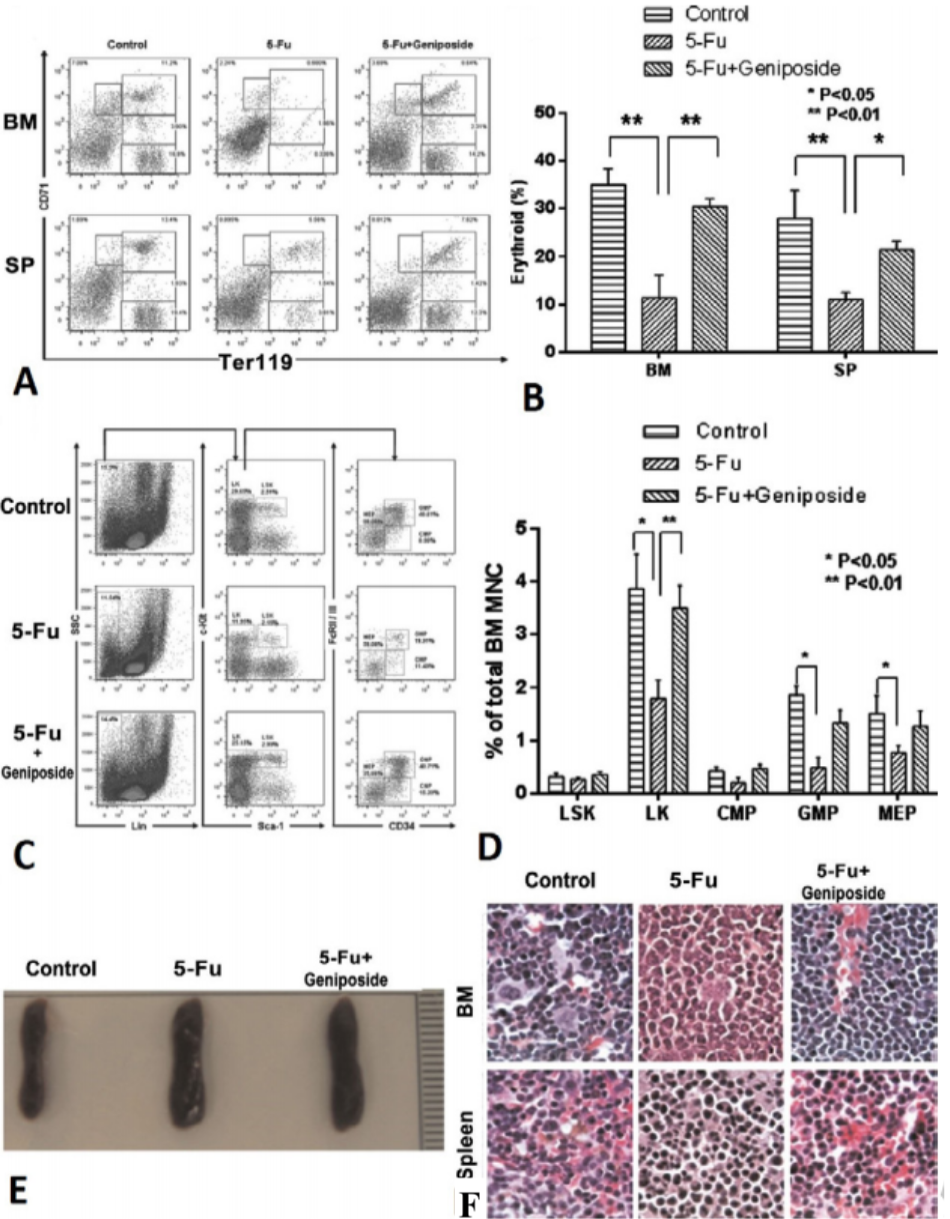
Evaluation of erythroid cells, LSK / LK cells in mouse BM and spleen. (A), flow cytometry analysis erythroid cells population of BM and spleen cells of representative in control group, 5-Fu treatment group and 5-Fu + Geniposide group mice; (B), quantitation of the percent of erythroid cells in total BM cells of each group mice; (C), flow cytometric analysis of LSK and LK compartments in BM of control group, 5-Fu treatment group and 5-Fu + Geniposide group mice; (D), quantitation of the percent of LSK, LK, CMP, GMP, and MEP cells in total BM cells of each group mice; (E), spleen size compare for including control group, 5-Fu treatment group and 5-Fu + Geniposide group; (F), H&E staining of paraffin-embedded sections of BM and spleen for control group, 5-Fu treatment group and 5-Fu + Geniposide group.

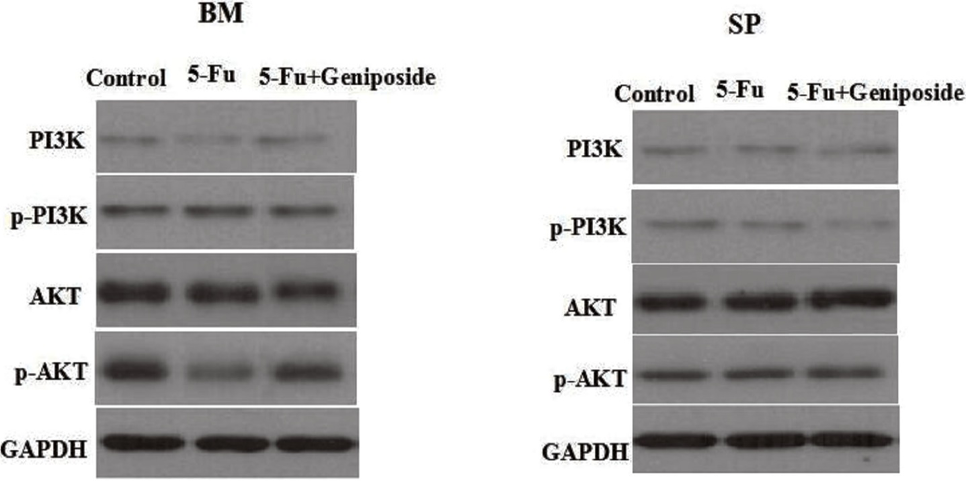
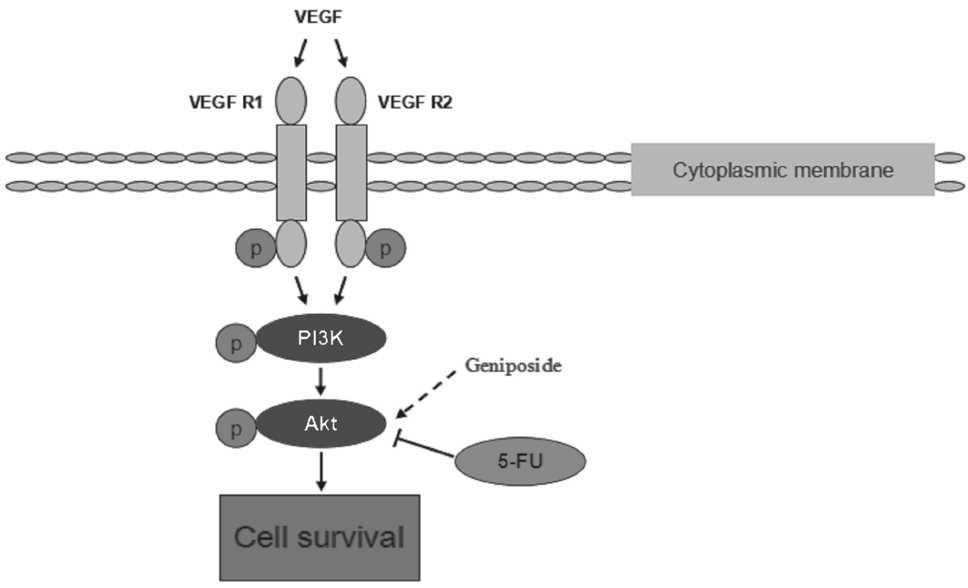
Effects of geniposide after treatment with 5-Fu. Western blot assay showed in the BM that, the p-Akt expressions had lower expressions in 5-Fu treatment group compared with control group. The low expressions rescued by add Geniposide in 5-Fu + Geniposide group. In spleen, there is no significant difference.

The hypothesis schematic representation of the potential mechanisms underlying geniposide effects on cell survival.


