Genetic Structure of the Population of Suri alpaca from Peru


Research Article
Genetic Structure of the Population of Suri alpaca from Peru
Roberto Gallegos-Acero1, Ali William Canaza-Cayo2,4*, Francisco Halley Rodríguez-Huanca1, Rubén Herberht Mamani-Cato3, Abigail de la Cruz1, Júlio Sílvio de Sousa Bueno Filho4
1Facultad Medicina Veterinaria y Zootecnia. Universidad Nacional del Altiplano. Puno. Perú; 2Facultad de Ciencias Agrarias, Escuela Profesional de Ingeniería Agronómica. Universidad Nacional del Altiplano. Puno. Perú; 3Estación Experimental Illpa, Instituto Nacional de Innovación Agraria. Puno. Perú; 4Departamento de Estatística, Instituto de Ciências Exatas e Tecnológicas, Universidade Federal de Lavras, Código postal 3037, CEP 37200-900 Lavras, MG, Brasil.
Abstract | The objective of the study was to evaluate the genetic structure of the Suri alpaca population, from the Quimsachata Research and Production Center of the Illpa-Puno Experimental Station of the National Institute of Agrarian Innovation, Peru. Data from 1350 Suri alpacas born from 1993 to 2015 (636 males and 714 females) were analyzed using the method of genealogical analysis method. ENDOG program v.4.8 was used for the calculation of the following parameters of the genetic structure such as: average inbreeding coefficient (F), average relatedness coefficient (AR), the effective numbers of founders ( ), effective number of ancestors (
 ), generation interval (GI) and the pedigree completeness, the ENDOG program v.4.8 was used. The F and AR were 0.06% and 0.40%, respectively, The number of ancestors that gave rise to the reference population was 288, the for the reference population was 132. The was 338 animals. The average generational interval was 5.53 years, being higher in the gametic pathways: sire-daughter and sire-son. The pedigree completeness level by the maternal pathway was 72.07% and by the paternal pathway was 46.0%. In conclusion, the generational interval in Suri alpacas of the Germplasm Center was long. The F was of small magnitude, so mating practices were appropriate during the evaluation period.
Keywords | Alpacas Suri, Inbreeding, Genetic structure, Effective population size, Gametic pathways.
Received | July 03, 2023; Accepted | August 20, 2023; Published | November 01, 2023
*Correspondence | Ali William Canaza-Cayo, Facultad de Ciencias Agrarias, Escuela Profesional de Ingeniería Agronómica. Universidad Nacional del Altiplano. Puno. Perú; Email: alicanaza@unap.edu.pe
Citation | Gallegos-Acero R, Canaza-Cayo AW, Rodríguez-Huanca FH, Mamani-Cato RH, Cruz ADL, Filho JSSB (2023). Genetic structure of the population of suri alpaca from peru. J. Anim. Health Prod. 11(4): 357-362.
DOI | http://dx.doi.org/10.17582/journal.jahp/2023/11.4.357.362
ISSN | 2308-2801

Copyright: 2023 by the authors. Licensee ResearchersLinks Ltd, England, UK.
This article is an open access article distributed under the terms and conditions of the Creative Commons Attribution (CC BY) license (https://creativecommons.org/licenses/by/4.0/).
INTRODUCTION
The alpaca is one of the 4 species of South American camelids that inhabits the Andean highlands in particular the puna zone between 4000 and 4800 meters above sea level. Today, raising alpacas is of great importance for the livestock industry and represents the main economic resource for the smallholders of Andean highlands. Alpaca produce one of the finest fibers that exhibits very special textile characteristics compared to other species that produce fiber and wool. In Peru, alpaca breeding constitutes a very valuable genetic resource since Peru is the original center of domestication for the South American camelids (Mader et al., 2018). Peru has the largest population of alpacas worldwide (86%). The largest population is found in the Puno region with 1,459,900 animals. Of this population, 1,209,716 are Huacaya alpacas, representing 86.4% of the Peruvian alpacas, while the Suri alpaca with 190,528 animals constitutes 13.3% (Cenagro, 2012).
The evaluation of the genetic structure of populations of domestic animals provides base information permitting the genetic characterization of a particular population. This type of study is carried out due to the effect of dispersal barriers or variation that originates from random mating (Cervantes et al., 2011). In other populations, there is no clear genetic structure because there is a continuous flow of genes. When the genetic structure of a population is known, how the flow of genes has occurred in the population and the number of alleles that originated in the population can be determined. This provides information on genetic variability and allows decisions to be made in relation to animal breeding programs (Cervantes et al., 2011).
The genetic structure of a population is defined as the amount and distribution of genetic variation within and between populations. This, in turn, is the result of the mode of reproduction of evolutionary forces, gene flow, genetic drift, mutation, and selection acting on the population (McDonald and Linde, 2002; Stefansson et al., 2012). The genetic structure and its changes in populations are crucial, not only as a guide to carry out genetic control, but also to evaluate the results of a selection program (Malhado et al., 2010). Pedigree analysis is one of the most important tools for understanding the genetic structure of a population and the genetic status between and within populations (Leroy et al. 2013), which, in turn, allows breeders to know the history of a breeding program and monitor it successfully (Agung et al., 2016; Borges et al., 2013).
The evaluation of the genetic structure of a population or herd of animals through genealogical analysis has been carried out in several species such as beef cattle, milk cows, sheep, etc., but in alpacas and llamas, there is little research. The present study aimed to analyze the genetic structure of the Suri alpaca population of the Quimsachata Research and Production Center of the Illpa-Puno Experimental Station of the National Institute of Agrarian Innovation, Peru, using the pedigree analysis method.
MATERIALS AND METHODS
Location
The study was carried out in the Quimsachata Research and Production Center of the Illpa-Puno Experimental Station of the National Institute of Agrarian Innovation, located between the districts of Cabanillas, Province of San Román, and the district of Santa Lucia, province of Lampa, Region Puno located at 4,025 m. 15°47’13”S and 70°37’22”W with temperatures ranging from -5°C to 18°C, with an average annual rainfall of 700 mm.
Data
Data was obtained from the records of controlled mating and calving records of Suri alpacas from the Quimsachata Center. The pedigree information file included 1,350 animals, of which 436 males and 714 females were born between 1993 and 2015.
Pedigree analysis
The average inbreeding coefficient (F) was calculated using the algorithm of Neuwissen and Lou (1992) and is included in the ENDOG program. The average relatedness coefficient (AR) was estimated on the average of the elements of each row of the additive ratio matrix that would give rise to a vector C1=(1/n)11A, where A is the matrix of additive relationships of size n × n, which corresponds to an algorithm developed by Quaas (1976).
The increase in the inbreeding coefficient (∆F) was calculated for each generation using the formula:
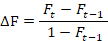
where Ft refers to the average inbreeding coefficient at the t-th generation.
The effective number of founders () was calculated using the following formula:

where  is the probability of origin of genes from founder k.
The effective number of ancestors () was calculated in much the same way as the effective number of founders, using the formula:

Where a is the number of ancestors and  is the marginal contribution of ancestor j.
Generation interval values were calculated considering the four selection pathways, for the sire-son pathway (Lss), sire-daughter pathway (Lsd), dam-son pathway (Lds) and dam-daughter pathway (Ldd). The mean generation interval (GI) was computed using the expression
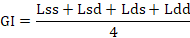
The ENDOG version 4.8 program (Gutiérrez and Goyache, 2005).
RESULTS AND DISCUSSION
Increase in the population of Suri alpacas
For the evaluation period between 1993 and 2015 which corresponds to 23 years (Figure 1), an increase in the number of offspring was observed with some variation. The largest increase was recorded in 2008. There was a significant decrease in population until 2011 with increasing numbers until 2013, at which time numbers once again began to decrease. The importance of studying population growth lies in achieving better predictions about future changes in population size and growth rates for repopulation, habitat control, etc.(Snider and Brimlow, 2013). A similar population trend was seen with dams and the number of offspring. The largest number of offspring with identified dams were from 1993 to 1997 and from 2007 to 2009. Differences in the number of offspring with the number of dams is due to the loss of ear tags from the dams.
Parameters of the genetic structure of the Suri alpaca population
The main population parameters are presented in Table 1, where the total number of Suri alpacas in the population was 1,350. The base population with at least one unknown sire was 838 alpacas, and the actual population with only one known sire was 553 alpacas.
The effective number of founders () for Suri alpacas was 338, which indicates the number of effective reproductive alpacas this real population presents; but from the point of view of the probability of origin of the genes, it provides information for the identification of gene flow and also for measuring genetic variability. Additionally, the effect of the mating system that has been used in the population can be seen, considering that all the genes that are present in a population come from one of its founders and depends on the use assigned to each breeder. In comparison the effective size of the base population of the genealogical population of 4,698 llamas born between 1993 and 2014 at the Quimsachata Center was 508.10. The difference for Suri alpacas is the effect of the number of animals evaluated and effects of the species (Mamani et al., 2016). In addition, a population estimated to have a small effective size, could be prone to loss of genetic variation due a smaller number of breeders, a large variation in reproductive success, and unbalanced sex ratio (Wang et al., 2016).
Table 1: Population and genetic diversity parameters obtained from the genealogy of Suri alpacas from Quimsachata Center.
| Parameter* | Value |
| Total number of animals in the population | 1350 |
| Base population (at least one unknown parent) | 838 |
| Actual base population (only one known parent) | 553 |
|
The effective numbers of founders ( |
338 |
| Average inbreeding coefficient (F,%) | 0.06 |
| Average relatedness coefficient (AR,%) | 0.40 |
| Number of animals in the reference population | 512 |
| Number of ancestors that give rise to the reference population | 288 |
|
Effective number of ancestors for the reference population ( |
132 |
| N° of ancestors that explain 100% of the genetic variability of the population | 287 |
| N° of ancestors that explain 50% of the genetic variability of the population | 49 |

* All variables were expressed in numbers except those were indicated in %age.
The F value in Suri alpacas from the Quimsachata Center (Figure 2) from 1993 to 2004 was zero because the offspring had both a Huacaya sire and a dam, therefore they were registered in the population of Huacaya alpacas. Also, some sires and dams who were Suri alpacas and who had Huacaya offspring were registered in the herd of Suri alpacas. This way of managing alpacas has not allowed the maintenance of a genealogical record. We observed that from 2010 to 2012 the inbreeding value was zero. As of 2005, a rapid increase in inbreeding was observed with a higher percentage in 2009, 2013, and 2015. In general terms, the F for the Suri alpaca had a value of 0.006%. Similar inbreeding values were reported in other studies (0.16%, Vilela and Asparrin, 2013; 0.04%, Mamani, 2013; 0.004 to 0.16, Calderon et al., 2021; 0.043%, Pallotti et al., 2023). The inbreeding rate obtained in this study was lower than Illamas 0.11% from the Quimsachata Center (Mamani, 2013). Recently, Apaza (2023) reported inbreeding values between 0.0015 to 0.5 in llamas of the K’ara and Ch’aku varieties, respectively, from the Puno region. These values indicated that the management program of alpaca Suri from Quimsachata Center was acceptable for this species.
The AR value which is a measure of the percentage of genes that each animal shares with the rest of the individuals was 0.40%. This is a low value, similar to results obtained from llamas, 0.25% (Mamani, 2013).
The number of animals in the reference population was 512, of these the number of ancestors that contributed effectively to the reference population was 288 (Table 1). The number of ancestors that explain or determine 50% of the genetic variability of the population is 49 animals, as shown in Figure 3. This is the result of the values of the effective size of the base population () and the effective number of ancestors () that reached a value of 132 alpacas.
Consequently, the number of alpacas in the reference population where both the sire and the dam are identified in the Suri alpaca herd is 512, the number of ancestors referred to as 49 alpacas, which is very close to the minimum of 50 animals, therefore, this population of Suri alpaca from the Quimsachata Center is at risk of extinction.
Generation interval
The generational interval calculated for the four genetic pathways is shown in Table 2, where the average generational interval was 5.53 years and is considered to be a long duration. A greater generational interval is observed for the sire-daughter genetic pathway with 6.07 years and the sire-son with 6.06 years, while the lowest value is observed in the dam-son pathway with 4.73 years. The highest value of generational interval is because the reproductive age of the parents starts from 3 to 4 years of age. The average value of the generational interval obtained in Suri alpacas from Quimsachata Center is similar to the values reported in Huacaya alpacas of (5.53 years) (Vilela and Asparrin, 2013). The population of Huacaya alpacas from Quimasacha Center is 5.20 years, also similar to the value obtained in Suri alpacas (Mamani, 2013). In the analysis of the genetic structure of populations, a fundamental aspect constitutes the optimization of the generation interval for use in genetic improvement programs, since very long intervals decrease the annual genetic gain for any productive character that is subjected to selection. Bijma and Woolliams. (1999) describe that due to selection, the offspring of young parents have higher than average genetic value and that the long-term genetic contributions of the younger age classes would be higher than expected from the class distribution and the age of the parents; and the generation interval would be shorter than the average age of the parents at the birth of their offspring.
Table 2: Generation intervals (GI, in years) of the Suri alpaca population from Quimsachata Cen
| Pathway | Number | GI (year) | Standard Deviation | Standard Error |
| Sire-Son | 29 | 6.06 | 1.80 | 0.33 |
| Sire-Daughter | 108 | 6.07 | 1.82 | 0.34 |
| Dam-Son | 46 | 4.73 | 1.76 | 0.33 |
| Dam-Daughter | 168 | 5.31 | 1.98 | 0.37 |
| Total | 351 | 5.53 | 1.94 |
0.10 |
Pedigree completeness degree
The Pedigree completeness degree of the pedigree of the Suri alpaca population of the Quimsachata Center is shown in Figure 4. More information was obtained through the dam; the dam was known in 72.07% of the cases and both parents in 46.0% of cases. In the next generation of grandparents, the same trend was observed. The maternal grandam presented more information with 33.3% compared to the maternal grandsire who only reached 21.63%. Similarly, the paternal grandam yielded information in 17.33% of the cases, and the paternal grandsire with 12.07%. In the next generation the great-grandparents, this proportion was maintained with more information through the maternal line.
These results were similar to the evaluation of the structure of the degree of pedigree completeness in llamas of the Quimsachata Center for the same period from 1993 to 2014 (Mamani, 2013), indicating that through the maternal route there was more information with 83.95% of the
cases and for the paternal route with 65.88% of cases. More information on maternal pedigree in Suri alpacas from Quimsachata Center could be due to the fact that dams are registered with their offspring at birth. While the paternal information is verified in mating records. A high percentage of alpacas had no information about the maternal or paternal way. This is because animals used to found the population in the Quimsachata Center had no genealogical information. Similar results were also obtained by Vilela and Asparrin (2013) for sires (69%) and dams (80.32%) of Huacaya alpaca from the Mallkini farm in the Puno region.
CONCLUSIONS
There was an increase in the population of Suri alpacas from 2008 to 2013. Also, there was a greater number of offspring identified than dams from 1993 to 1997 and 2007 to 2009. The base population with at least one unknown parent was 838 alpacas and the actual population with only one unknown parent was 553 animals, so the effective numbers of founders () was 338 alpacas. alpacas. The F value of Suri alpacas was 0.06%, from 1993 to 2004, and zero from 2010 to 2012 with a higher percentage of inbreeding in 2009, 2013 and 2015. The AR was 0.40% with a continuous increase from 1993. The number of ancestors that contributed effectively to the reference population was 288 animals. The average generation inter-val for Suri alpacas was 5.53 years, with the highest value observed for the sire-daughter and sire-son gametic path-ways. The degree of depth of pedigree was greater for maternal pathway with 72.07%. The paternal pathway was 46.0%. This trend was the same for all generations.
ACKNOWLEDGMENTS
We appreciate the collaboration of personal staff of Centro de Investigación y Producción Quimsachata del INIA, Illpa Puno, Perú for supplying the records used in this study.
CONFLICT OF INTEREST
The authors declare that there is no any conflict of interest for this publication.
NOVELTY STATEMENT
The novelty of the paper is the estimation of population structure parameters in Suri alpacas from Quimsachata Center.
AUTHOR’S CONTRIBUTION
Ali William Canaza-Cayo; Writing of Original draft, Writing, Review and Editing. Francisco Halley Rodriguez Huanca, Abigail de la Cruz; Formal análisis, Research. Roberto Gallegos Acero, Rubén Mamani Cato, Júlio Sílvio de Sousa Bueno Filho; Writing, Review and Editing.
REFERENCES
Agung PP, Saputra F, Septian WA, Syamsul M, Zein A (2016). Study of genetic diversity among Simmental cross cattle in West Sumatra based on microsatellite markers, Asian Australas. J. Anim. Sci., 29: 176-183. https://doi.org/10.5713/ajas.15.0155.
Bijma P, Woolliams JA (1999). Prediction of genetic contributions and generation intervals in populations with overlapping generations under selection. Genetics., 151(3):1197-210. https://doi.org/10.1093/genetics/151.3.1197.PMID: 10049935; PMCID: PMC1460515.
Borges A, Mendes C, Souza P, Santos L, Pagung D, Carrillo J, Martins FR (2013). Population structure of Nellore cattle in northeastern Brazil, R. Bras. Zootec., 42: 639-644. https://doi.org/10.1590/S1516-35982013000900005
Calderon M, More MJ, Gutierrez GA, Ponce de León FA (2021). Development of a 76K alpaca (Vicugna pacos) single nucleotide polymorphisms (SNPs) microarray. Genes, 12(2): 291. https://doi.org/10.3390/genes12020291
Cervantes I, Goyache F, Molina A, Valera M, Gutiérrez J P (2011). Estimation of effective population size from the rate of coancestry in pedigreed populations. J. Anim. Breed. Genet., 128(1): 56-63. https://doi.org/10.1111/j.1439-0388.2010.00881.x.
Cenagro - Censo Nacional Agropecuario (2012). In CENAGRO Resultados Definitivos: IV Censo Nacional Agropecuario-2012; Instituto Nacional de Estadística e Informática (INEI): Julio, Perú, 2013; Volume 63, p. 18. Available online: https://sinia.minam.gob.pe/documentos/resultados-definitivos-iv-censo-nacional-agropecuario-2012-0 (accessed on 01 october 2022).
Gutiérrez JP, Goyache F (2005). A note on ENDOG: a computer program for analysis pedigree information. J. Anim. Breed. Genet. Sel. Evol., 35: 43-64. https://doi.org/10.1111/j.1439-0388.2005.00512.x.
Leroy G, Mary-Huard T, Verrie, E, Danvy S, Charvolin E, Danchin-Burge C (2013). Methods to estimate effective population size using pedigree data: Examples in dog, sheep, cattle and horse. Genet. Sel. Evol., 45(1): 1-10. https://doi.org/10.1186/1297-9686-45-1
Mader C, Hölzl S, Heck K, Reindel M, Isla J (2018). The llama’s share: Highland origins of camelids during the Late Paracas period (370 to 200 BCE) in south Peru demonstrated by strontium isotope analysis. J. Archaeol. Sci. Rep., 20: 257-270. https://doi.org/10.1016/j.jasrep.2018.04.032
Malhado CHM, Carneiro PLS, Malhado ACM, Martins Filho R, Bozzi R, Ladle RJ (2010). Genetic improvement and population structure of the Nelore breed in Northern Brazil, Pesqui. Agropecu. Bras., 45: 1109-1116. https://doi.org/10.1590/S0100-204X2010001000009
Mamani R, Gallegos R, Huanca T, Gutiérrez JP (2016). Estructura genética de la población de llamas (Lama glama) del Banco de Germoplasma del Instituto Nacional de Innovación Agraria. Rev. Investig. Altoandin., 18: 55-60.
Mamani G (2013). Estructura genética poblacional y tendencia genética de peso vivo al nacimiento en alpacas del banco de germoplasma de Quimsachata INIA-Puno. Tesis de maestría. Universidad Nacional Agraria La Molina. Lima. Perú.
McDonald BA, Linde C (2002) Pathogen population genetics, evolutionary potential, and durable resistance. Annu. Rev. Phytopathol., 40:349-379. https://doi.org/10.1146/annurev.phyto.40.120501.101443
Neuwissen T, Luo Z (1992). Computing inbreeding coefficients in large populations. Genet. Sel. Evol., 24: 305-313. https://doi.org/10.1186/1297-9686-24-4-305
Quaas RL (1976). Computing the diagonal elements of a large numerator relationship matrix. Biometrics., 32: 949-953.
Snider SB, Brimlow JN (2013). An Introduction to Population Growth. Nat. Sci. Educ., 4(4):3.
Stefansson TS, Serenius M, Hallsson JH (2012). The genetic diversity of Icelandic populations of two barley leaf pathogens, Rhynchosporium commune and Pyrenophora teres. Eur. J. Plant Pathol., 134(1): 167-180. https://doi.org/10.1007/s10658-012-9974-8
Wang J, Santiago E, Caballero A (2016). Prediction and estimation of effective population size. Heredity, 117: 193–206. https://doi.org/10.1038/hdy.2016.43.
To share on other social networks, click on any share button. What are these?