

Genetic Diversity, Population Structure and Demographic History of Brandt and Long Eared Hedgehogs in Iran


Genetic Diversity, Population Structure and Demographic History of Brandt and Long Eared Hedgehogs in Iran
Ehsan Kashani1, Hamid Reza Rezaei2*, Morteza Naderi3 and Nematolah Khorasani4

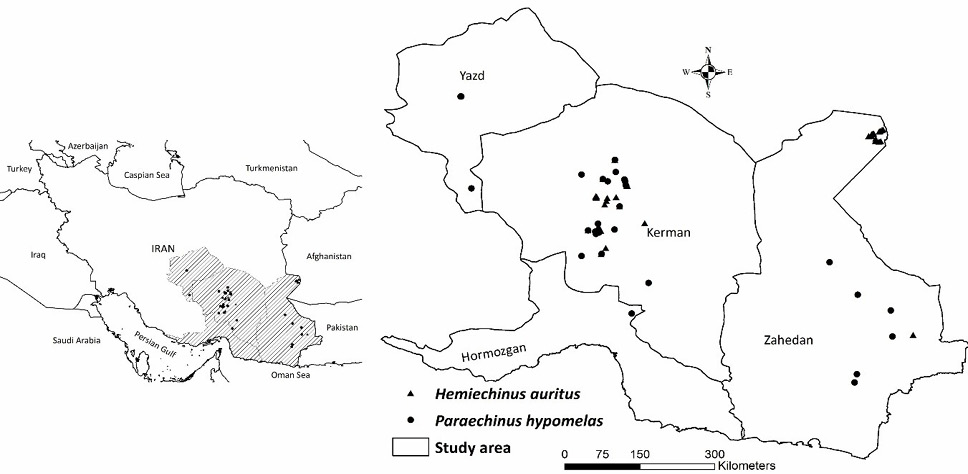
Geographical location of the samples of P. hypomelas, H. auritus.

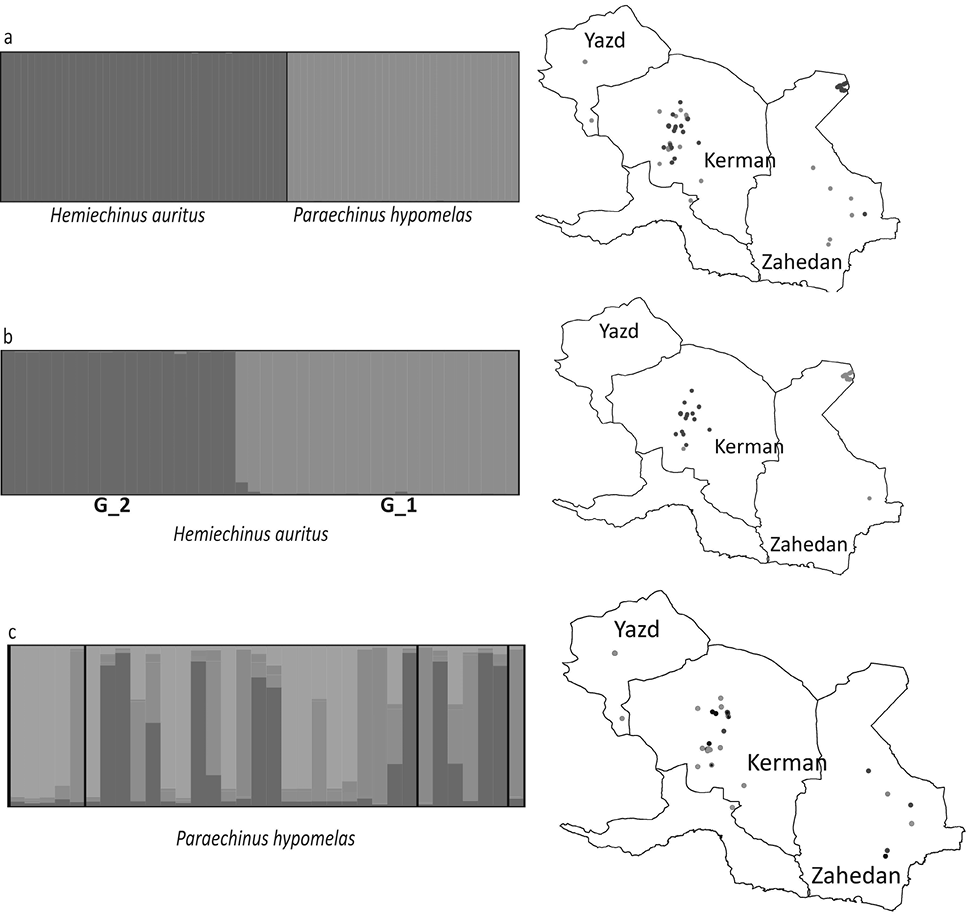
Evaluation of genetic structure of two species of H. auritus (b) and H. hypomelas (c) based on Bayesian model and cytochrome b sequencing in STRUCTURE. The black spots in figure c represent admix individuals (Qi <0.8).
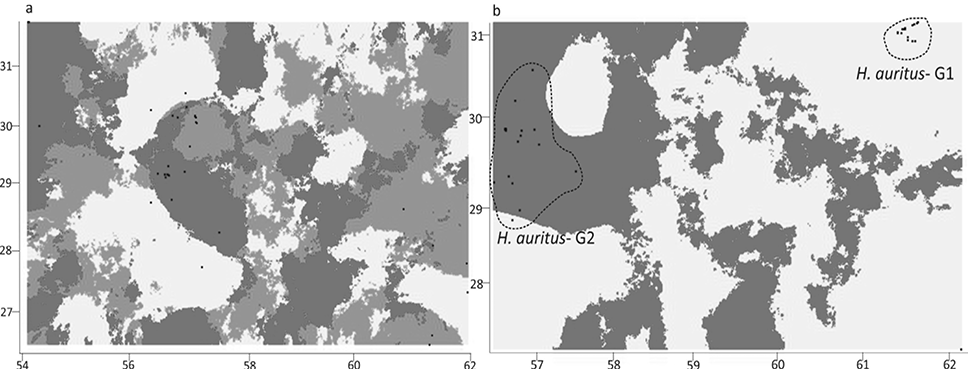
Mosaic map of spatial distribution of genetic groups in H. hypomelas (a) and H. auritus (b) based on Bayesian clustering algorithm in Geneland. The black spots indicate the geographic location of the samples.

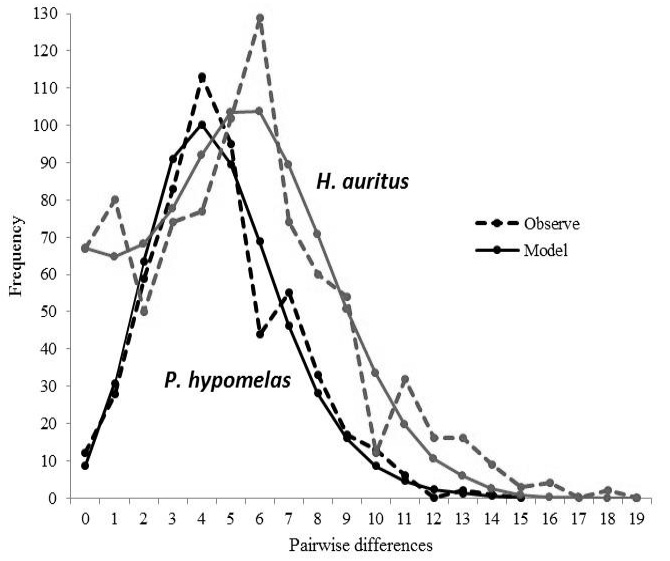
The observed pairwise mismatch distribution of mtDNA (cyt b) in H. auritus (black) and P. hypomelas (red) as compared to the expected distribution based on a model of population expansion.
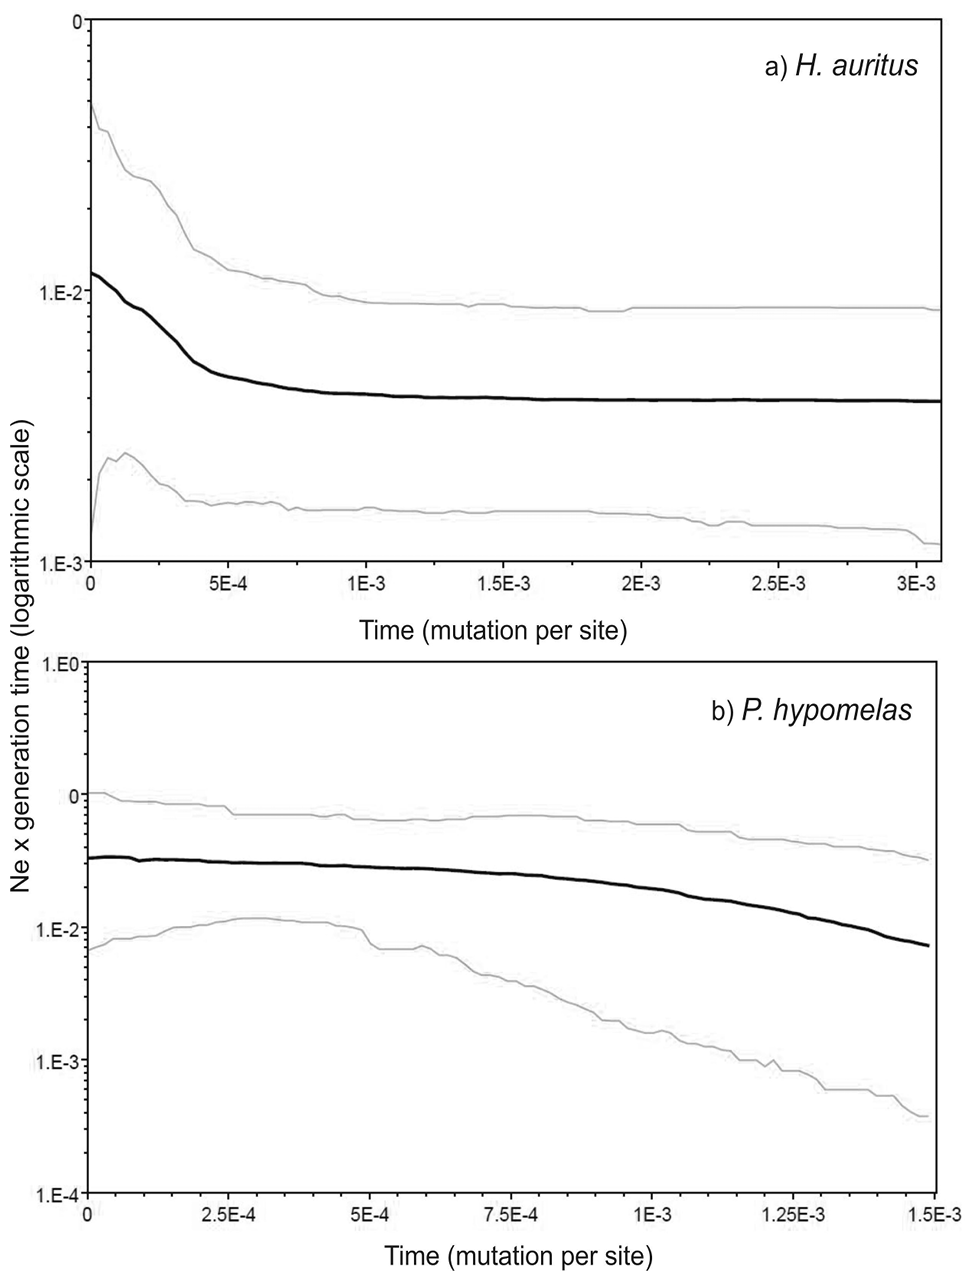
Bayesian skyline plots showing changes in effective population size based on partial sequences of cytochrome b for H. auritus (a) and P. hypomelas (b). The Black lines depicts the mean Ne estimation and the blue lines represents the highest 95 % posterior intervals.
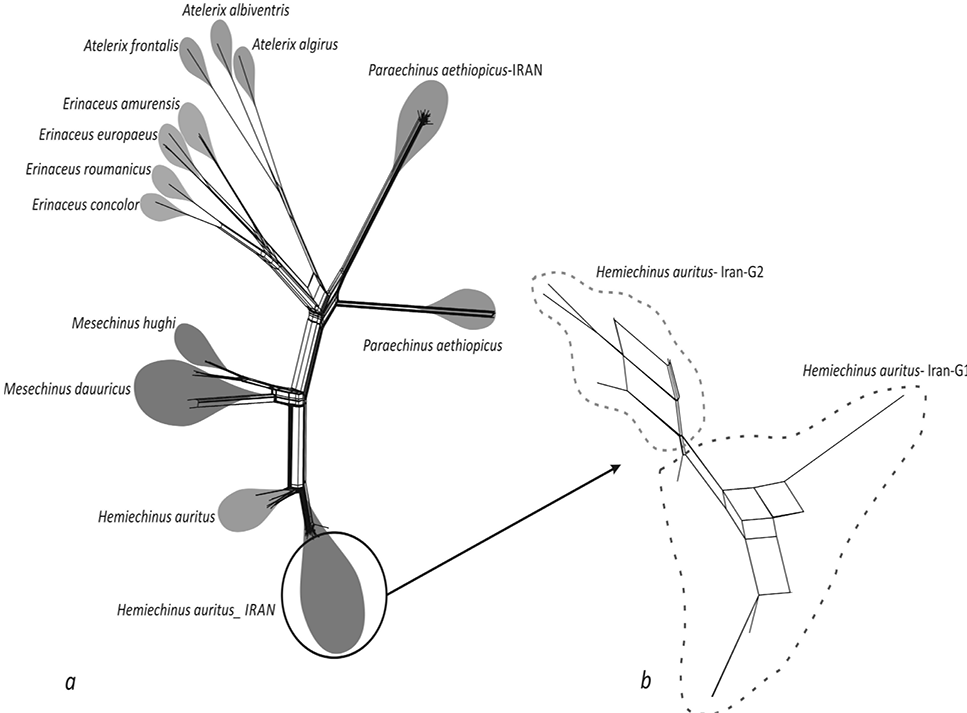
Haplotype network of Erinaceinae subfamily in the world (a) and H. auritus in Iran (b) using neighbor network and uncorrected genetic distance in the SPLITSTREE software.

Phylogeny tree of Erinaceinae subfamily using Bayesian method. The numbers on the lines show the posterior probability derived from the Bayesian tree.


