Genetic Characterization Of Avian Influenza Virus (H9N2) Hemagglutinin Genes In Broiler Chickens Of Luxor Governorate, Egypt
Genetic Characterization Of Avian Influenza Virus (H9N2) Hemagglutinin Genes In Broiler Chickens Of Luxor Governorate, Egypt
Mohamed. E. Taha1, Mohamed S. Ahmed2, Ahmed I. Ahmed2, Amany Adel3, Salama Rehab4,5*, Nabila Osman2**
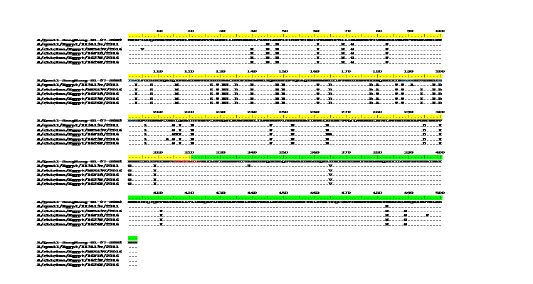
Alignment of HA amino acid sequences for the isolated strains in comparison to the reference one in GenBank using “A-Quail-HongKong-G1-97”, A/quail/Egypt/113413v/2011 and A/chicken/Egypt/ME543v/2016. HA1 region of H9 (AIV) was highlighted as yellow color, encoding amino acids (1-320). While HA2 region of H9 (AIV) was highlighted as green color, encoding amino acids (321-503). Cleavage site were marked as red color, including amino acids (315 to 323). The two mutated glycosylation sites were marked as blue color, including sites (188-191), and (200-203).
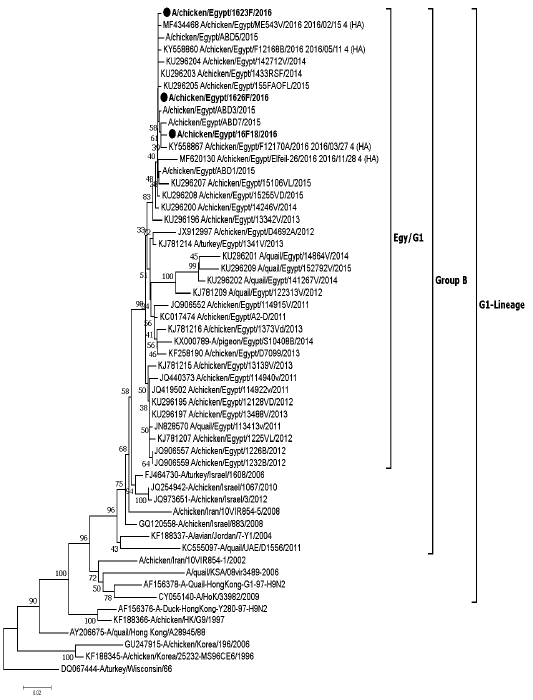
The evolutionary relationship among HA genes of A(H9N2) retrieved from GenBank database and sequences data in this study (MH734794 to MH734796) was inferred by using Neighbor Joining Estimation method based on the Kimura 2- parameter model derived from full gene sequence data. Values on branches are the percent of bootstrapping using 1,000 replicates. All positions containing gaps and missing data were trimmed. Evolutionary analyses were conducted in MEGA X software. The viruses of this study are indicated in black bold dot (●).


