
Forecasting Area and Production of Guava in Pakistan: An Econometric Analysis


Forecasting Area and Production of Guava in Pakistan: An Econometric Analysis
Dilawar Khan1*, Arif Ullah2, Zainab Bibi1, Ihsan Ullah1, Muhammad Zulfiqar4 and Zafir Ullah Khan3


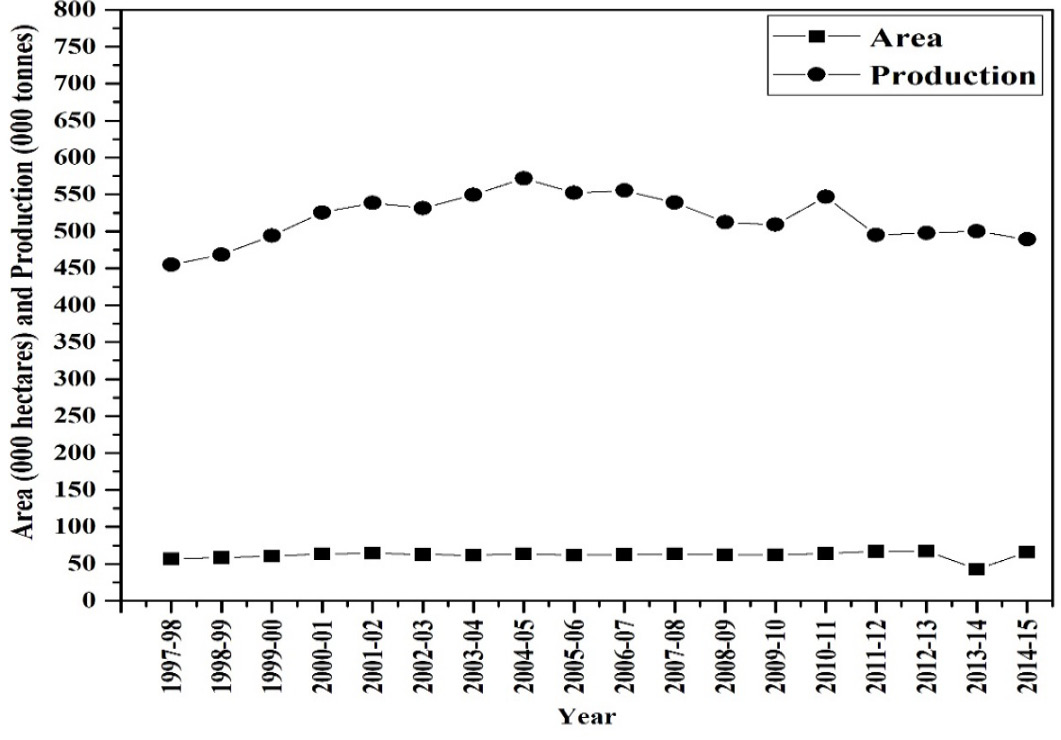
Figure 1
Trend of the variables.

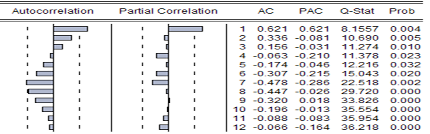
Figure 2
Correlogram for the original series of guava area.

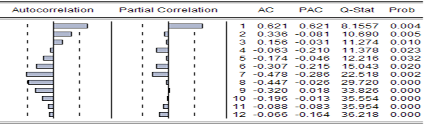
Figure 3
Correlogram for the original series of guava production.
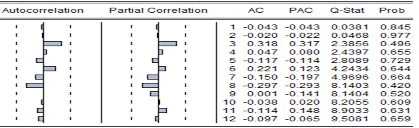
Figure 4
Correlogram for the differenced series of guava production.

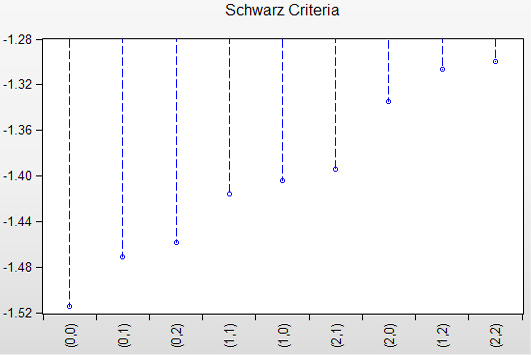
Figure 5
ARIMA criteria graph of area.
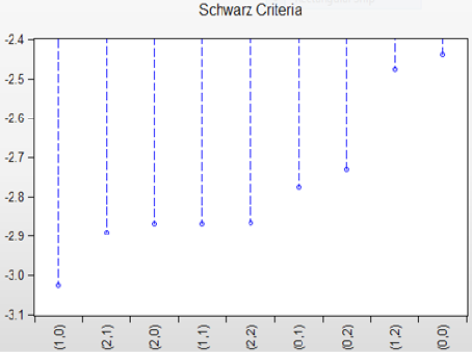
Figure 6
ARIMA criteria graph of production.
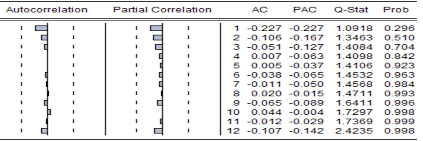
Figure 7
Correlogram for the residuals of area series.

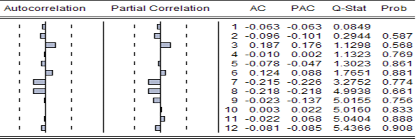
Figure 8
Correlogram for the residuals of production series.
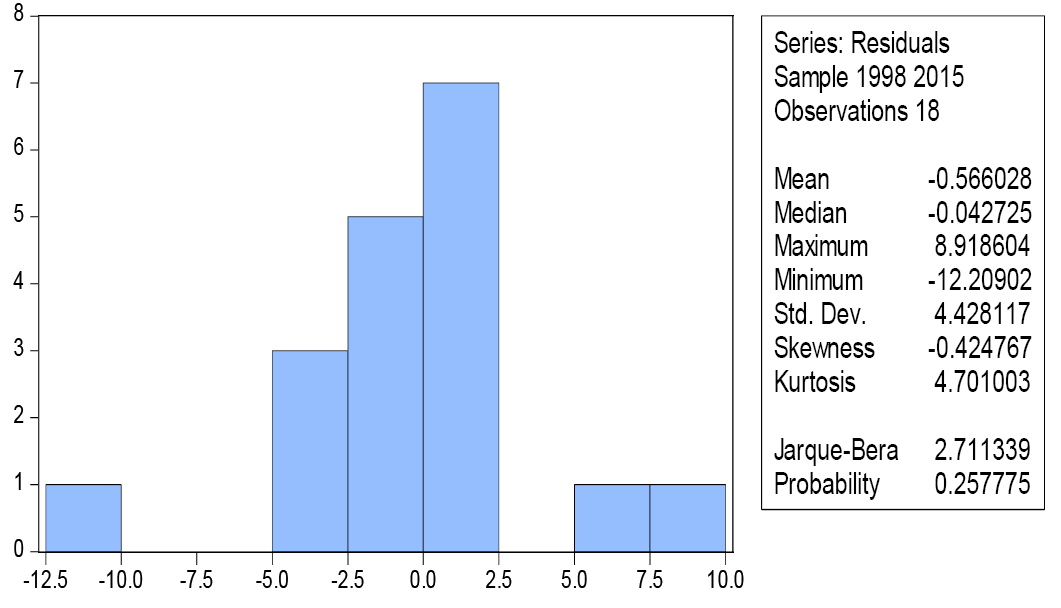
Figure 9
Normality test for guava area.

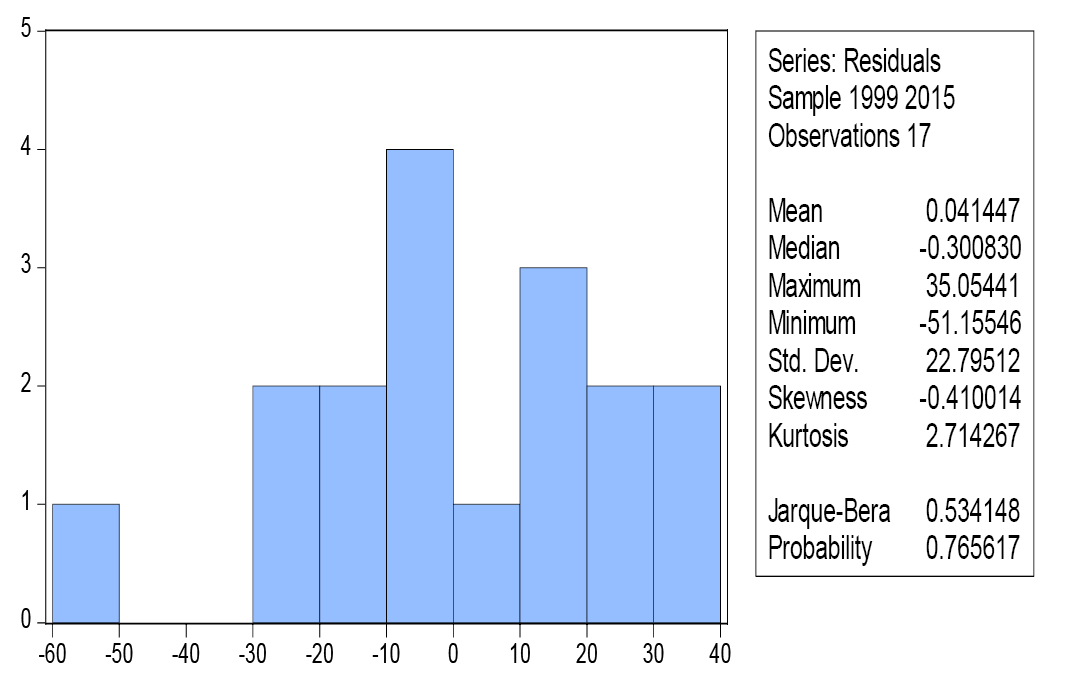
Figure 10
Normality test for guava production.

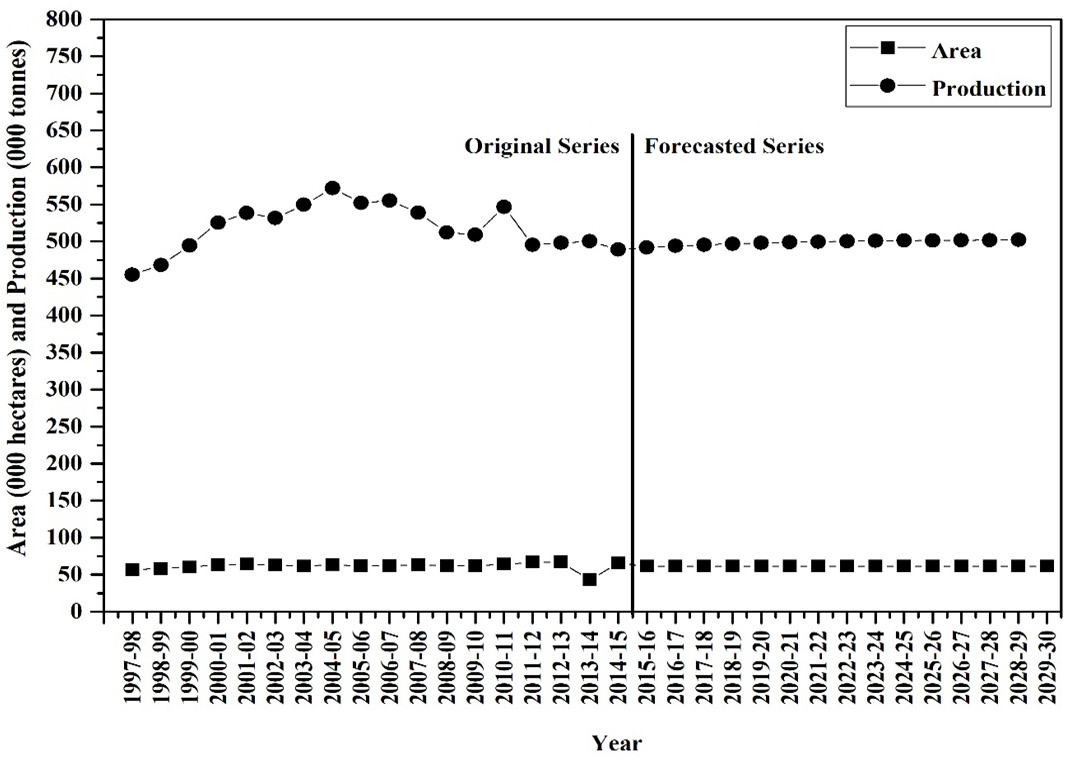
Figure 11
Forecasted area and production of guava in Pakistan.

March 2020
Vol. 36, Iss. 1, Pages 1-374


