Farmers Perceptions about Climate Change Vulnerabilities and their Adaptation Measures in District Swat
Farmers Perceptions about Climate Change Vulnerabilities and their Adaptation Measures in District Swat
Muhammad Suleman Bacha1*, Mohammad Nafees1 and Syed Adnan2
Map of the study area
Temperature variation in mean annual maximum and mean annual minimum temperature for 31-year dataset (Source: PMD Data)
Variation of mean annual prepetition in the last 31 years (1985-2015) (Source: PMD Data)
Perceived causes of climate change in the study area (Source: Primary data from interviews)
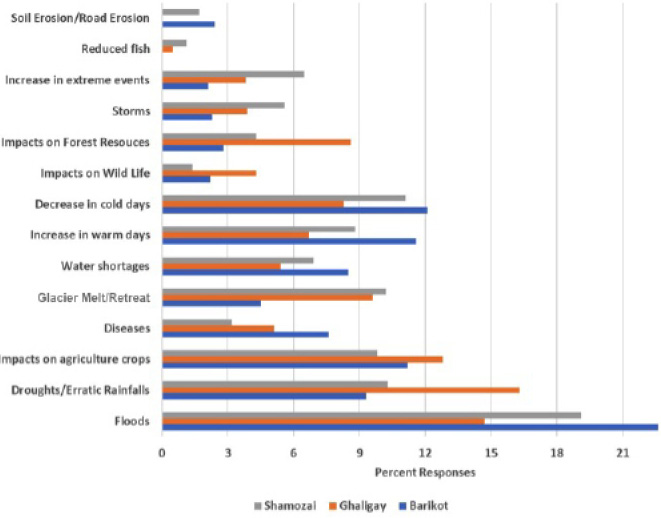
Perceived impacts of climate change in the study area (Source: Primary data from interviews)
Damages received to the farming lands in the study area (Source: Primary data from interviews)
Percentage of the crop production affected due to natural disasters in the past 10 years (Source: Primary data from interviews)
Farmer perceptions about the major problems affecting crop production in the study area (Source: Primary data from interviews)
Local adaptation and coping strategies to climate change vulnerabilities in Agriculture based livelihoods in Barikiot, Ghaligay and Shamozai UCs (Source: Primary data from interviews)


