

Expression, Characterization and Purification of Latcripin-5 from Lentinula edodes Strain C91-3 and its In Vitro Anticancer Activities


Expression, Characterization and Purification of Latcripin-5 from Lentinula edodes Strain C91-3 and its In Vitro Anticancer Activities
Akbar Hussain1, Syed Riaz ud Din1, Kavish Hasnain Khinsar1, Muhammad Noman Ramzan2, Min Huang1, Anhong Ning1, Xiaoli Wang1, Mintao Zhong1* and Bibi Nazia Murtaza3*

Structure modeling of LP-5: 3-dimemtional structure (side view at 180 degree) genrated via phyre2 using hydrolase as template (A). Secondary structure of LP-5 showing various motifs (B). Ramachandran plot validation (C).

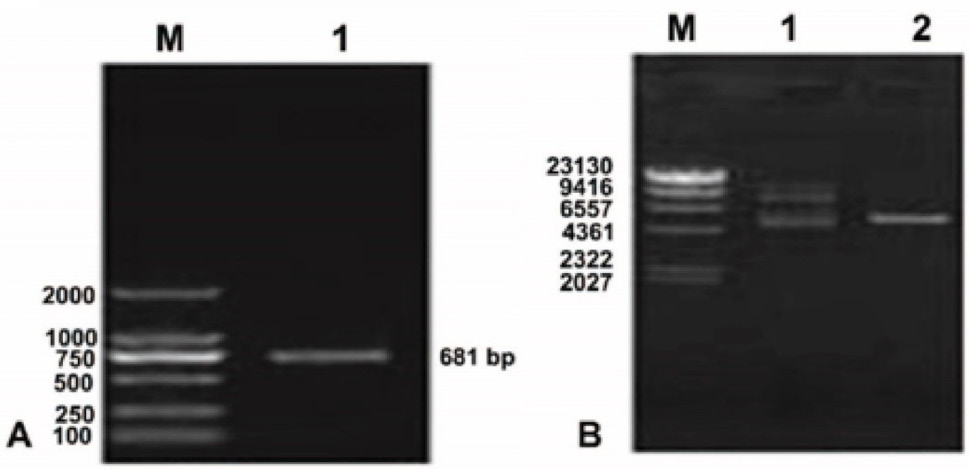
Lane 1, PCR products of LP 5-RCC1 cDNA. (B) Plasmid pET-32a(+)-LP-5 functional domain cDNA. M, DNA Marker DL8000; Lane 1, plasmid pET 32a(+) LP-5 extracted from JM109 cells; Lane 2, double restriction enzyme digestion of plasmid pET 32a(+) LP 5 RCC1 extracted from JM109 cells.
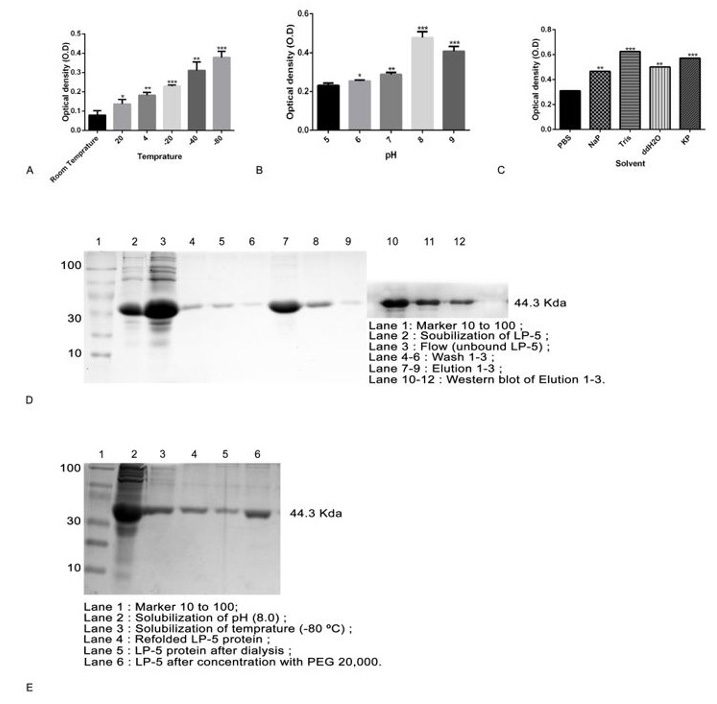
Efficient production of LP-5 protein. Effect of temperature (A), IPTG concentration (B), and induction time on LP-5 production (C). SDS-PAGE analysis of LP-5 under optimized condition (D). Statistical analysis was performed using multiple t test via GraphPad Prism 6.0 (* p < 0.05, ** p < 0. 01, and p *** < 0.001).

Effect of LP-5 on the viability and proliferation of HepG2 cells. (A) IC50 values of LP-5 against a panel of cancerous and normal cell lines were evaluated and results are expressed in three independent experiments at 48 h. (B) HepG2 cells treated with different concentration of LP-5 for 24, 48 and 72 h to determine cell viability. Results are expressed as a percentage of corresponding control (C) Cell proliferation assay performed by CCK-8, with a low dose of LP-5 at different time intervals for HepG2. Results are presented in three independent experiments (D) Morphological changes in HepG2 cell lines were observed under a phase contrast microscope after 48 h treatment with a mentioned concentration of LP-5 (0, 75, 100 and 125 g/ml) at 40x magnification.Statistical analysis was performed using multiple t test via GraphPad Prism 6.0 (* p < 0.05, ** p < 0. 01, and p *** < 0.001).
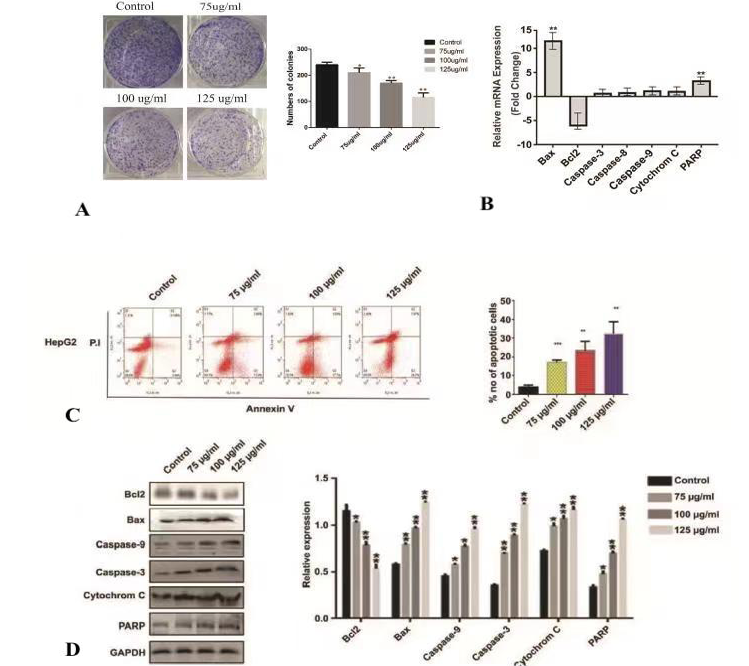
Colony formation by liver cancer cells line HepG2 treated with LP-5 (0, 75, 100 and 125 g/ml) (A). Analysis of q RT-PCR apoptosis related genes (Bax, Bcl2, caspase-3, capase-8 and caspas 9, Cytochrome-C, and PARP ) (B). Evaluation of apoptosis via flow cytometry in LP-5 treated liver cancer cells lines HepG2 dose and time dependent-manner (0, 75, 100 and 125 g/ml and 48 hours). Quadrant 2 (Q2) denotes late apoptosis; Quadrant 3 (Q3) indicate early apoptosis, while Q4 represent vialble cells (C). Evaluation of apoptosis related markers (Bax, Bcl2, caspase-3, caspase-9, Cytochrome-C and PARP) in HepG2 cells treated with LP-5 (0, 75, 100 and 125 g/ml and 48 h incubation time) (D). Statistical analysis was performed using multiple t test via GraphPad Prism 6.0 (* p < 0.05, ** p < 0. 01, and p *** < 0.001).
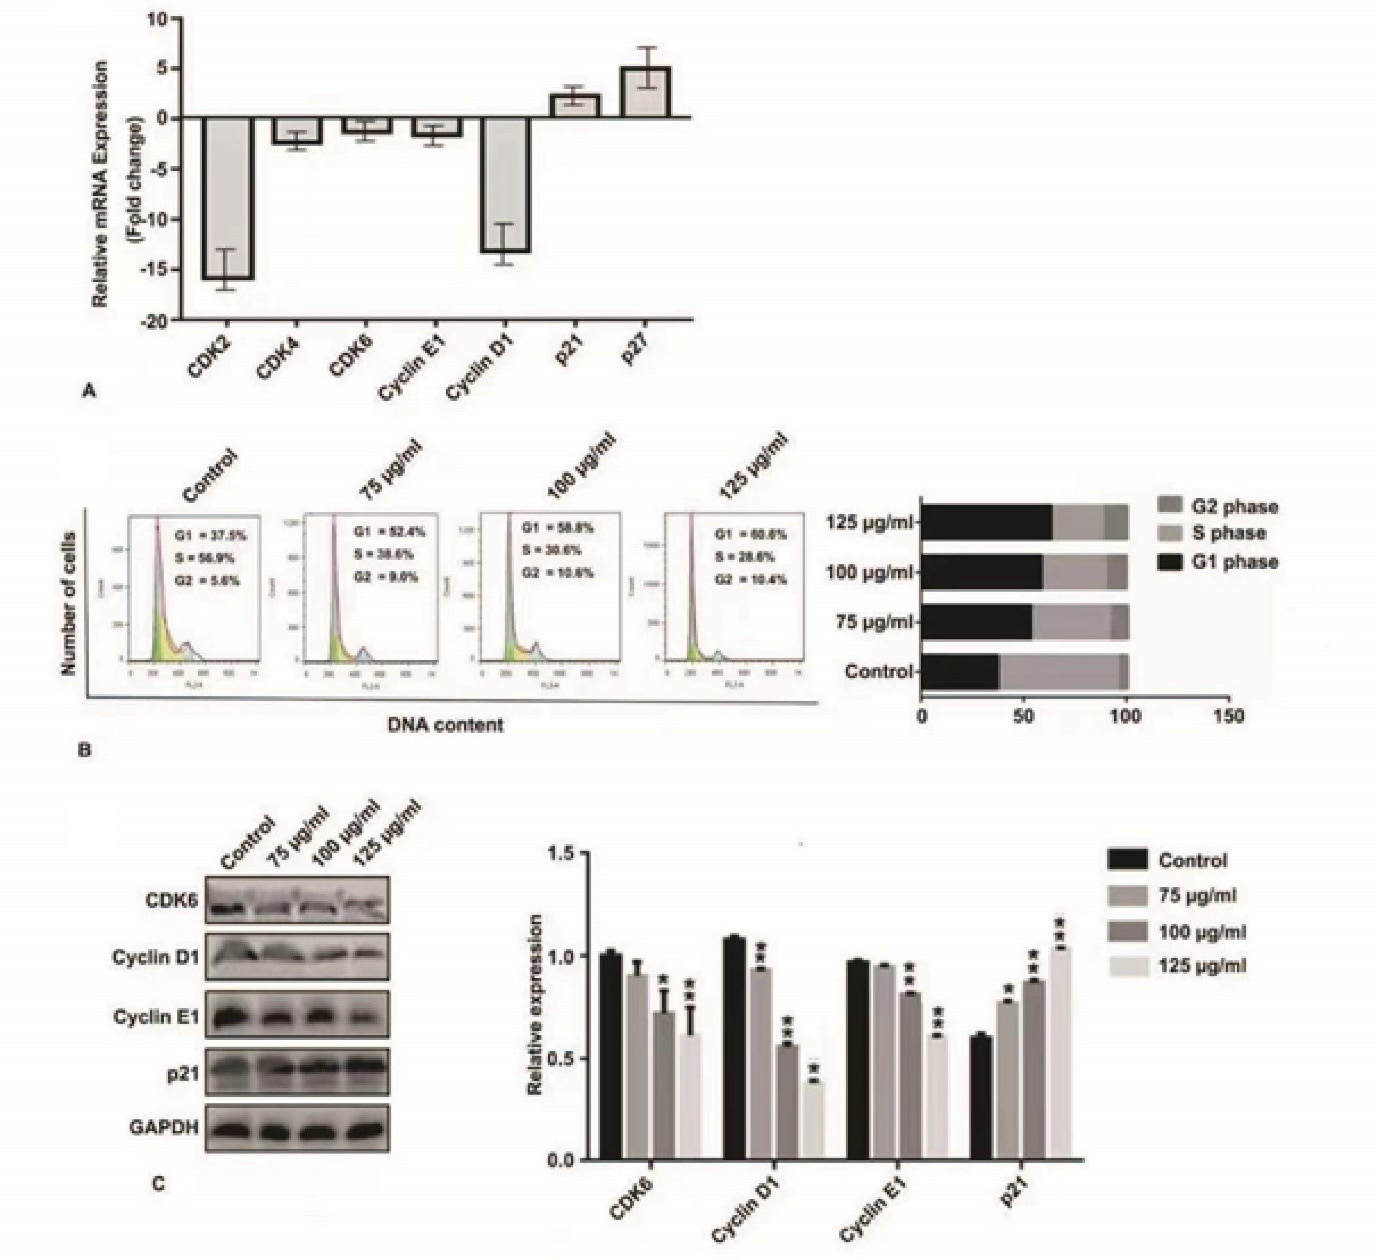
Analysis expression of q RT-PCR cell cycle releted genes (Cyclin E1, Cyclin D1, CDK6 and p21) treated HepG2 cells with LP-5 (A). Cell cycle anylasis of liver cancer cell lines HepG2 treated with LP-5 (0, 75, 100 and 125 g/ml and 48 h incubation time) (B). Detection of cell cycle related markers Cyclin-E1, Cyclin D1, CDK6 and P21 expressions in HepG2 liver cancer cells with LP-5 dose and time dependent mannaer (0, 75, 100 and 125 g/ml and 48 h incubation time) (C). Statistical analysis was performed using multiple t test via GraphPad Prism 6.0 (* p < 0.05, ** p < 0. 01, and p *** < 0.001).


