
Exploration of Polymorphism Analysis of CD18 Gene with PCR-RFLP Technique in Friesian Holstein Crossbreed Dairy Cows in Batu, East Java, Indonesia


Research Article
Exploration of Polymorphism Analysis of CD18 Gene with PCR-RFLP Technique in Friesian Holstein Crossbreed Dairy Cows in Batu, East Java, Indonesia
Tiara Widyaputri*, Aldryan Cristianto Pratama, Dian Vidiastuti, Yudit Oktanella
Faculty of Veterinary Medicine, Brawijaya University, Jl. Puncak Dieng, Kunci, Kalisongo, Dau, East Java, Indonesia, 65151
Abstract | This research aims to identify the presence of BLAD carrier alleles and determine whether the polymorphism that appears in the CD18 gene by the PCR-RFLP method is related to the BLAD carrier allele in Friesian Holstein crossbreed dairy cows. A total of 60 samples of cow’s whole blood were collected and extracted and DNA isolated. DNA amplification was carried out using primer Forward (BLAD_F) 5’-TCAACGTGACCTTCCGGAGG-3’ and Reverse (BLAD_R) 5’-CCCAGATTCTTGACGTTGAC-3’. Amplification of the CD18 gene segment on chromosome 1 exon 2 with a target length of 106bp has been successfully carried out with a success rate of 100%. RFLP analysis of NCOI cutting restriction enzymes shows that there are two bands at 66bp and 40bp. This shows that the normal allele frequency is one and the mutant allele is 0 with a heterozygous genotype frequency of 0% in the population. According to the result, the polymorphism that appears in the CD18 gene by PCR-RFLP method in all samples shows the substitution mutation type G base to C transversion and is not related to the BLAD mutation.
Keywords | Dairy cows, CD18 gene, Restriction enzyme, PCR-RFLP, Friesian Holstein crossbreed
Received | January 25, 2022; Accepted | March 01, 2022; Published | March 26, 2022
*Correspondence | Tiara Widyaputri, Faculty of Veterinary Medicine, Brawijaya University, Jl. Puncak Dieng, Kunci, Kalisongo, Dau, East Java, Indonesia, 65151; Email: [email protected]
Citation | Widyaputri T, Pratama AC, Vidiastuti D, Oktanella Y (2022). Exploration of polymorphism analysis of CD18 gene with PCR-RFLP technique in friesian holstein crossbreed dairy cows in Batu, East Java, Indonesia. Adv. Anim. Vet. Sci. 10(4):935-941.
DOI | https://dx.doi.org/10.17582/journal.aavs/2022/10.4.935.941
ISSN (Online) | 2307-8316
Copyright: 2022 by the authors. Licensee ResearchersLinks Ltd, England, UK.
This article is an open access article distributed under the terms and conditions of the Creative Commons Attribution (CC BY) license (https://creativecommons.org/licenses/by/4.0/).
INTRODUCTION
Genetic disorders are internal factors that play a role as predisposing factors for disease development in dairy cows. Genetic disorders do not have pathognomonic symptoms, so when a diagnosis is made, it will lead to infectious disease even though the disorder arises due to genetic disorders. One of the genetic abnormalities in dairy cows that can be found is Bovine leukocyte adhesion deficiency (BLAD) (Dagong et al., 2018).
Bovine leukocyte adhesion deficiency (BLAD) is a disease syndrome that occurs due to decreased expression of adhesion molecules in neutrophils called β-integrin, a protein complex consisting of CD11/ CD18 proteins (structurally and functionally related to glycoprotein). Integrin is directly involved in the mechanism of diapedesis and the transfer of neutrophils out of blood vessels into the tissues to fight and kill pathogenic microorganisms that enter the body. The protein helps neutrophils to move to the site of inflammation. In humans also found the same case, namely leukocyte adhesion deficiency (LAD), and the findings in humans succeeded in helping to reveal the molecular basis of the same deficiency in cattle, which is caused by mutations in the CD18 gene that will interact with the CD11 gene to encode β2 integrin subunit (Dagong et al., 2018).
The mutation is a substitution of the base adenine (A) to the base of guanine (G) in exon 2 of the CD18 gene that causes changes in the amino acid glycine to aspartic acid (in the polypeptide position D128G). Only mutations in the D128G polypeptide can cause CD18 gene expression disorders, while at some other point, mutations do not affect. The decrease in integrin β2 molecules expressed in animal leukocytes causes the animal infected with the disease to experience granulocytopathy syndrome (Kumar and Sharma, 2009).
BLAD was first known to occur in North America and then spread and spread to several other countries. The bull is known to have an essential role as a source of mutant genes that cause BLAD. At first, the BLAD came from a superior bull named Carlin-M Ivanhoe Bell (originally from North America). Bell inherited the mutant gene from his grandfather, a superior male named Osborndale Ivanhoe (born in 1952), who also passed on the mutant gene to the male parent of Bell named Pennstate Ivanhoe Star (born in 1963).
The spread of BLAD to various countries worldwide is also likely to be influenced by the use of superior bull cement products for artificial insemination distributed to these countries. BLAD is a recessive disease that will harm calves and continue to the next hereditary if there is no further research related to identifying specific genes and the detection of animal carriers to prevent the spread of BLAD (Farajallah et al., 2007; Kumar and Sharma, 2009).
Identification of specific genes and detection of BLAD carrier animals can be made by restriction fragment length polymorphism analysis of polymerase chain reaction (PCR-RFLP) methods. This method is very appropriate because the BLAD mutation point is known. The selection of the appropriate restriction enzyme will result in cuts at specific sites if there are mutations (BLAD specific) in the sample. Through these cuts, we can identify the gene alleles in the sample. Besides, the PCR-RFLP method is relatively inexpensive and easy to do without the need for expensive instruments and specialized training for laboratory assistants (Rasmussen, 2012).
The use of bulls semen, a carrier animal, for artificial insemination will ultimately increase the prevalence. The prevalence of career animals can also increase due to the number of female dairy cows in a population that is quite large and can produce milk on a large scale. This causes breeders to continue to maintain the calving interval from female brooders and utilize artificial insemination. The females will give birth to young puppies and even mutants if the IB semen used comes from career bulls.
The prevalence of career animals will increase if the population of dairy cows has many career cows. If left unchecked, this will cause a decrease in the genetic quality and phenotype of calves, a decrease in production, economic losses, and the failure of livestock breeding programs. Therefore, detecting BLAD mutations in Friesian Holstein crossbreed dairy cows is important (Farajallah et al., 2007). Moreover, there is a need for studies on the presence of heterozygous alleles in carrier cows to prevent the spread of carrier cows and prevent the emergence of BLAD syndrome and disease that is detrimental to cattle farming, especially dairy cows in Indonesia.
Calculation of the frequency of BLAD carrier alleles prevalence in Indonesia has been carried out in several regions such as Baturaden, Lembang, and Enrekang using PCR-RFLP technique with haeIII and TaqI restriction enzym. In this study, we used NCOI restriction enzyme to develop alternative options for the use of restriction enzymes compared to previous research (Dagong et al., 2018; Farajallah et al., 2007).
MATERIALS AND METHODS
Materials
Primer Forward (BLAD_F) 5’-TCA ACG TGA CCT TCC GGA GG-3’ and Reverse (BLAD_R) 5’-CCC AGA TTC TTG ACG TTG AC-3’, PCR (DreamTaq Green PCR Master Mix Thermo Fisher Scientific Inc., Waltham, Massachusetts), Agarose 2% (Vivantis Technologies Sdn. Bhd., Shah Alam, Malaysia), green gel staining, NCOI restriction enzymes (Thermo Fisher Scientific Inc., Waltham, Massachusetts), Blood DNA Preparation Kit (Jena Bioscience Corp, Thuringia, Germany), 100bp DNA ladder, Thermal Cycler (T100 Bio-RAD, Herculer, California), centrifuges (Hermle Z216MK, Hermle AG, Gosheim, Germany), large and small Eppendorf tubes, gel documentation (Gel-Doc EZ, Bio-RAD, Hercules, California), micropipets and tips, electrophoresis chambers (Bio-RAD, Herculer, California), analytical balance, EDTA vacutainer, venoject needle, rotator or vortex, incubator, microwave, PCR tube, 1.5 µl Microtube, Erlenmeyer tube (Farajallah et al., 2007).
Sample collection
Blood collection in Friesian Holstein crossbreed dairy cows used as a source of DNA was carried out by punching in the coccygeal vein at the base of the lower tail (near the anus) with a vacutainer needle 22G. 3-5 mL of blood volume was taken from each cow and put inside a venoject tube containing EDTA. Then the blood sample is stored at -20ºC (Herodita, 2009; Meydan et al., 2010).
DNA extraction
DNA extraction and isolation was carried out using a Blood DNA Preparation Kit (Jena Bioscience Corp.). Prepared 1.5 ml microtube as many as samples, then added 450 ul RBC lysis solution and 150 ul blood samples. The mixture is homogeneous and incubated at room temperature for 5 minutes, then centrifuged at 14,000 rpm for 30 seconds to form a white precipitate. A supernatant fluid that is formed is removed and resuspended by vortex, and 150 ul of cell lysis solution is added. The next step is to carry out protein precipitation by adding a 50 ul protein precipitation solution and then vortex it and centrifuging 14,000 rpm for 60 seconds (Rahayu et al., 2006).
The centrifugation results were incubated at -22ºC for 10 minutes and then recentrifuged. After that, a clean microtube is prepared as many as the number of samples added with 150 ul isopropanol, then the supernatant liquid is added from the microtube beforehand and homogenized centrifuged at 14,000 rpm for 60 seconds until a small deposit was seen. Then the supernatant is drained and added to the washing buffer, then centrifuged and drained again. The next step is to add 50 ul of DNA hydration solution, then vortex at medium speed and incubated for 30 minutes at 65ºC and stored at 4ºC (Rahayu et al., 2006).
DNA amplification
CD18 gene amplification was carried out in vitro through the PCR DNA technique using the forward 5´-TCA ACG TGA CCT TCC GGA GG-3´ and reverse 5´-CCC AGA TTC TTG ACG TTG AC-3´ primers as the primers used by Zsolnai and Fesus (1996). The PCR reaction was carried out in a 12 µl volume consisting of a 5 ul mix PCR, 2.5 ul ddH2O, 2.5 ul PFH female DNA samples, and 1 for one forward and reverse primer. PCR reaction takes place in a Biorad Thermal Cycler machine with the conditions set that is predenaturation (for 5 minutes at 94ºC) followed by 30 cycles (for 1 minute denaturation at 94ºC, primary attachment or annealing for 1 minute at 57ºC, and extension DNA is the elongation of the primer or polymerase at 72ºC for 1 minute), and ends with the extension of the final stage of DNA for 10 minutes at 72ºC (Herodita, 2009; Rahayu et al., 2006).
Detection of mutation (RFLP)
The results of amplifying samples with mutations will be truncated at 128 amino acids (D128G), causing the substitution of aspartic acid into glycine. Whereas NCOI enzymes will not cut off normal samples because they do not have a cutting site, NCOI can cut samples if mutations occur outside mutations from BLAD (polymorphism). 10 ul PCR products were mixed with 2 ul Universal Buffer, 1 ul NCOI enzyme, and 18 ul nuclease-free water. The mixture was incubated at 37ºC for 2 hours (Rahayu et al., 2006; Kaya et al., 2016).
Allele frequency analysis
The frequency of mutant alleles is analyzed by subtracting one from the normal number of alleles. Normal alleles are calculated from twice the normal homozygote plus the number of career samples then divided by twice the total number of samples amplified. The formula used uses Hardy-Weinberg’s law as follows (Ribeiro et al., 2000; Nasreen et al., 2009).
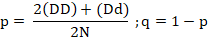
Where; p= normal allele frequency; q= mutant / BLAD allele frequency; DD= normal number of cattle; Dd= number of BLAD carrier cattle; Dd= number of mutants/ suffering from BLAD; N= the total number of samples.
After that, electrophoresis results were grouped into three groups: Normal (homozygous dominant, DD), career (heterozygous, Dd), and suffer from BLAD/ mutant (recessive homozygous, dd) (Herodita, 2009).
RESULTS AND DISCUSSION
Qualitative and quantitative test of DNA extraction
The extracted DNA isolates were then subjected to a qualitative DNA test with 1% electrophoresis and obtained the results of a band visualization of more than 10,000 bp in all samples (Figure 1). The extraction results of 60 samples of PFH female cows obtained by visualization results with electrophoresis in the sample showed the formation of bands with different thicknesses but no visible spread of bands. This indicates that the DNA in the blood is extracted properly. Band visualization of more than 10,000 bp corresponds to the size of the whole blood genome (Gong and Li, 2014).
The qualitative test of DNA isolates has the principle that a high concentration of DNA in a sample will produce a thick, non-spreading DNA band and the total extracted DNA is intact, while a DNA isolate sample that has a low DNA concentration causes the formation of thin and diffuse DNA bands. The spread of bands is caused by the presence of bonds between DNA molecules which are broken during the extraction process which cause the DNA to be cut into several small pieces. The broken bonds between DNA molecules are caused by excessive physical movement during the pipetting process, centrifugation, and can also be caused by too high temperatures and the activity of certain chemicals (Harahap, 2017).
The extracted DNA isolates were also tested quantitatively with a spectrophotometer. Spectrophotometer test results showed that the entire sample has a DNA concentration in the range of 7-60 ng/ µl and purity levels ranging from 0.56 to 1.82 (Table 1). Quantitative tests of DNA isolates were carried out by the spectrophotometer method. The test results obtained a purity of 0.56-1.82. The spectrophotometer method uses light with a specific wavelength to see the absorption of light by certain molecules. UV light with a wavelength of 260 nm can be absorbed by ds-DNA, whereas light with a wavelength of 280 nm can be absorbed by protein or phenol contaminants. The difference in UV light absorption will be used to measure DNA purity by calculating the absorbance value of 260 nm divided by the absorbance value of 280 (Å260/ Å280) and the DNA purity value ranging between 1.8-2.0, where if the purity value <1.8 revealed the presence of protein contamination and if the value purity> 2.0 revealed the presence of RNA contamination. The resulting DNA concentration ranged from 7-60 ng / µl. A minimum DNA concentration of 25 ng / µl is required (Ningsih et al., 2017; Khade et al., 2014).
Table 1: Spectrophotometer results from DNA isolates.
|
No |
Sample code |
Abs value 260/230 |
Abs value 260/280 |
Cons (ng/ul) |
|
1 |
BT 38 |
1.21 |
1.14 |
19.91 |
|
2 |
BT 29 |
1.11 |
1.38 |
7.95 |
|
3 |
BT 23 |
1.72 |
1.61 |
53.31 |
|
4 |
BT 31a |
0.85 |
0.86 |
11.79 |
|
5 |
BT 17 |
0.94 |
1.05 |
20.45 |
|
6 |
BT 16 |
1.58 |
0.86 |
49.13 |
|
7 |
BT 34 |
1.74 |
1.42 |
34.91 |
|
8 |
BT 37 |
1.38 |
1.21 |
10.82 |
|
9 |
BT 35 |
1.57 |
1.56 |
24.05 |
|
10 |
BT 39 |
1.43 |
1.42 |
32.03 |
Note: Cons = DNA Concentration, Abs value 260/230 = Absorbance value of DNA purity level against Polysaccharide contaminants, Abs value 260/280 = Absorbance value of DNA purity level against protein contaminants.
The results of total DNA extraction in several samples in this study showed concentrations below 25 ng/ µl. The sample is still amplified because the samples with DNA concentrations below 25 ng/ µl will still show the quality of the band when electrophoresed. However, the resulting band will be thinner but can still be analyzed as long as there is no smear in the visualization results (Ningsih et al., 2017).
Amplification of CD18 genes by PCR method dan gel electrophoresis
CD18 gene amplification in PCR process with Biorad Thermal cycler using a primer consisting of a forward primer (BLAD_F) 5’- TCA ACG TGA CCT TCC GGA GG-3 ‘and reverse (BLAD_R) 5’- CCC AGA TTC TTG ACG TTG AC-3 ‘is the same primer used by Zsolnai and Fesus (1996). Electrophoresis was carried out using 2% agarose gel electrophoresis and a 100 bp DNA ladder marker. Visualization results showed that 60 samples formed 106 bp band/band following the primary target, which indicated the sample was very well amplified even though the band thickness was not too identical (can be seen in Figure 2) (Farajallah et al., 2007).
Restriction fragment length polymorphism CD18 gene
The amplification results were then carried out by RFLP and the RFLP results showed similarity in 60 samples. 60 samples showed two band fragments at 66 bp and 40 bp (Table 2). The results of these restrictions indicate the presence of a site cut by the NCOI restriction enzyme in the amplified CD18 gene sequence (Figure 3).
Commonly, in gene sequences that have one cut point to a restriction enzyme will produce two pieces of DNA band if the individual is dominant homozygous (DD) (66bp and 40bp size), three bands (66bp, 40bp, and 106bp) if the individual is heterozygous (Dd), and if BLAD mutations or recessive homozygous individuals (dd) occurs then no band is found. RFLP results on 60 samples showed the finding of 2 band fragments. This indicates that 60 samples are dominant homozygous or normal cattle that do not carry the BLAD allele (Akyus and Ertugrul, 2006; Nasrulloh et al., 2020).
Table 2: RFLP with NCOI restriction enzyme result.
|
No |
Sample code |
Band fragment |
Note |
|
1 |
BT 38 |
66bp and 40bp |
Dominant Homozygous |
|
2 |
BT 29 |
66bp and 40bp |
Dominant Homozygous |
|
3 |
BT 23 |
66bp and 40bp |
Dominant Homozygous |
|
4 |
BT 31a |
66bp and 40bp |
Dominant Homozygous |
|
5 |
BT 17 |
66bp and 40bp |
Dominant Homozygous |
|
6 |
BT 16 |
66bp and 40bp |
Dominant Homozygous |
|
7 |
BT 34 |
66bp and 40bp |
Dominant Homozygous |
|
8 |
BT 37 |
66bp and 40bp |
Dominant Homozygous |
|
9 |
BT 35 |
66bp and 40bp |
Dominant Homozygous |
|
10 |
BT 39 |
66bp and 40bp |
Dominant Homozygous |
|
11 |
BT 01 |
66bp and 40bp |
Dominant Homozygous |
|
12 |
BT 02 |
66bp and 40bp |
Dominant Homozygous |
|
13 |
BT 03 |
66bp and 40bp |
Dominant Homozygous |
|
14 |
BT 04 |
66bp and 40bp |
Dominant Homozygous |
|
15 |
BT 05 |
66bp and 40bp |
Dominant Homozygous |
|
16 |
BT 06 |
66bp and 40bp |
Dominant Homozygous |
|
17. |
BT 08 |
66bp and 40bp |
Dominant Homozygous |
|
18. |
BT 09 |
66bp and 40bp |
Dominant Homozygous |
|
19. |
BT 13 |
66bp and 40bp |
Dominant Homozygous |
|
20. |
BT 32 |
66bp and 40bp |
Dominant Homozygous |
|
21. |
BT 50 |
66bp and 40bp |
Dominant Homozygous |
|
22. |
BT 10 |
66bp and 40bp |
Dominant Homozigous |
|
23. |
BT 48 |
66bp and 40bp |
Dominant Homozigous |
|
24. |
BT 28 |
66bp and 40bp |
Dominant Homozigous |
|
25. |
BT 46 |
66bp and 40bp |
Dominant Homozigous |
|
26. |
BT 27 |
66bp and 40bp |
Dominant Homozigous |
|
27. |
BT 47 |
66bp and 40bp |
Dominant Homozigous |
|
28. |
BT 30 |
66bp and 40bp |
Dominant Homozigous |
|
29. |
BT 41 |
66bp and 40bp |
Dominant Homozigous |
|
30. |
BT 53 |
66bp and 40bp |
Dominant Homozigous |
The amplified CD18 gene sequence did not have a cut-off site for the NCOI restriction enzyme. However, if a mutation occurs in a particular base that causes a change in the appropriate base sequence for the NCOI restriction site it can cause truncation at that site. The results indicate a suspected deduction in the case of mutations, these findings indicate that the two bands are derived from mutations in the 68 bp base pair with G to C base mutations. These mutations are not BLAD-specific mutations. If there is a specific BLAD mutation, i.e. base substitution from A to G at the restriction site, then even if there is a G to C mutation, the NCOI restriction enzyme cannot bypass that site (Palmer et al., 2011).
Allele frequency analysis
Analysis by the Hardy-Weinberg method shows the result of mutant allele frequency is “0” in the population. These results indicate that no female PFH carrier BLAD cattle have been found in Batu District. These results show similarities with the results of research in West Java (Nasrulloh et al., 2020). According to the latest survey by the Central Bureau of Statistics of Batu City in 2016, the population of PFH dairy cattle in Batu District is the largest of the two other sub-districts in Batu City, ranging from 5,084 of the total livestock population in Batu City to 11,611.
This shows that the supply and transportation of dairy cattle in Batu District is vast, but no BLAD career allele is found in Batu District. This can be caused by cement for artificial insemination, which has an excellent genetic quality, and no BLAD career alleles were found. The cement supply for artificially inserted in Batu City comes from BBIB Singosari Malang. The existence of a BLAD career individual at BBIB Singosari has been conducted by Herodita (2009), wherein 32 samples of FH dairy cows that are a source of cement production for IB, a BLAD detection test was carried out through PCR-RFLP with a success rate of 100% amplification showing 0% results for the genotype frequency of individual BLAD careers. So it is probable that this will affect the calculation results of the spread of BLAD career alleles in Batu District, which is also worth 0%.
There has been no relevant research to find out how widespread the individual BLAD carriers are throughout Indonesia. Some research on the spread of BLAD career cows in Indonesia has only been carried out in some areas such as West Java (0%) (Nasrulloh et al., 2020), Baturaden and Lembang (2.4%) (Farajallah et al., 2007), and Enrekang (0.625%) (Dagong et al., 2018). For East Java as a center for Indonesian dairy farming, it was even recorded that only BLAD detection was carried out at BBIB Singosari Malang and Tulungagung. According to the Central Statistics Agency (BPS) of East Java Province (2017), around 27 Regencies and 8 Cities in East Java Province have been calculated dairy cow population with a total population in East Java reaching 273,881 dairy cows so that it needs to be detected by an appropriate sampling method in a more equitable area of research to ensure the extent of the spread of BLAD in Indonesia (Herodita, 2009).
CONCLUSIONS and Recommendations
Based on the results of research and discussion that has been submitted, it can be concluded that:
- The PCR-RFLP method in the CD18 gene can identify the presence of BLAD carier alleles in female FH dairy cows through the mechanism of restriction enzyme cutting so that this method can be one of the genetic quality screening methods specifically related to the CD18 gene in dairy cows and early detection of heterozygous allele spread BLAD
- The polymorphism that appears in the CD18 gene by PCR-RFLP method in all samples shows the substitution mutation type G base to C transversion and is not related to the BLAD mutation. The location of the mutation is in accordance with the estimated location of the polymorphism mutation, namely the base pairs to 68 bp in the CD18 gene sequence.
Novelty Statement
It was previously shown that TaqI and HaeIII restriction enzyme in PCR-RFLP method can be used for molecular identification of BLAD (Dagong et al., 2018: Kumar and Sharma, 2009). Our Study demonstrates that NcoI restriction enzyme can also be used in the identification of BLAD through the identifivation of certain mutations. Our study also provides additional data on the distribution of BLAD specifically in Batu and generally in Indonesia
Author’s Contribution
All authors composed and contrived the study. All authors contributed to manuscript revisions and approved the final manuscript. All authors agree tobe held accountable for the content therein
Conflict of interest
The authors have declared no conflict of interest.
References
Akyus B, Ertugrul O (2006). Detection of bovine leukocyte adhesion deficiency (BLAD) in Turkish native and Holstein cattle. Acta Vet. Hung., 54(2): 173–178. https://doi.org/10.1556/AVet.54.2006.2.4
Dagong M, Rahim L, Bugiwati RA, Nurmulyaningsih (2018). Allele frequency estimation of BLAD (Bovine Leukocyte). Earth Environ. Sci., 207: 012031. https://doi.org/10.1088/1755-1315/207/1/012031
Farajallah A, Sumantri C, Muttaqin WN (2007). Identification of Alleles Carrier of Bovine Leucocyte Adhesion Deficiency (BLAD) in Friesian Holstein Dairy Cattle in Indonesia. National Seminar on Animal Husbandry and Veterinary Technology. 2007. Scientific Repository IPB University
Gong R, Li S (2014). Extraction of human genomic DNA from whole blood using a magnetic microsphere method. Int. J. Nanomed., 9: 3781-3789. https://doi.org/10.2147/IJN.S59545
Harahap AS (2014). The Quality and Quantity test of DNA in population of Sumatran Lime Tress. Journal of Animal Science and Agronomy Panca Budi, 2(2).
Herodita LU (2009). Identification of bovine leucocyte adhesion deficiency (BLAD) at the Friesien-Holstein cattle farm in Java-Bali. Bogor: Departemen Biologi Fakultas Matematika dan Ilmu Pengetahuan Alam Institut Pertanian Bogor.
Kaya M, Meydan H, Kiyma Z, Alan M, Yildiz MA (2016). Screening for bovine leukocyte adhesion deficiency, deficiency of uridine monophosphate synthase, bovine citrullinaemia and factor XI deficiency in Holstein cattle. Indian J. Anim. Sci., 86(8): 900–903.
Khade AS, Doiphode AY, Umrikar UD, Sawane MP, Pawar VD (2014). Genotyping of the Holstein-Friesian crossbred cattle for gene using PCR-RFLP. Vet. World, 7(5): 360-362. https://doi.org/10.14202/vetworld.2014.360-362
Kumar V, Sharma A (2009). Bovine leucocyte adhesion deficiency syndrome (BLAD): A review. Agric. Rev., 30(4): 293-300.
Meydan H, Yildiz MA, Agerholm JS (2010). Screening for bovine leukocyte adhesion deficiency, deficiency of uridine monophosphate synthase, complex vertebral malformation, bovine citrullinaemia, and factor XI deficiency in Holstein cows reared in Turkey. Acta Vet. Scand., 52(56). https://doi.org/10.1186/1751-0147-52-56
Nasreen F, Malik NA, Riaz MN, Qureshi JA (2009). Detection and screening of bovine leukocyte adhesion deficiency in Pakistan using molecular methods. Hereditas, 146: 74-78. https://doi.org/10.1111/j.1601-5223.2009.02093.x
Nasrulloh MF, Wulandari AS, Indriawati, Margawati ET, Volkandari SD (2020). Detection of the CD18 gene mutation as a marker of BLAD genetic disorder of Holstein-Friesian cattle in West Java. Livest. Anim. Res., 18(2): 116-123. https://doi.org/10.20961/lar.v18i2.42933
Ningsih AU, Tatag BPP, dan Endang TM (2017). DNA collection and confirmation of ETH10 markers encoding growth traits in Pasundan cattle. 2017. Biotropic, 1(1): 18–25. https://doi.org/10.29080/biotropic.2017.1.1.9-16
Palmer BR, Robert N, Hickford JGH, Bickerstaffe, R (1998). Rapid Communication: PCR-RFLP for MSP1 and NcoI in the Ovine Calpastatin Gene. J. Anim. Sci. 76: 1499-1500. https://doi.org/10.2527/1998.7651499x
Rahayu S, Sumitro SB, Susilawati T, Soemarno (2006). Identification of Bali cattle GH (growth hormone) gene polymorphisms using the PCR-RFLP method. J. Biol. Res., 12(1): 7-11. https://doi.org/10.23869/bphjbr.12.1.20062
Rasmussen HB (2012). Restriction fragment length polymorphism analysis of PCR-amplified fragments (PCR-RFLP) and gel electrophoresis valuable tool for genotyping and genetic fingerprinting. 2012. Intechopen.
Ribeiro LA, Baron EE, Martinez ML, Coutinho LL (2000). PCR screening and allele frequency estimation of bovine leukocyte adhesion deficiency in Holstein and Gir cattle in Brazil. Genet. Mol. Biol., 23(4): 831-834. https://doi.org/10.1590/S1415-47572000000400021
Zsolnai A, Fesus L (1996). Simultaneous analysis of bovine #-casein and BLAD alleles by multiplex PCR followed by parallel digestion with two restriction enzymes. Anim. Genet., 27: 207-209. https://doi.org/10.1111/j.1365-2052.1996.tb00954.x
To share on other social networks, click on any share button. What are these?

