Evaluation of Methicillin Resistance in Field Isolates of Staphylococcus aureus: An Emerging Issue of Indigenous Bovine Breeds
Evaluation of Methicillin Resistance in Field Isolates of Staphylococcus aureus: An Emerging Issue of Indigenous Bovine Breeds
Nauman Zaheer Ghumman, Muhammad Ijaz*, Arslan Ahmed, Muhammad Umar Javed, Iqra Muzammil and Ahmed Raza
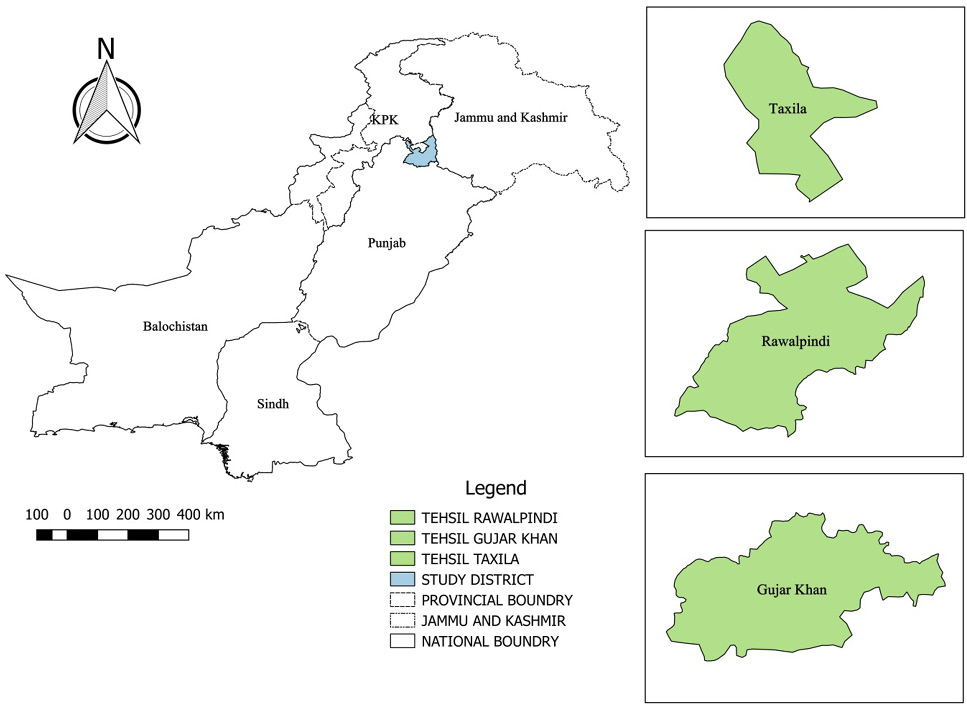
QGIS map showing the study area.
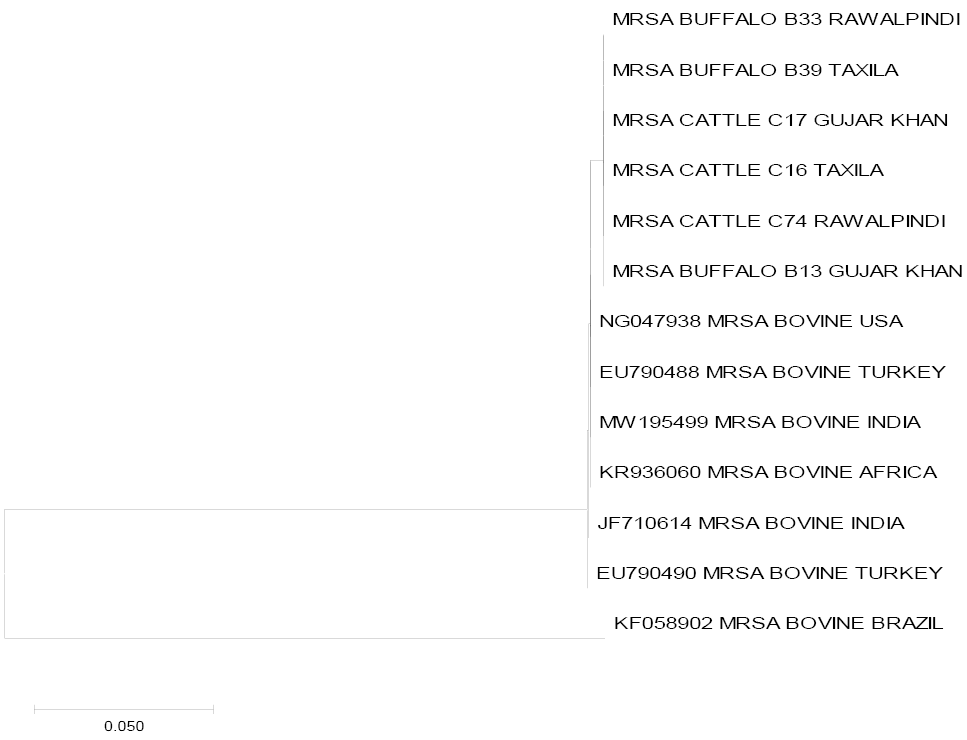
Phylogenetic Tree showing comparison of the study isolates of MRSA with reported isolates.
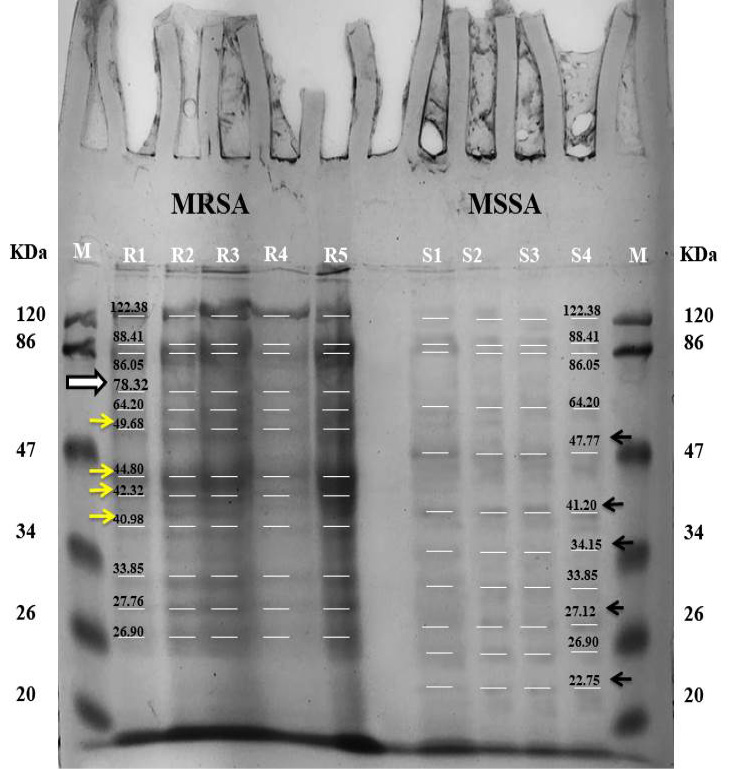
Manually labeled SDS-PAGE comparison results of MRSA and MSSA with a determined molecular weight of each band. (R1 to R5) shows MRSA isolates, while, (S1 to S4) shows the MSSA. The white arrow shows the presence of 78kDa band of PBP2a protein of MRSA and absent in MSSA. (Yellow arrows) Shows the difference in protein bands present in MRSA, (Black arrows) shows the difference in protein bands present in MSSA.


