Submit or Track your Manuscript LOG-IN

Epidemiological Study and Clinical Characterization of COVID-19 Cases in Xuzhou, China

Epidemiological Study and Clinical Characterization of COVID-19 Cases in Xuzhou, China

Zhan-Zhong Liu1, Chun-Ying Wang1, Jian-Ye Yang2, Qing-Hua Liu3,4, Xiao Zhang3* and Liang Wang3,4*

1Xuzhou Infectious Diseases Hospital, Affiliated Hospital of Xuzhou Medical University, Xuzhou 2210000, China 
2Hubei Key Laboratory of Agricultural Bioinformatics, College of Informatics, Huazhong Agricultural University, Wuhan 430070, China 
3Department of Bioinformatics, School of Medical Informatics and Engineering, Xuzhou Medical University, Xuzhou 221000, China 
4Jiangsu Key Laboratory of New Drug Research and Clinical Pharmacy, School of Pharmacy, Xuzhou Medical University, Xuzhou 221000, China
 
Zhan-Zhong Liu and Chun-Ying Wang contributed equally to this study.
 
* Corresponding authors: [email protected]; [email protected]

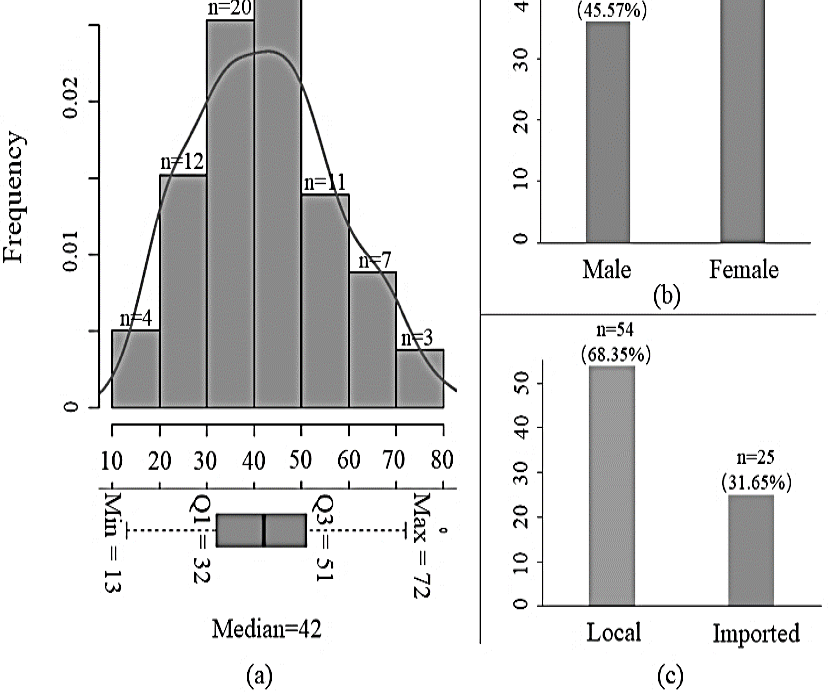
Fig. 1.

Demographic analysis of 79 confirmed COVID19 cases in Xuzhou in terms of age, gender, and transmission routes. (a) age distribution, (b) sex ratio, (c) number of local and imported cases. 

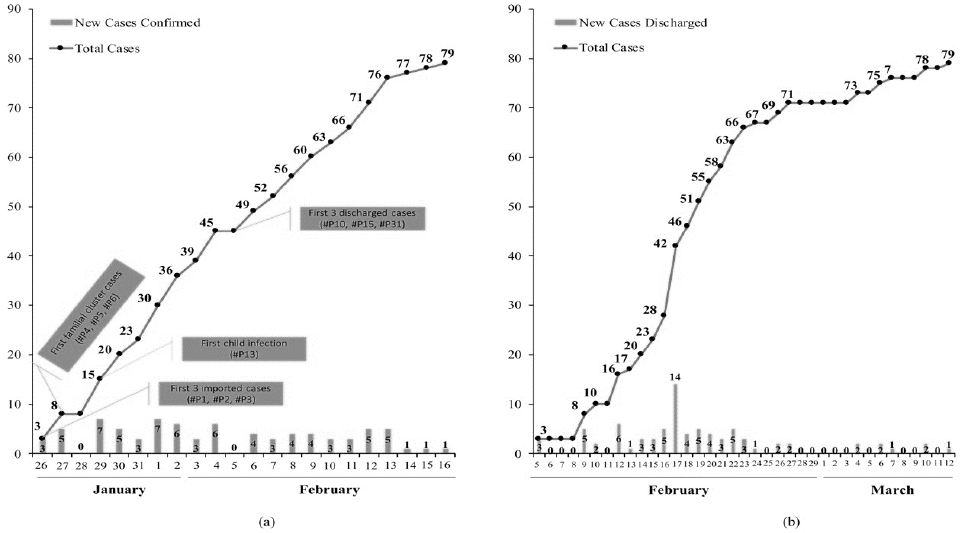
Fig. 2.

Cumulative growth curve of new COVID19 cases and discharged patients in Xuzhou, China. (a) Daily new cases and cumulative sum curve. Continuously increasing trend of confirmed cases was observed. The first 3 cases (#P1, #P2, #P3) reported on Jan 26 were all imported and had Wuhan travel history. (b) Daily discharged cases and cumulative sum curve. On Feb 5, first 3 recovered patients (#P10, #P15, #P31) were discharged from hospital. All the patients were finally discharged and recovered from the disease.

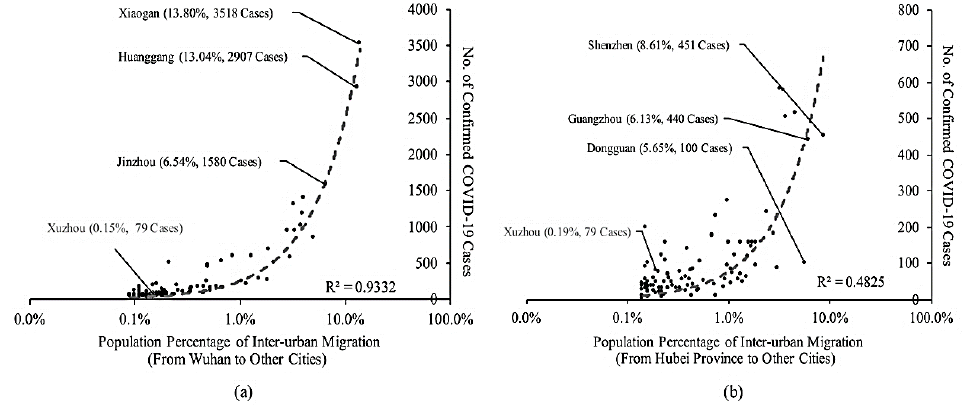
Fig. 3.

Interurban population migration from (a) Wuhan city or (b) Hubei province to other cities in China from January 10 to the lockdown on January 24, 2020.

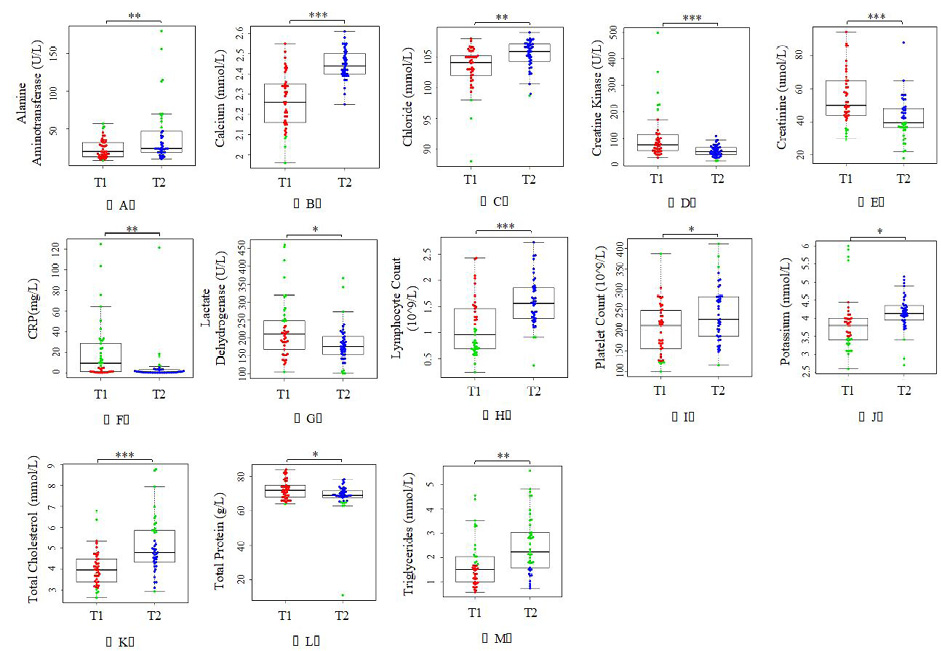
Fig. 4.
Comparison of 13 parameters of laboratory tests in 41 COVID19 patients that were significantly changed after medical treatments for more than 7 days. 
Notes: T1: first test. T2: second test. (A) Alanine Aminotransferase (normal range=950 U/L). (B) Calcium (mmol/L). (C) Chloride (mmol/L). (D) Creatine kinase (U/L). (E) Creatinine (umol/L). (F) CRP (mg/L). (G) Lactate dehydrogenase (U/L). (H) Lymphocytes (109/L). (I) Platelet count (109/L). (J) Potassium (mmol/L). (K) Total dholesterol (mmol/L). (L) Total protein (g/L). (M) Triglycerides (mmol/L). T1: Red dots. T2: Blue dots. Out of normal range: Green dots. Statistical significance was found in comparison via two tailed unequal variance Student’s t test (P value: *, <0.05, **, <0.01, ***, <0.001).

Pakistan Journal of Zoology

December

Pakistan J. Zool., Vol. 56, Iss. 6, pp. 2501-3000

Featuring

Click here for more

Subscribe Today

Receive free updates on new articles, opportunities and benefits


Subscribe Unsubscribe