Effects of Follicular Fluid on Developmental Competence and Gene Expression of in vitro Fertilized Sheep Embryos
Effects of Follicular Fluid on Developmental Competence and Gene Expression of in vitro Fertilized Sheep Embryos
Mousa O. Germoush1,*, Mohsen G. Al-Mutary2, Ahmad R. Al-himaidi3, Muath G. Al-Ghadi3, Daisaku Iwamoto3,4, Yousef Al-anazi3, Aiman Ammari3, Javed Ahmad3,5, Abdulaziz Al-Khedhairy3,5
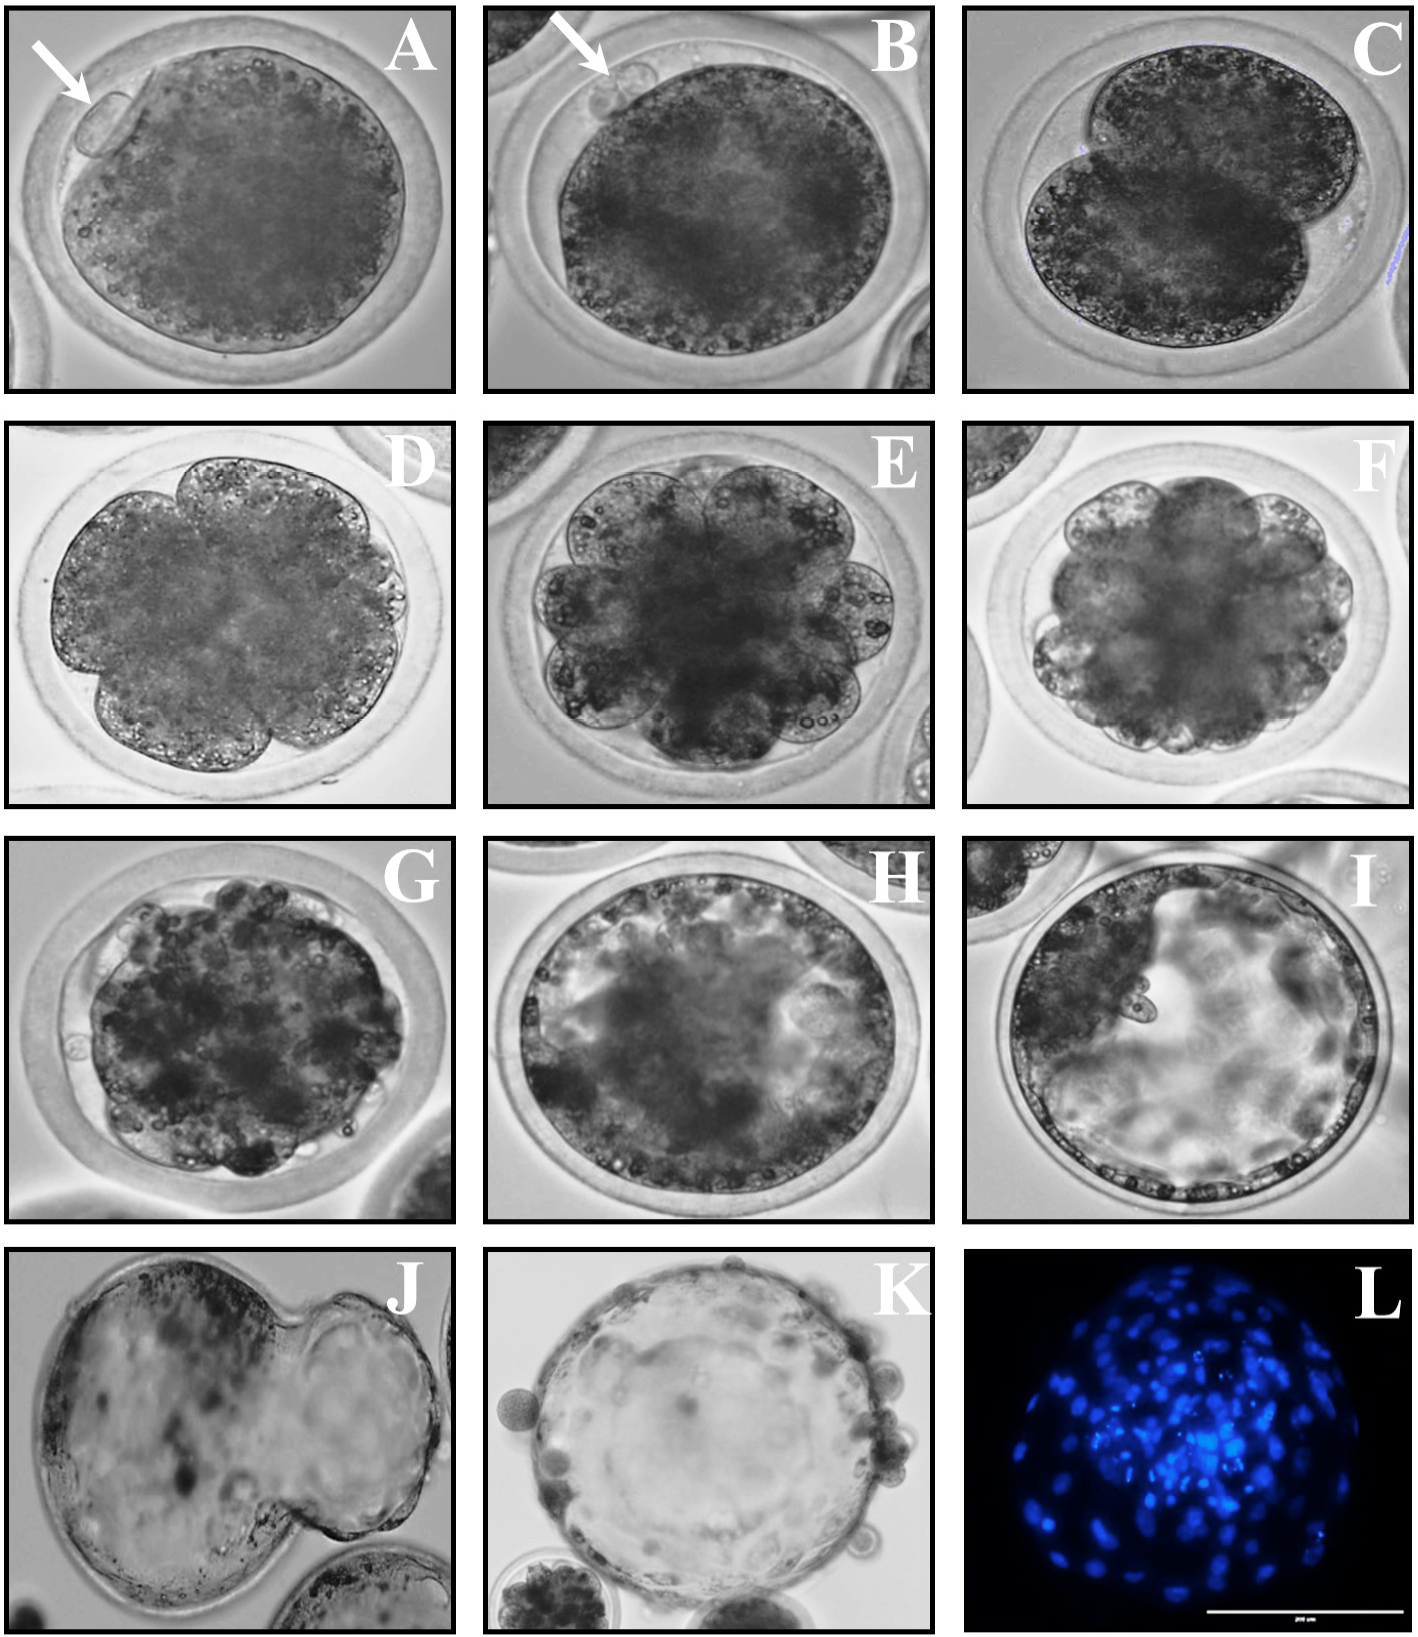
The different stages of embryonic development of sheep embryos produced in vitro. A, Matured oocyte (the arrow = 1st polar body); B, Zygote (the arrow = 2nd polar body); C, 2 cells stage; D, 4 cells stage, € 8 cells stage; F, 16 cells stage; G, Morula stage; H, early blastocyst I, expanded blastocyst; J, hatching blastocyst; K, hatched blastocyst; L, blastocyst on day 7 stained with Hoechst.
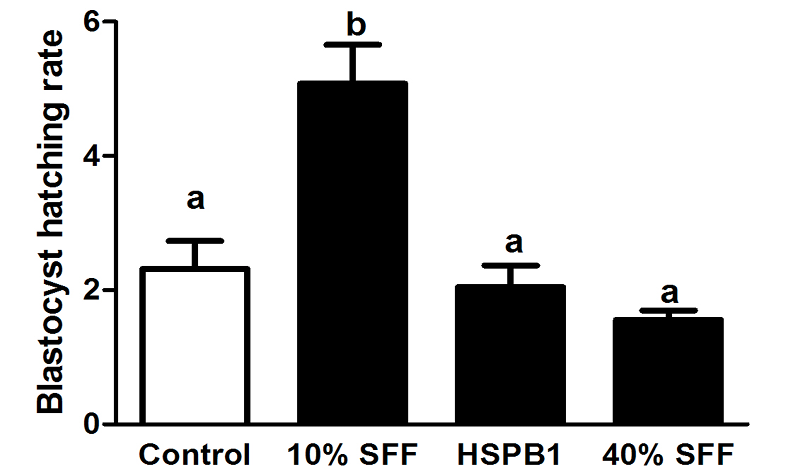
Effect of sheep follicular fluid on hatching rate of blastocyst. Data are expressed as Mean ± SEM. Different superscript (a, b, c) within columns are significantly different, (P < 0.05).
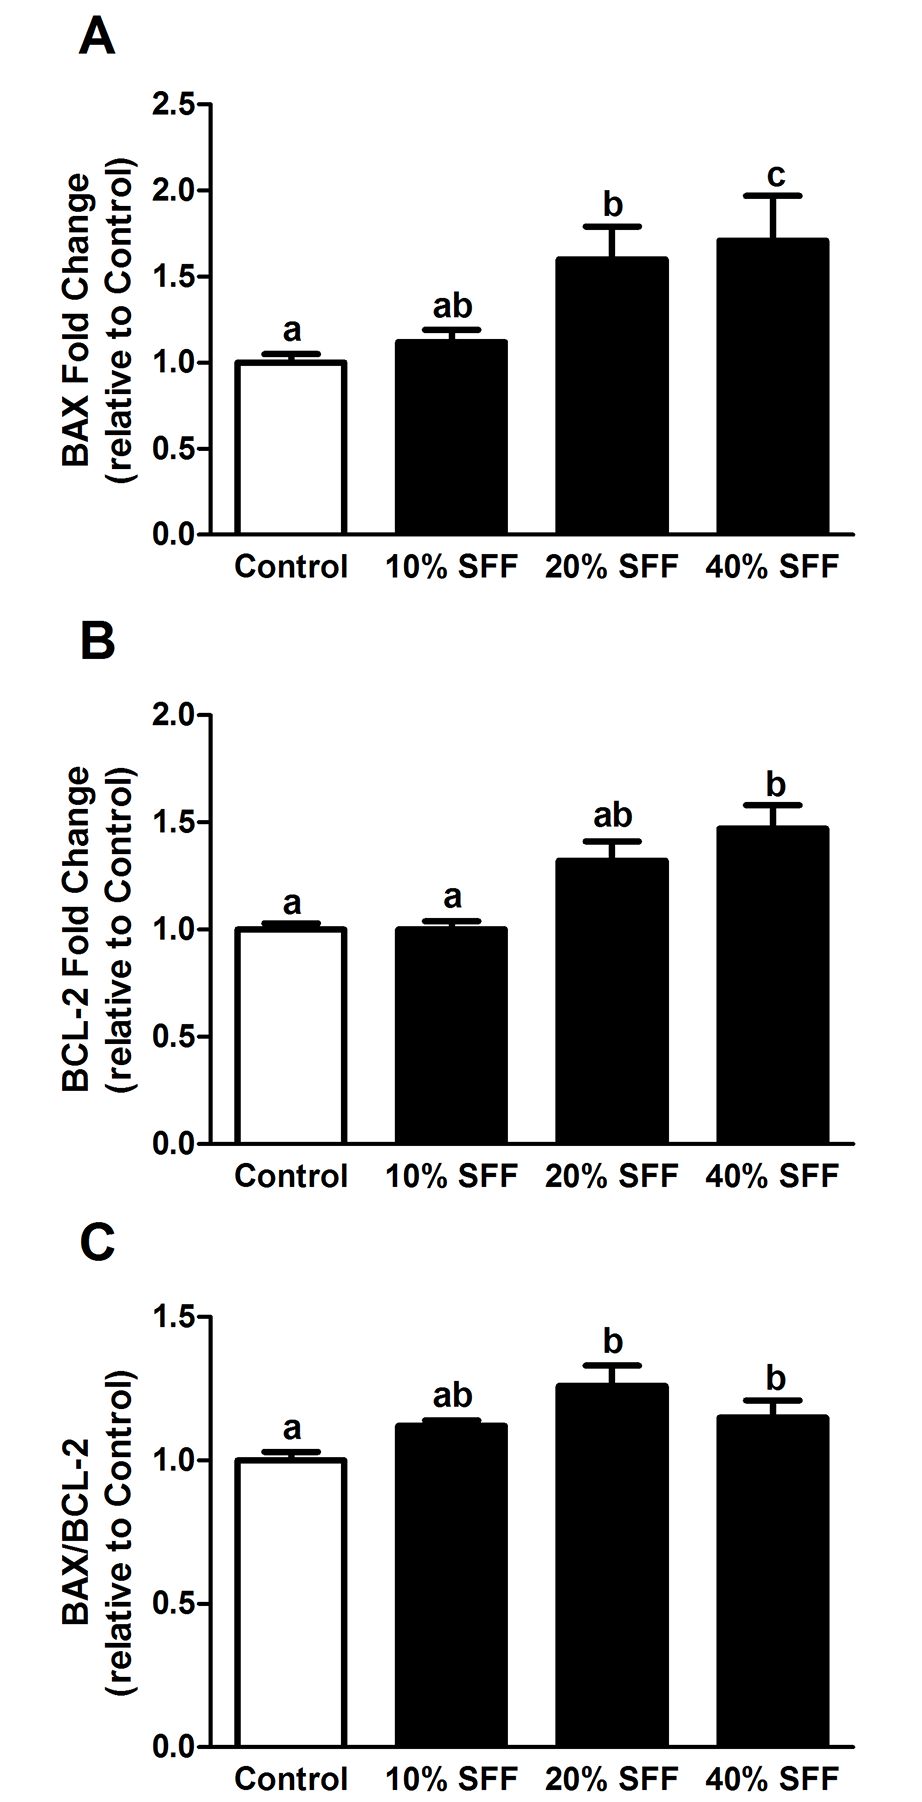
Effect of sheep follicular fluid on BAX (A), BCL-2 gene expression(B) and BAX/BCL-2 (C) ratio of sheep embryos. Data are expressed as Mean ± SEM. Different superscript (a, b, c) within columns are significantly different, (P < 0.05).
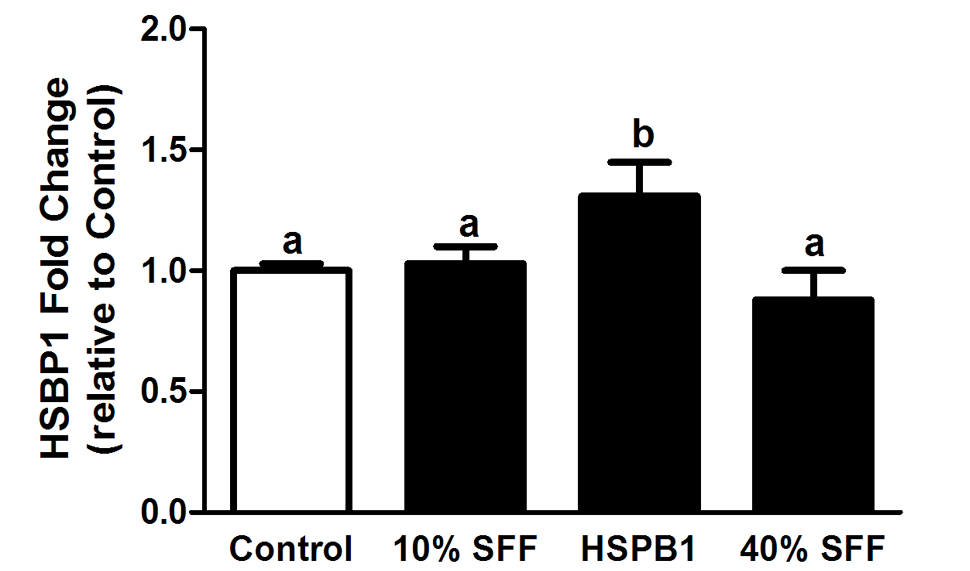
Effect of sheep follicular fluid on HSBP1gene expression of sheep embryos. Data are expressed as Mean ± SEM. Different superscript (a, b, c) within columns are significantly different, (P < 0.05).
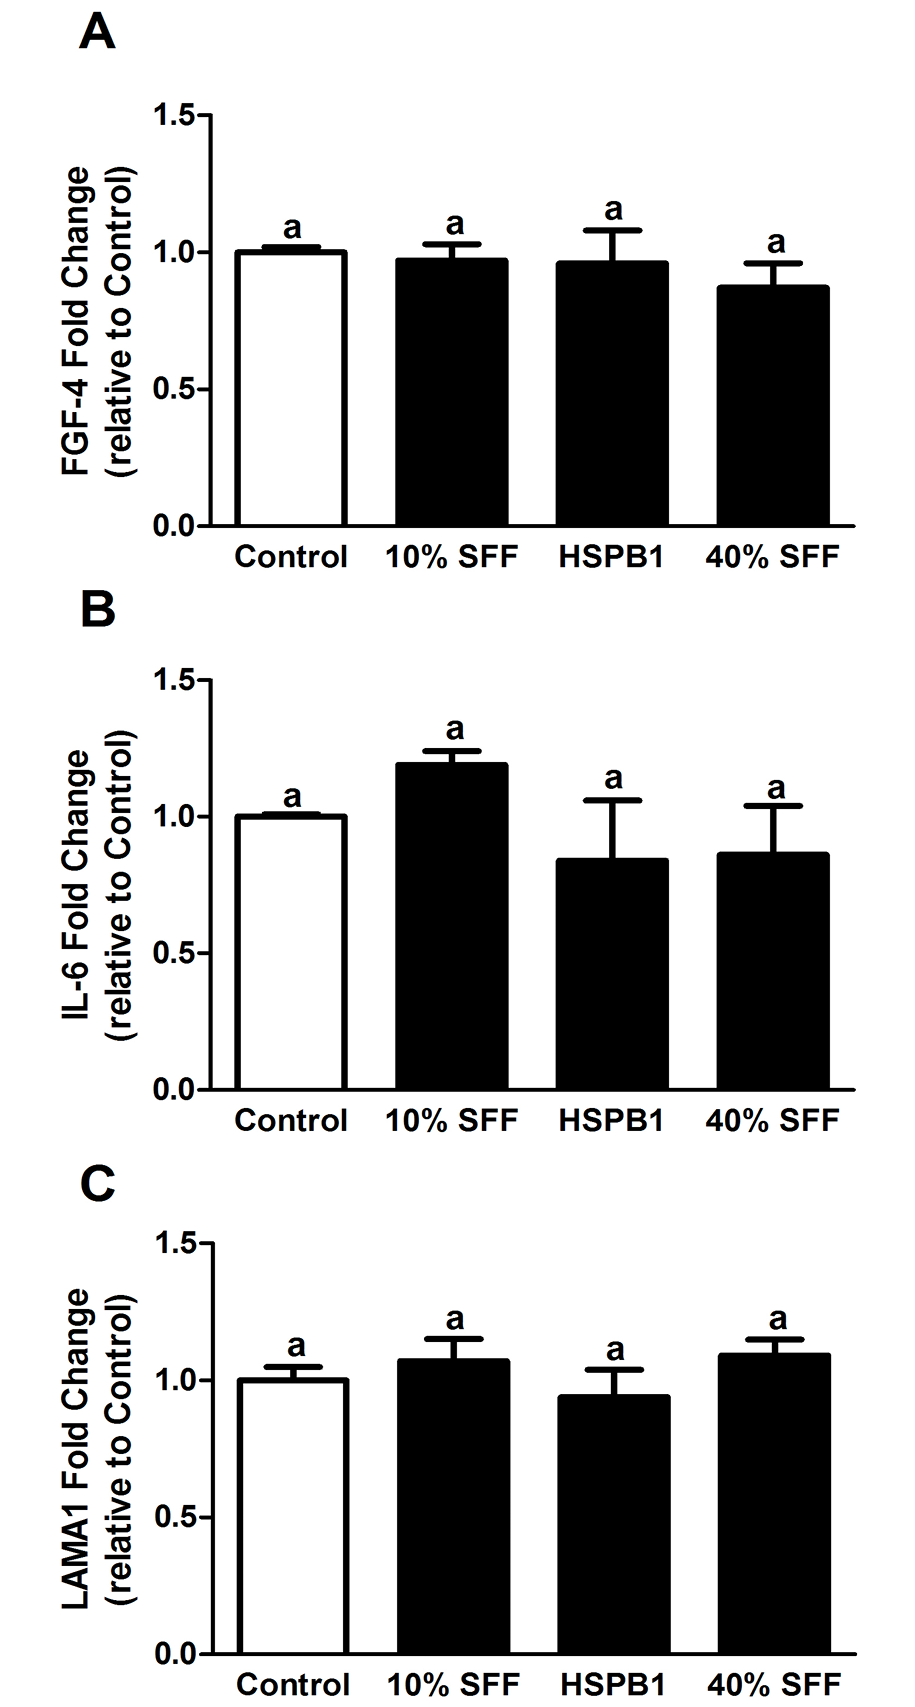
Effect of sheep follicular fluid on FGFBP-4 (A), IL-6 (B) and LAMA1 (C) gene expression of sheep embryos. Data are expressed as Mean ± SEM. Different superscript (a, b, c) within columns are significantly different, (P < 0.05).


