

Effects of Energy Levels on Autophagy, Adipogenic Differentiation and Lipid Metabolism in Subcutaneous and Visceral Pre-Adipocytes


Effects of Energy Levels on Autophagy, Adipogenic Differentiation and Lipid Metabolism in Subcutaneous and Visceral Pre-Adipocytes
Jie Chen, Qinghua Qiu, Yanjiao Li, Xianghui Zhao, Lanjiao Xu, Xiaowen Xiong, Qingqi Wen, Mingren Qu and Kehui Ouyang*

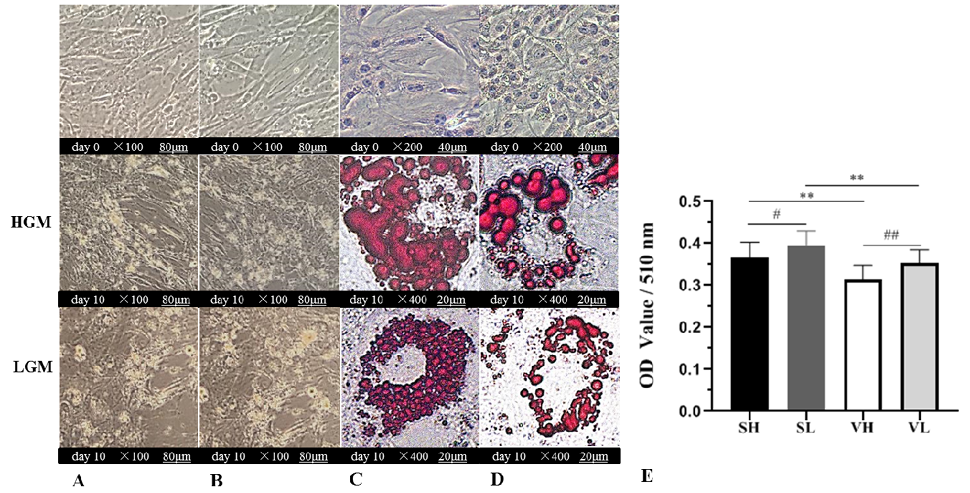
Adipocyte differentiation from subcutaneous and visceral pre-adipocytes. HGM represents the differentiation of this row into high-glucose medium (supplemented 4500 mg/L glucose), and LGM represents the differentiation of this row into low-glucose medium (supplemented 1000 mg/L glucose). Subcutaneous (A) and visceral pre-adipocytes (B) were photographed under the bright-filed microscope at day 0 and day 10. Subcutaneous pre-adipocytes (C) and visceral pre-adipocytes (D) were stained with oil red-O dye was photographed under the bright-field microscope at day 0 and day 10. Cells at the indicated days were stained with Oil-Red O dyes as described in “Materials and methods”. (E) Histogram of triglyceride extraction after differentiation of subcutaneous in high-glucose medium (SH), subcutaneous in low-glucose medium (SL), visceral in high-glucose medium (VH), visceral in low-glucose medium (VL). The values were expressed as mean ± SD, * p < 0.05, ** p < 0.01, comparisons were done between SH and VH, SL and VL, # p < 0.05, ## p < 0.01, comparisons were done between SH and SL, VH, and VL.
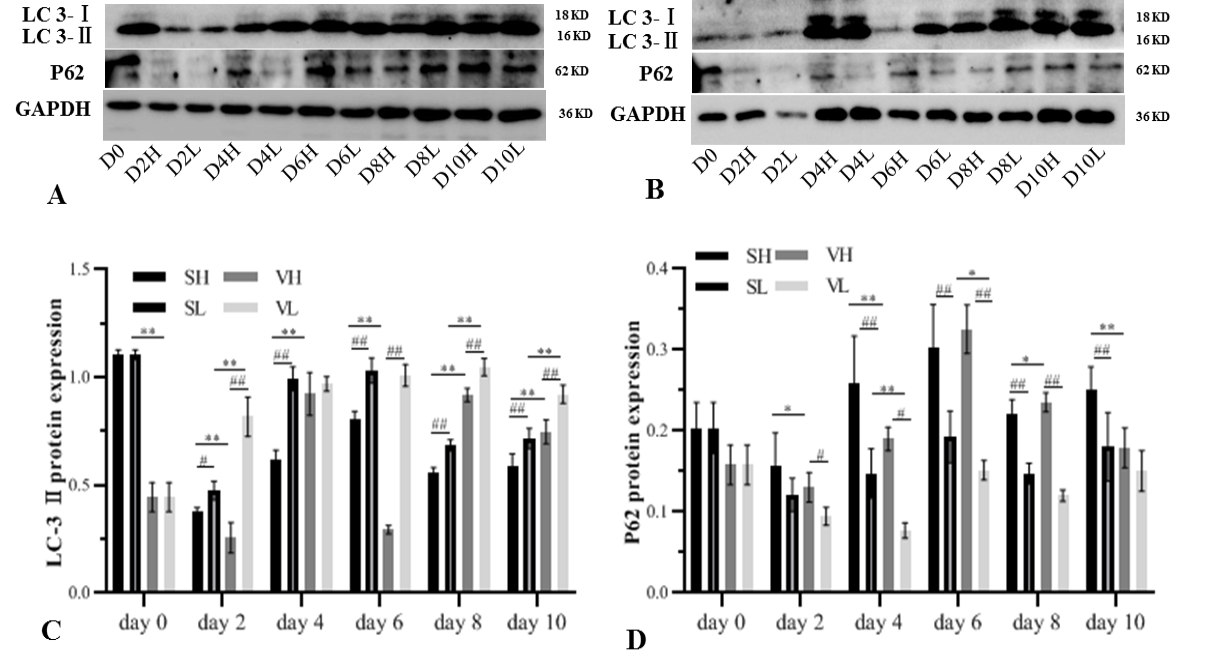
Expression of autophagy-related protein during adipogenesis differentiation. Subcutaneous pre-adipocyte in high-glucose medium (SH), subcutaneous pre-adipocyte in low-glucose medium (SL), visceral pre-adipocyte in high-glucose medium (VH), visceral pre-adipocyte in low-glucose medium (VL) at the indicated days (D0, D2, D4, D6, D8, D10). High-glucose medium supplemented 4500 mg/L glucose, low-glucose medium supplemented 1000 mg/L glucose. Protein band of LC3 and p62 in subcutaneous (A) and visceral pre-adipocyte (B). The cells extracts were prepared at the indicated days, and total cell proteins (25 µg) were separated on a 12% SDS-PAGE gel and analyzed by western blotting using abti-LC3 and anti-p62 antibody. Loading control was verified by GAPDH. Gray value quantification of LC-3 (C) and P62 (D). The values were expressed as mean ± SD, * p < 0.05, ** p < 0.01 comparisons were done between SH and VH, SL and VL, # p < 0.05, ## p < 0.01 comparisons were done between SH and SL, VH, and VL.

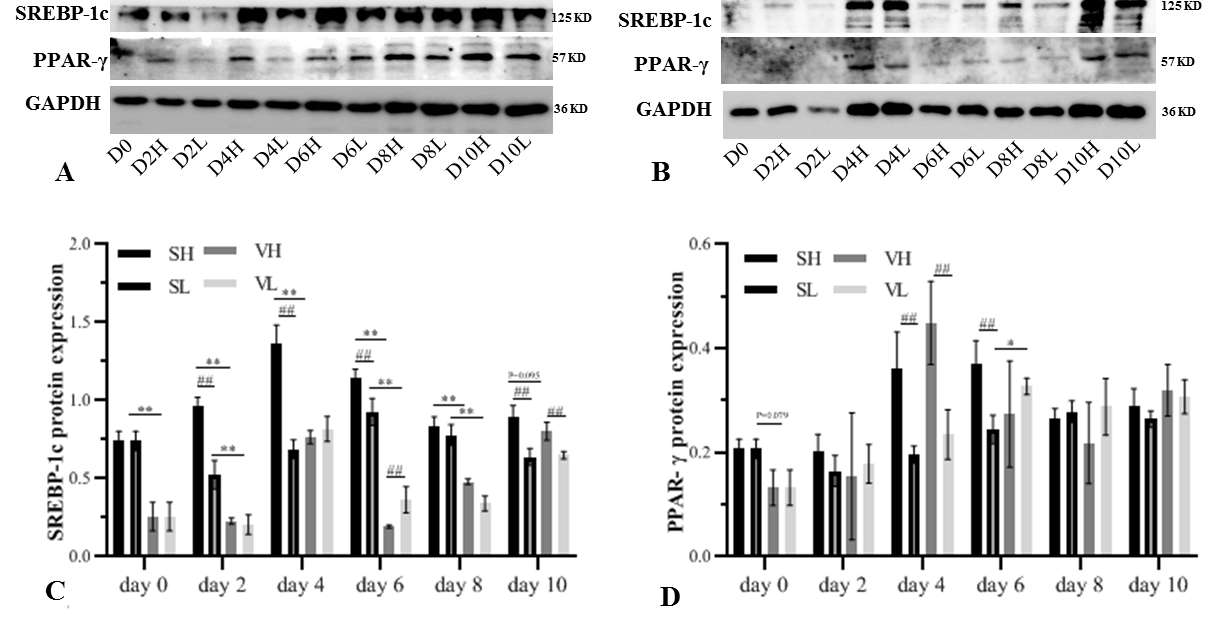
Expression of adipogenic transcription factors related protein during adipogenesis differentiation. Subcutaneous pre-adipocyte in high-glucose medium (supplemented 4500 mg/L glucose) (SH), subcutaneous pre-adipocyte in low-glucose medium (supplemented 1000 mg/L glucose) (SL), visceral pre-adipocyte in high-glucose medium (VH), visceral pre-adipocyte in low-glucose medium (VL) at the indicated days (D0, D2, D4, D6, D8, D10). High-glucose medium supplemented 4500 mg/L glucose, low-glucose medium supplemented 1000 mg/L glucose. Protein band of SREBP-1c and PPAR-γ in subcutaneous pre-adipocyte (A) and visceral pre-adipocyte (B). cells extracts were prepared at the indicated days, and total cell proteins (25 g) were separated on a 10% SDS-PAGE gel and analyzed by western blotting using abti-SREBP1c and anti-PPARγ antibody. Loading control was verified by GAPDH. Gray value quantification of SREBP-1c (C) and PPAR-γ (D). The values were expressed as mean ± SD, * p < 0.05, ** p < 0.01 comparisons were done between SH and VH, SL and VL, # p < 0.05, ## p < 0.01 comparisons were done between SH and SL, VH, and VL.

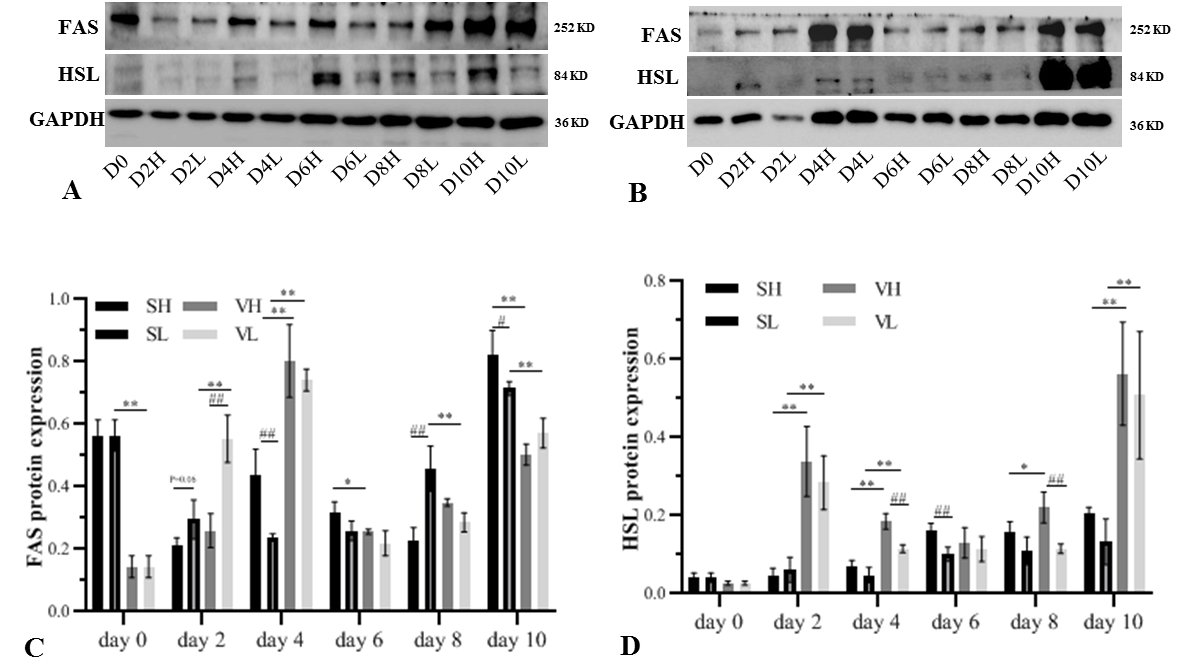
Expression of lipogenesis and lipolysis-related protein during adipogenesis differentiation. Subcutaneous pre-adipocyte in high-glucose medium (SH), subcutaneous pre-adipocyte in low-glucose medium (SL), visceral pre-adipocyte in high-glucose medium (VH), visceral pre-adipocyte in low-glucose medium (VL) at the indicated days (D0, D2, D4, D6, D8, D10). High-glucose medium supplemented 4500 mg/L glucose, low-glucose medium supplemented 1000 mg/L glucose. Protein band of HSL and FAS in subcutaneous pre-adipocytes (A) and visceral pre-adipocytes (B). Cells extracts were prepared at the indicated days, and total cell proteins (25 µg) were separated on a 8% SDS-PAGE gel and analyzed by western blotting using abti-FAS and anti-HSL antibody. Loading control was verified by GAPDH. Gray value quantification of FAS (C) and HSL (D). The values were expressed as mean ± SD, * p < 0.05, ** p < 0.01 comparisons were done between SH and VH, SL and VL, # p < 0.05, ## p < 0.01 comparisons were done between SH and SL, VH, and VL.


