Effect of Calcium, Boron and Zinc Foliar Application on Growth and Fruit Production of Tomato
Effect of Calcium, Boron and Zinc Foliar Application on Growth and Fruit Production of Tomato
Bibi Haleema1*, Abdur Rab1 and Syed Asghar Hussain2
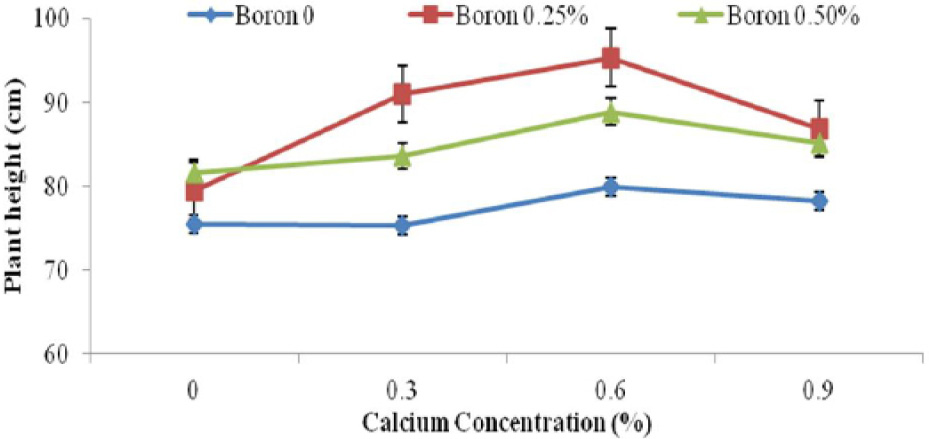
The interaction of Ca and B application on plant height of tomato. The vertical bars represent standard error.
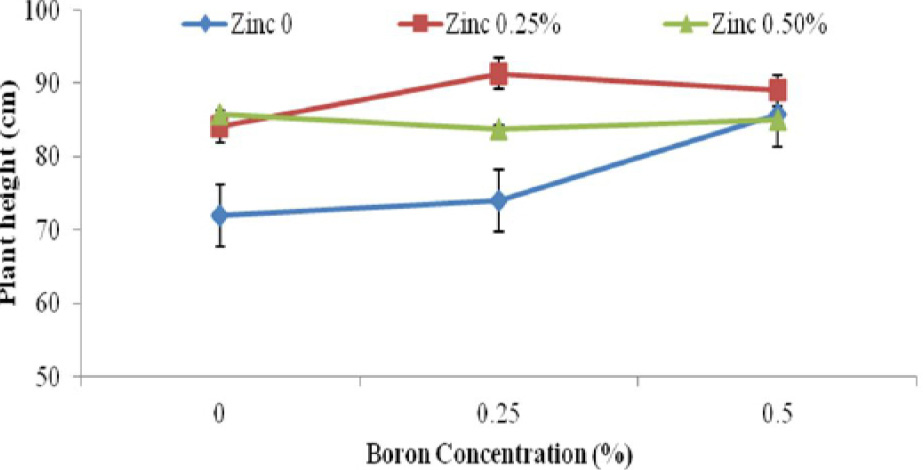
The interaction of B and Zn application on plant height of tomato. The vertical bars respresent standar error.
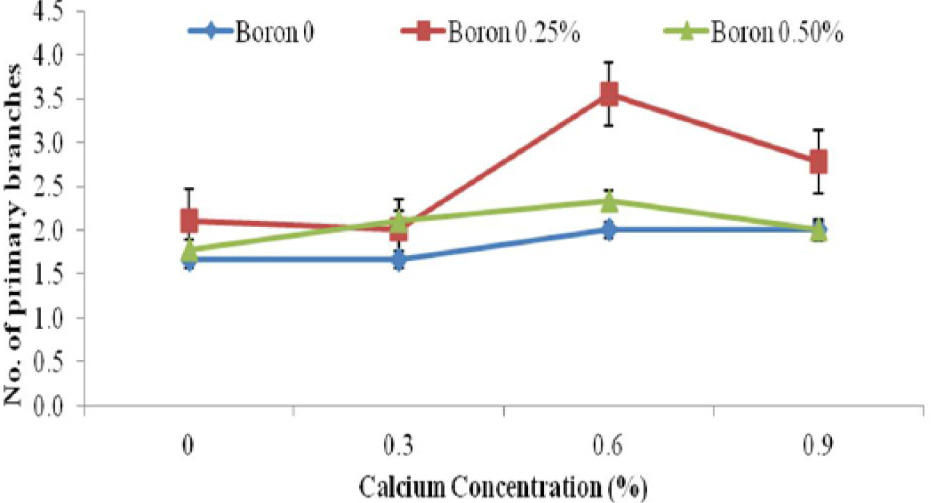
The interaction of Ca and B application on the number of primary branches of tomato. The vertical bars represent standard error.
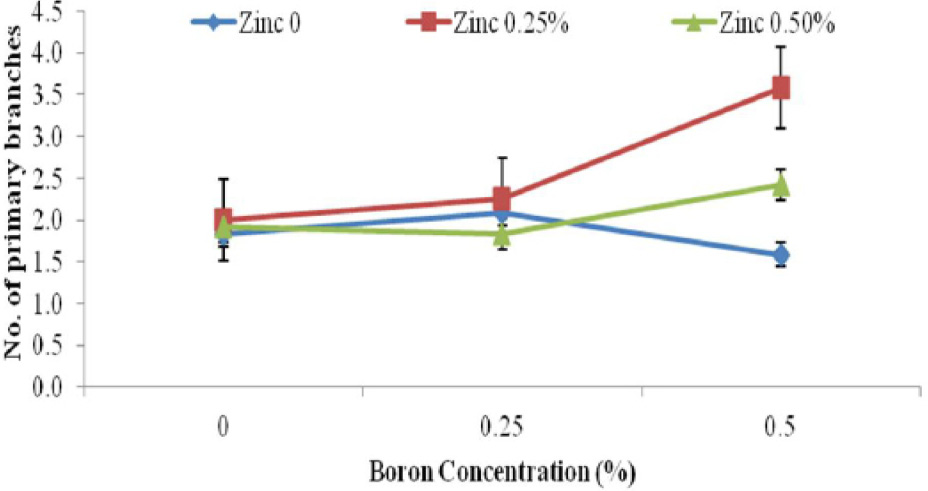
The interaction of B and Zn application on the number of primary branches of tomato. The vertical bars represent standard error.
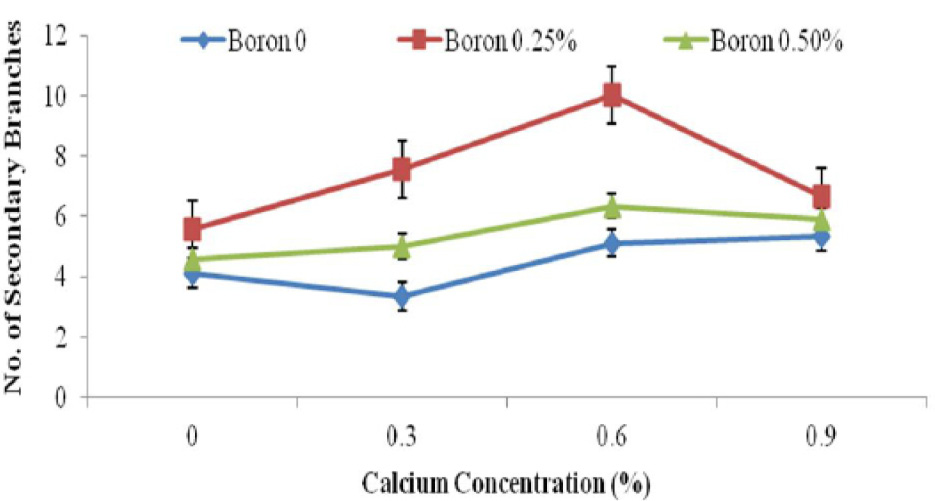
The interaction of Ca and B application on the number of secondary branches of tomato. The vertical bars represent standard error.
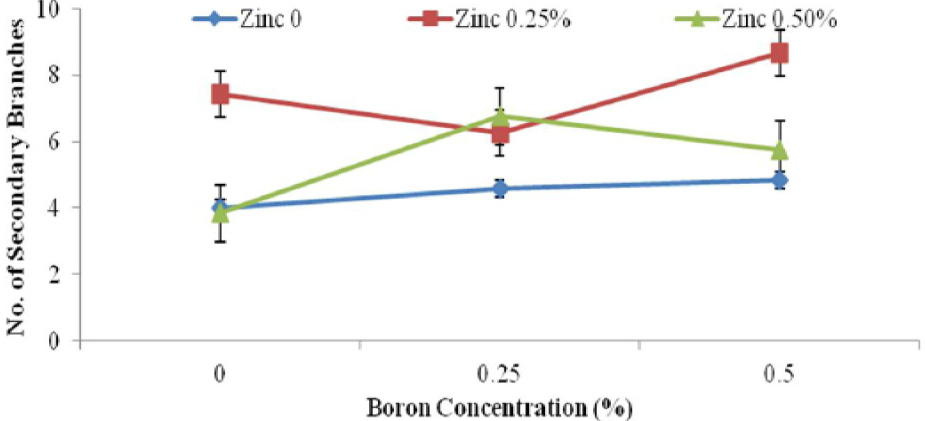
The interaction of B and Zn application on the number of secondary branches of tomato. The vertical bars represent standard error.
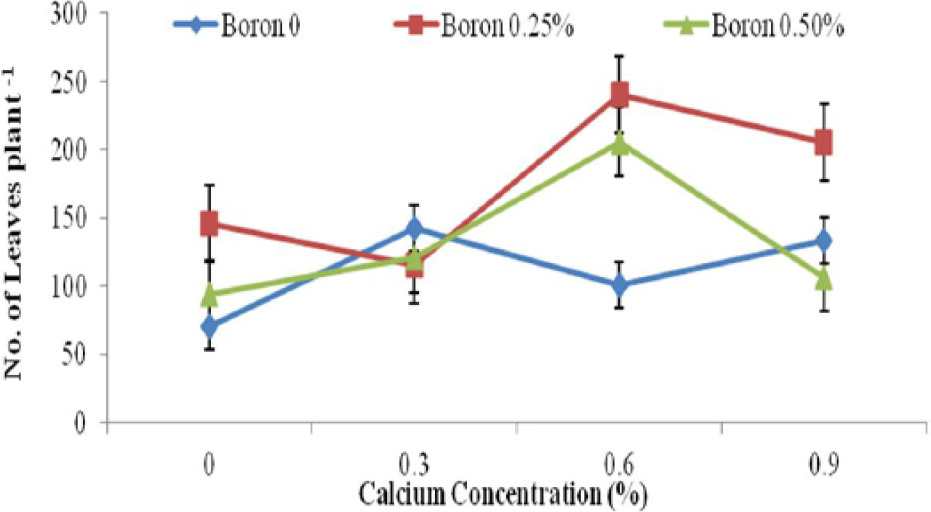
The interaction of Ca and B application on the number of leaves plant-1 of tomato. The vertical bars represent standard error.
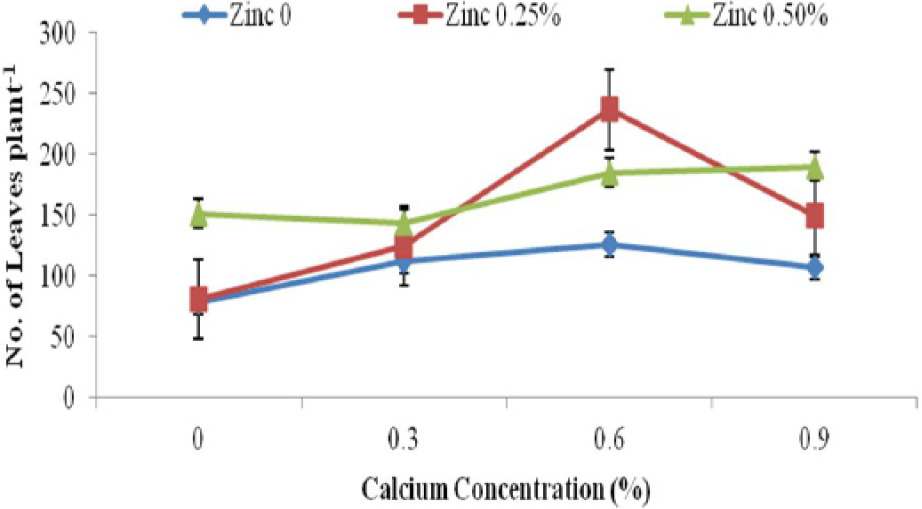
The interaction of Ca and Zn application on the number of leaves plant-1 of tomato. The vertical error bars represent standard error.
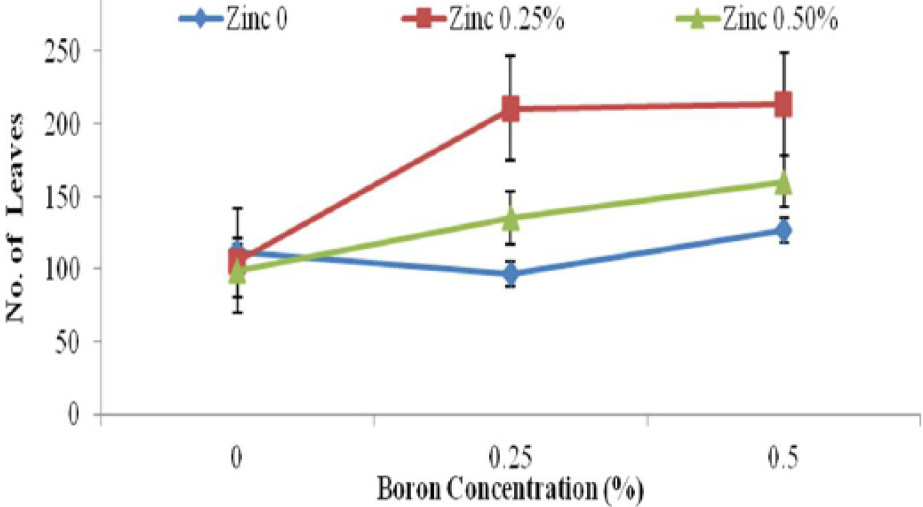
The interaction of B and Zn application on the number of leaves plant-1 of tomato. The vertical bars represent standard error.
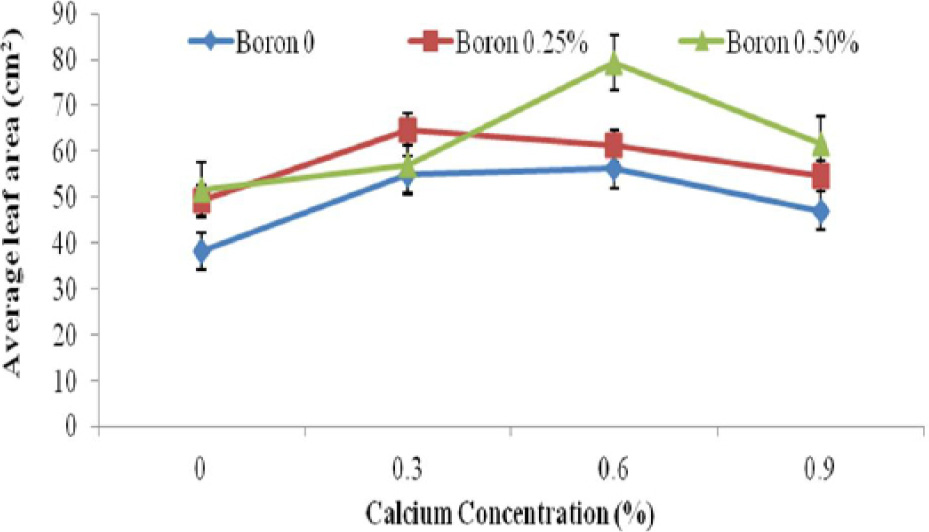
The interaction of Ca and B application on the leaf area of tomato. The vertical bars represent standard error.
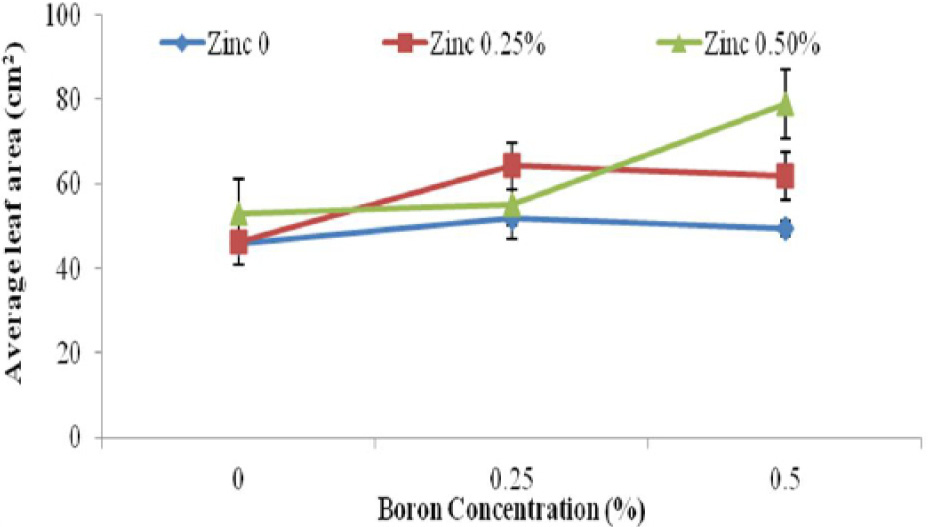
The interaction of B and Zn application on the leaf area of tomato. The vertical bars represent standard error. Vertical bars represent standard error.
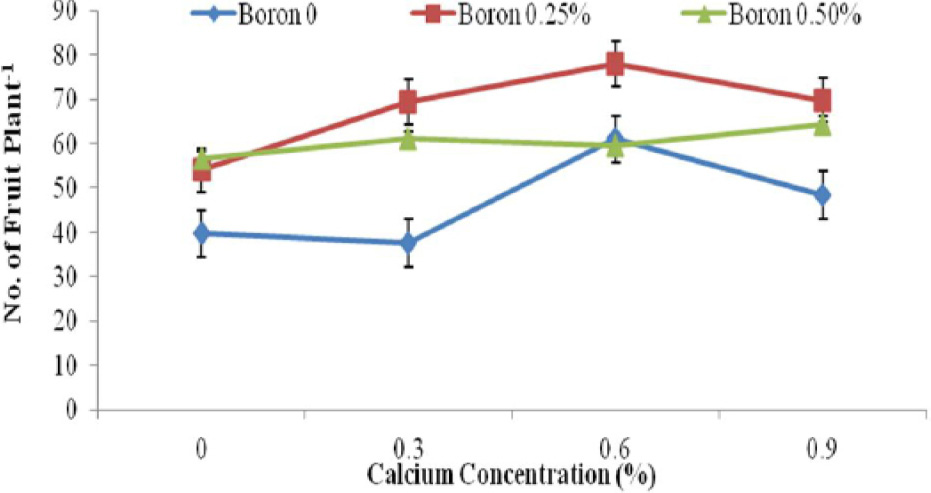
The interaction of Ca and B application on the number of fruits plant-1 of tomato. The vertical bars represent standard error.
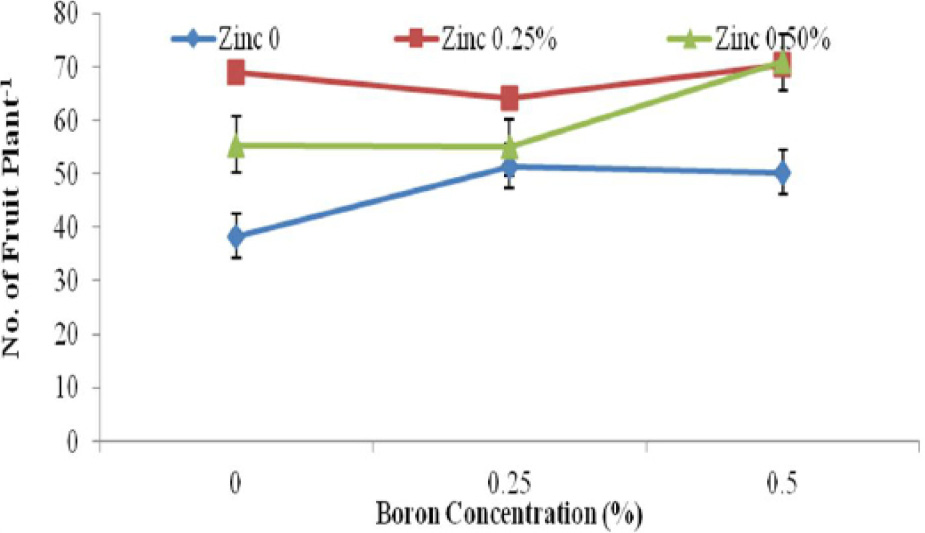
The interaction of B and Zn application on the number of fruits plant-1 of tomato. The vertical bars represent standard error.


