

Effect of Aging on Meiosis Progression, Developmental Competence and DNA Double-Strand Breaks in Mouse Oocytes


Effect of Aging on Meiosis Progression, Developmental Competence and DNA Double-Strand Breaks in Mouse Oocytes
Lei Gao1, Gong-xue Jia2, Zheng-yuan Huang1, Ming-xing Yue3, Chao Zhang1, Shi-en Zhu1 and Xiang-wei Fu1,*
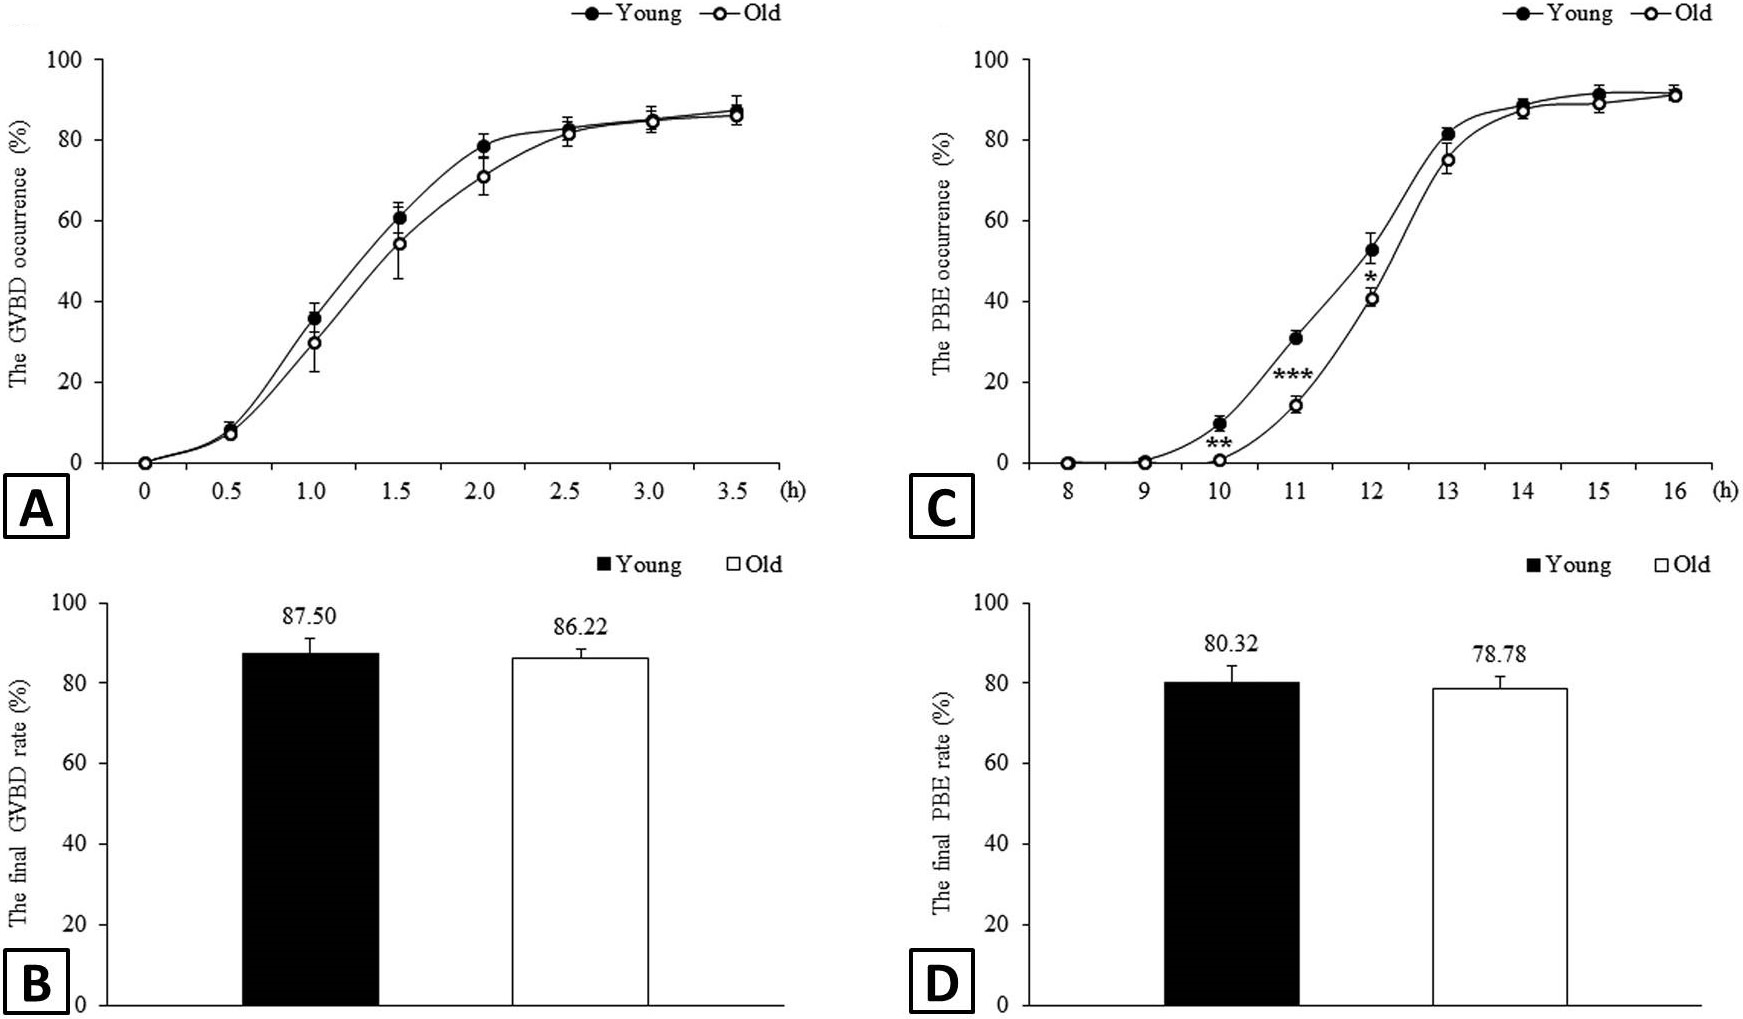
Kinetics of GVBD and PBE during oocyte maturation. Shown are the temporal trends of GVBD (A) and PBE (C) occurrence during IVM and the final rates of GVBD (B) and PBE (D) in oocytes. Number of oocytes analysed in total: n = 150 in the young group; n = 147 in the aged group. *P< 0.05, **P< 0.01, ***P< 0.001.

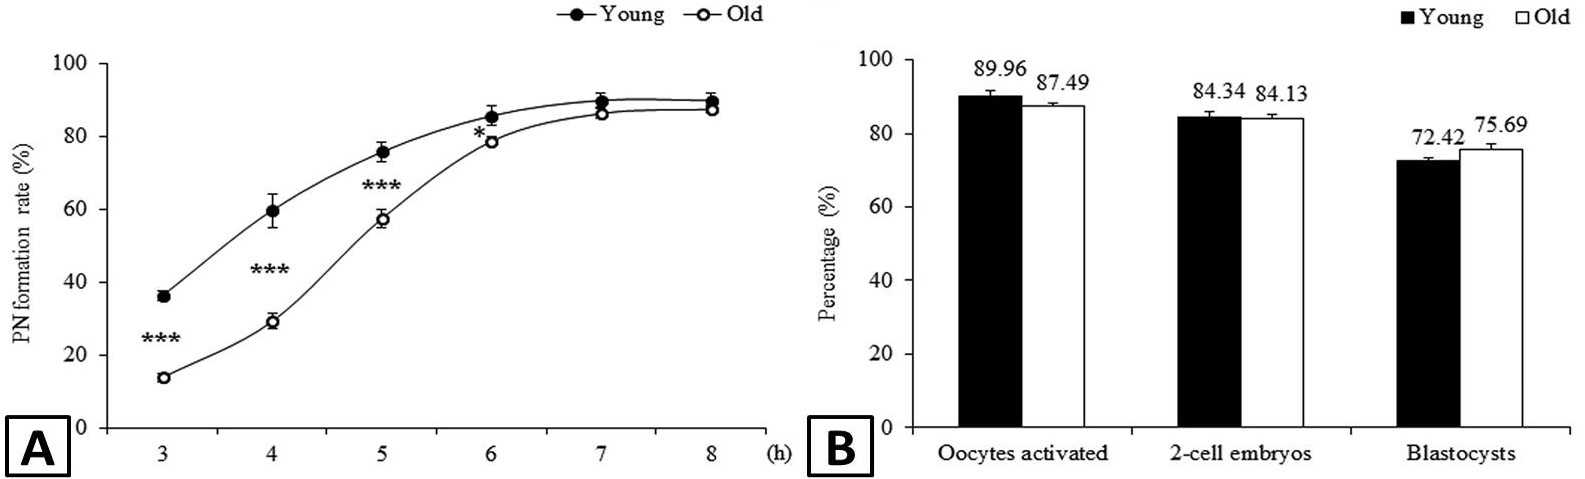
Kinetics of PN formation in PA embryos. Shown were the temporal trends of PN formation (A) and the percentages of activated oocytes, 2-cell embryos and blastocysts (B). Number of oocytes analysed in total: n = 193 in the young group; n = 183 in the aged group.

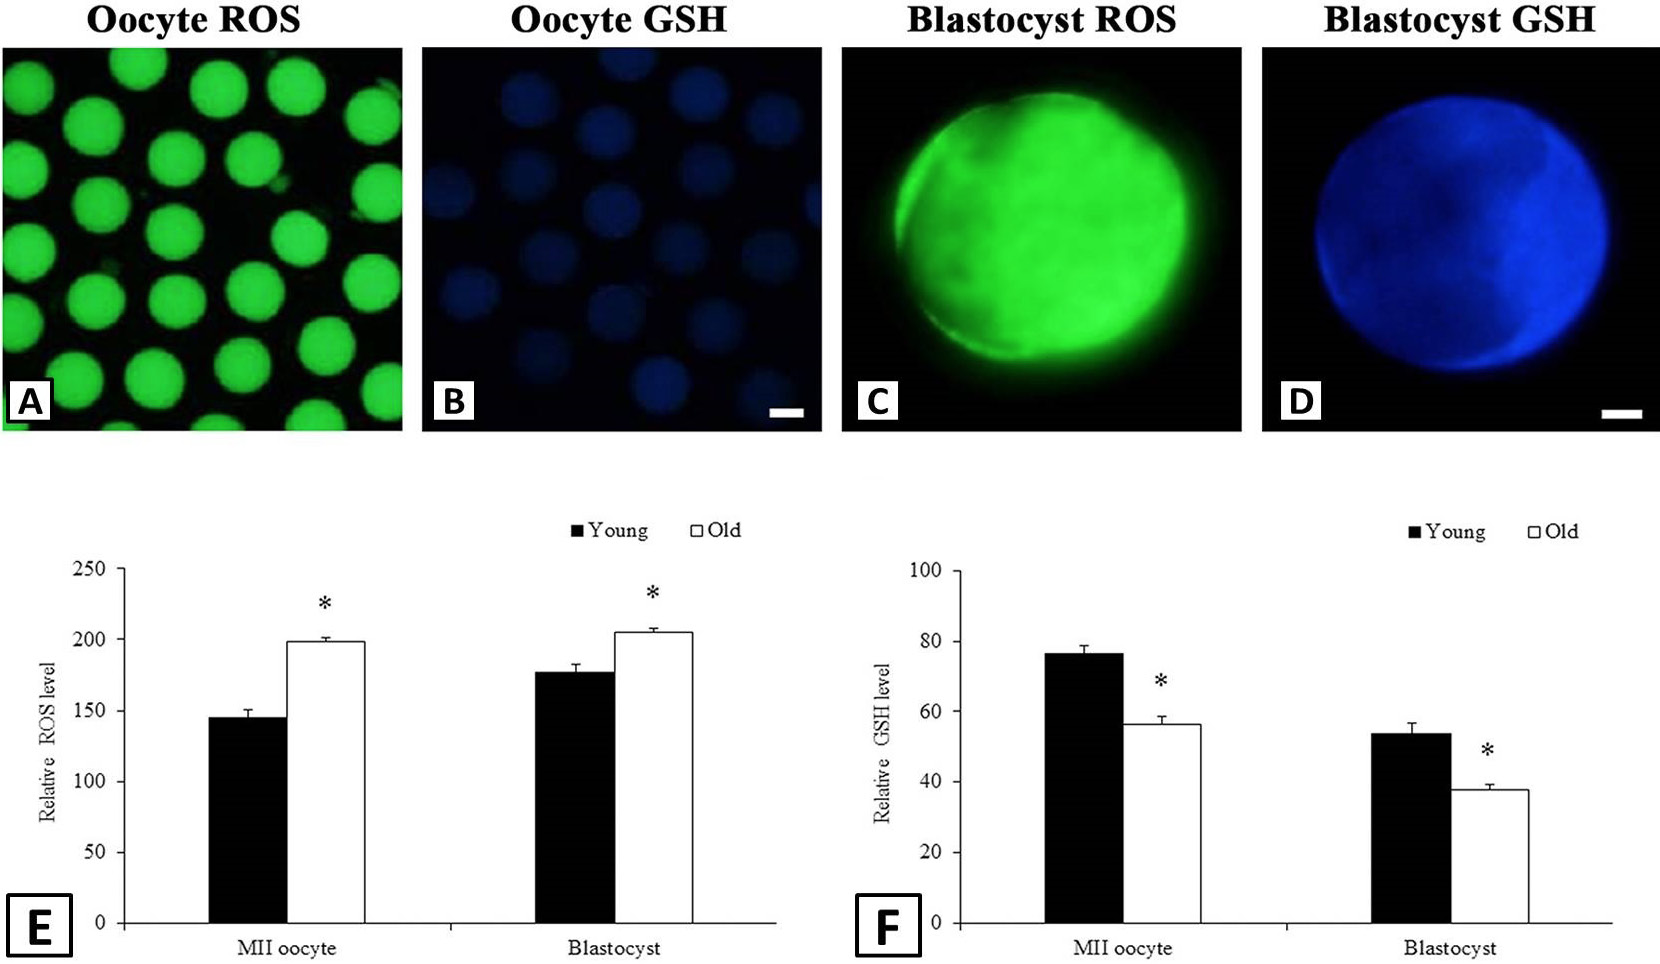
Intracellular ROS and GSH levels in MII oocytes and blastocysts. Shown were representative images of ROS (A) and GSH (B) in MII oocytes. C and D were the representative images of ROS and GSH, respectively in blastocysts. The quantitative results from fluorescence intensities of ROS (E) and GSH (F) in MII oocytes and blastocysts, respectively. At least 25 MII oocytes or blastocysts were analysed for each treatment per group. Scale bar is 50 μm in A and B and 20 μm in C and D.
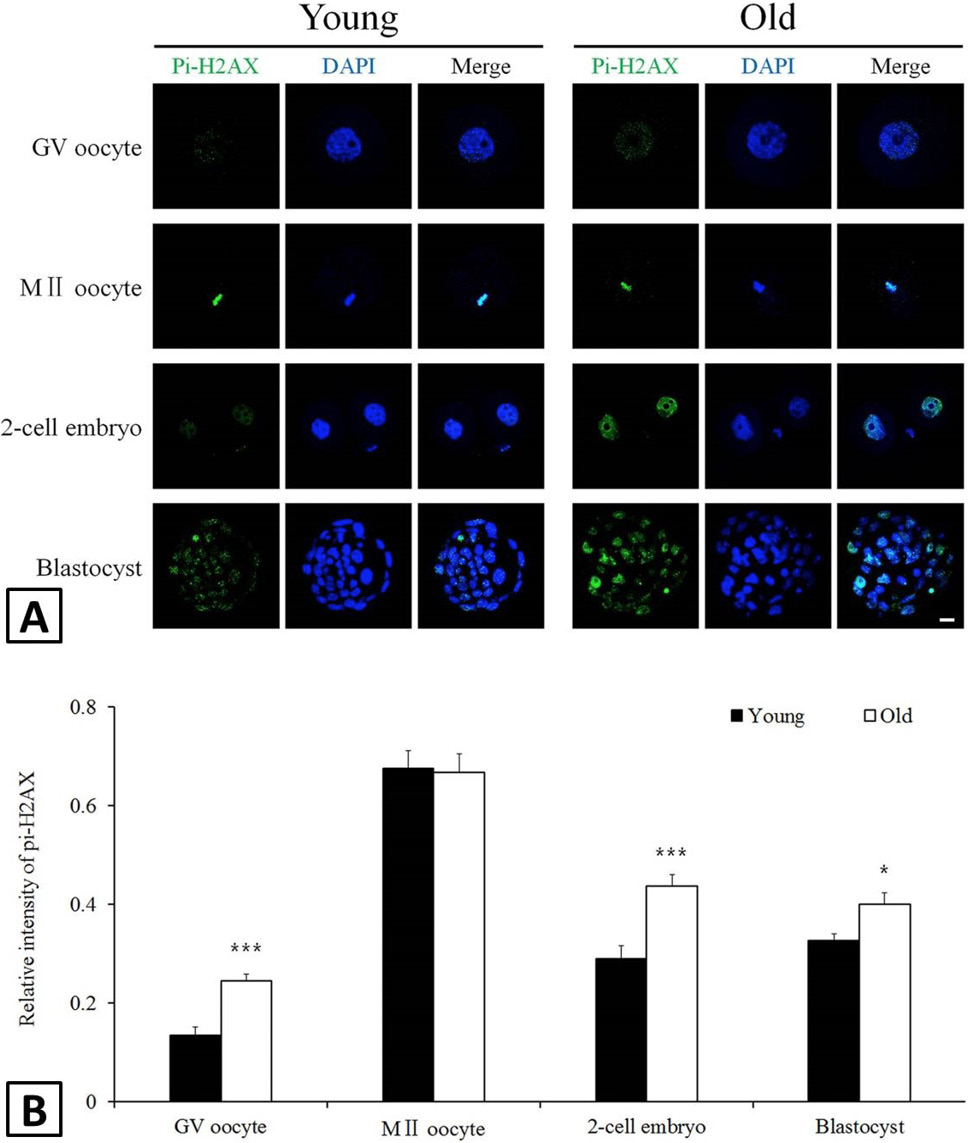
Immunofluorescent staining of DNA DSBs in oocytes and early embryos. A, representative images of oocytes and early embryos stained with pi-H2AX antibody (green) and DAPI (blue). Scale bar = 20 μm. B, relative intensities of pi-H2AX signals normalized against DNA signals. At least 25 oocytes or early embryos were analysed at each stage per group.


