
Effect of Sericin and Curcumin Mixture on Hematological Alternations Associated with Carrageenan Induced Paw Edema in Mice


Effect of Sericin and Curcumin Mixture on Hematological Alternations Associated with Carrageenan Induced Paw Edema in Mice
Sehrish Ashraaf1, Hafiz Muhammad Tahir1*, Chand Raza1, Ayesha Muzamil1, Farman Ahmad Chaudhary2, Muhammad Summer1 and Aamir Ali1
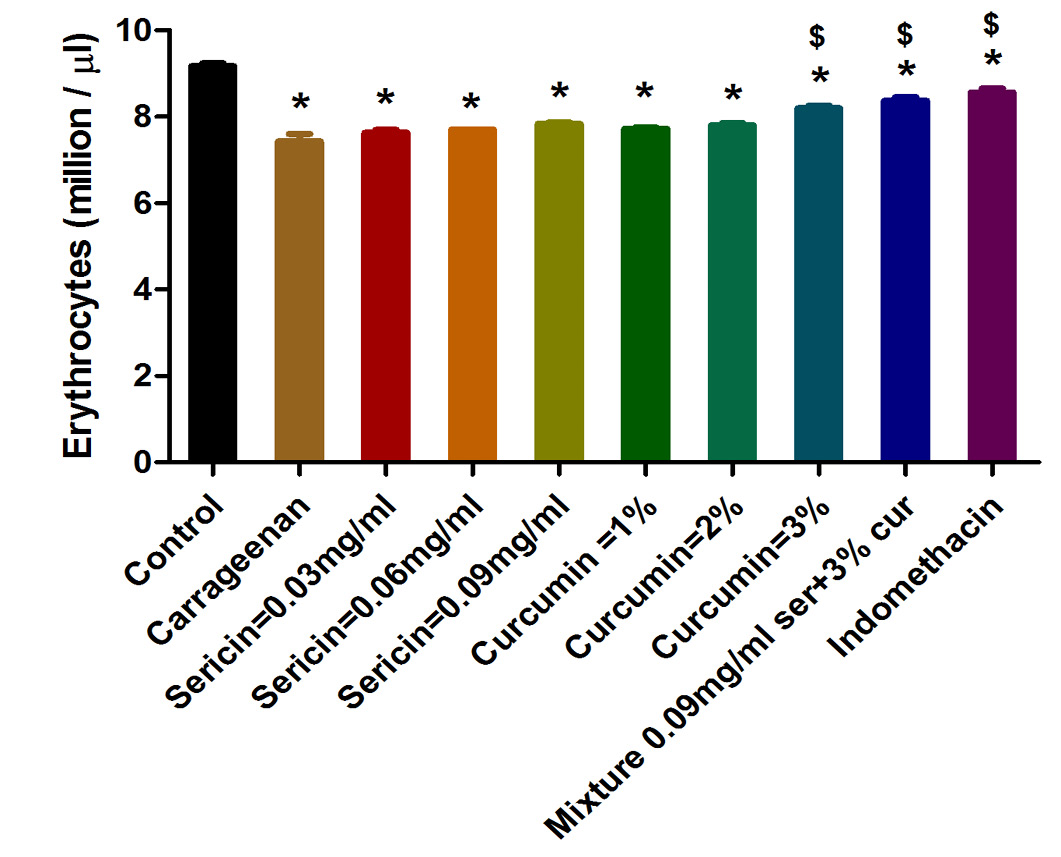
The effect of different doses of sericin, curcumin and their mixture observed on the Erythrocytes count compared with the control and carrageenan (alone) induced group. Each value shows the mean ± SD (n=6). The data was analyzed by one way ANOVA followed by Bonferroni’s Multiple Comparison Test, * shows the significance (P < 0.05) in comparison to control and $ shows the significance (P< 0.05) in comparison to carrageenan.

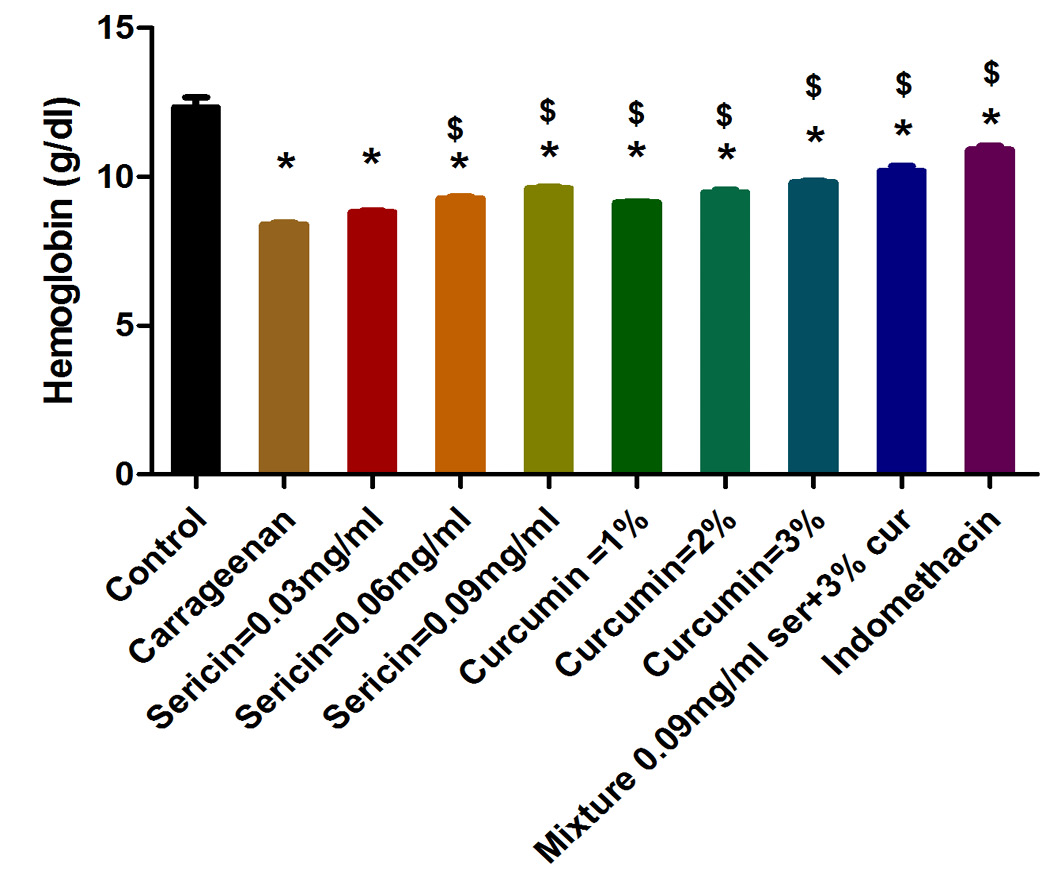
The effect of different doses of sericin, curcumin and their mixture observed on the Hemoglobin count compared with the control and carrageenan (alone) induced group. See Figure 1 caption for statistical analysis.
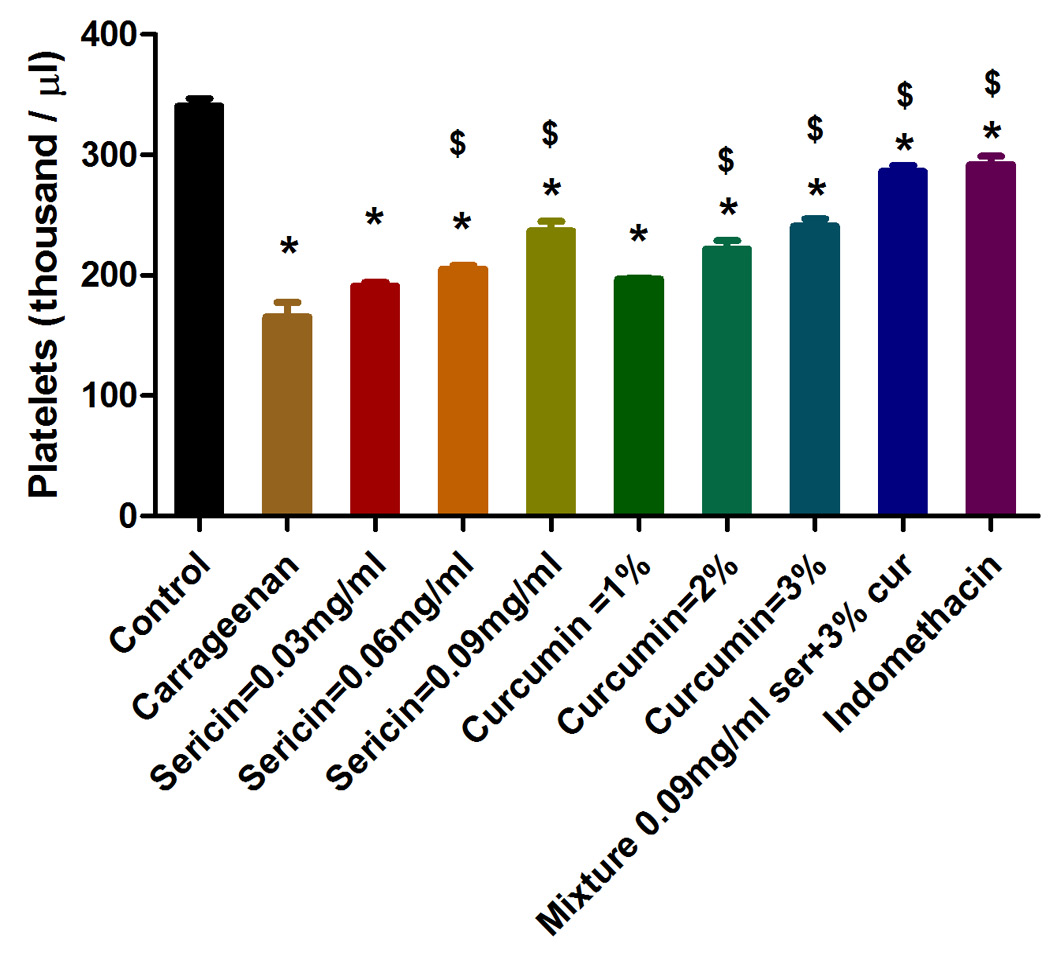
The effect of different doses of sericin, curcumin and their mixture were on the Platelet count compared with the control and carrageenan (alone) induced group. See Figure 1 caption for statistical analysis.

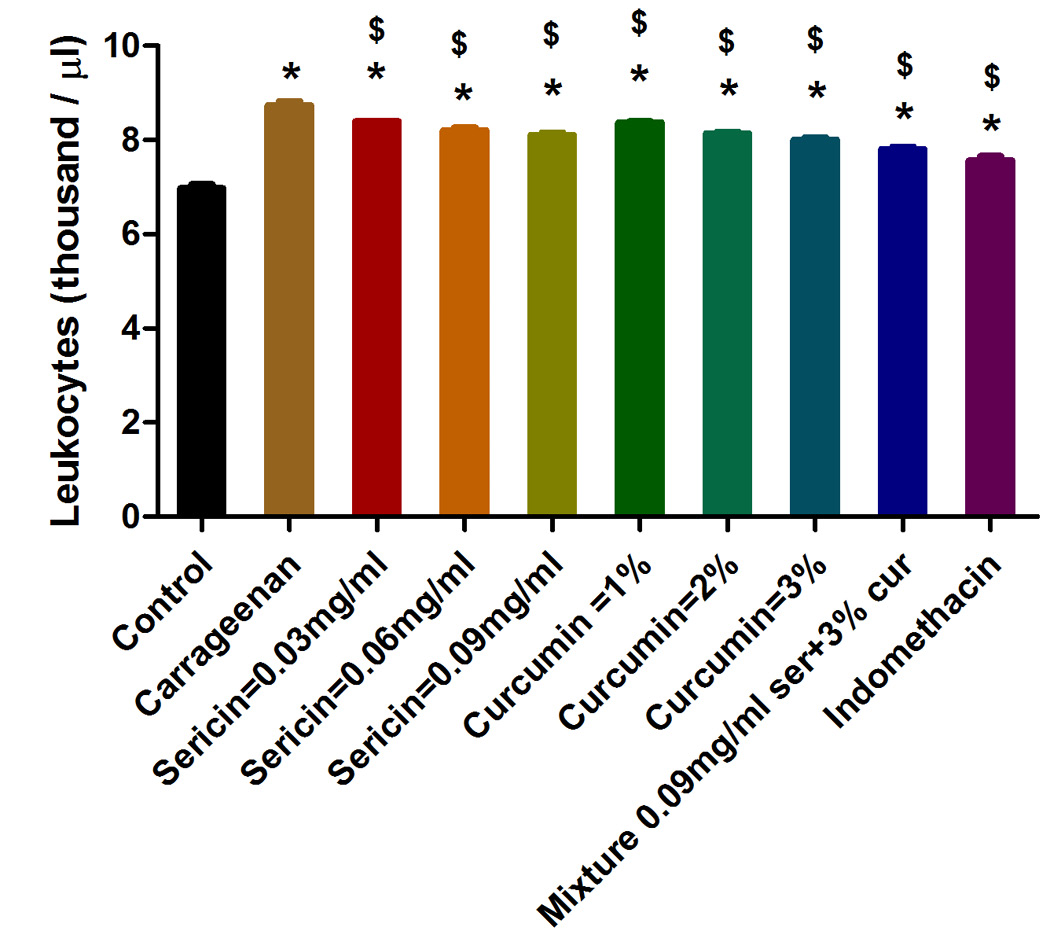
The effect of different doses of sericin, curcumin and their mixture observed on the leukocyte count compared with the control and carrageenan (alone) induced group. See Figure 1 caption for statistical analysis.

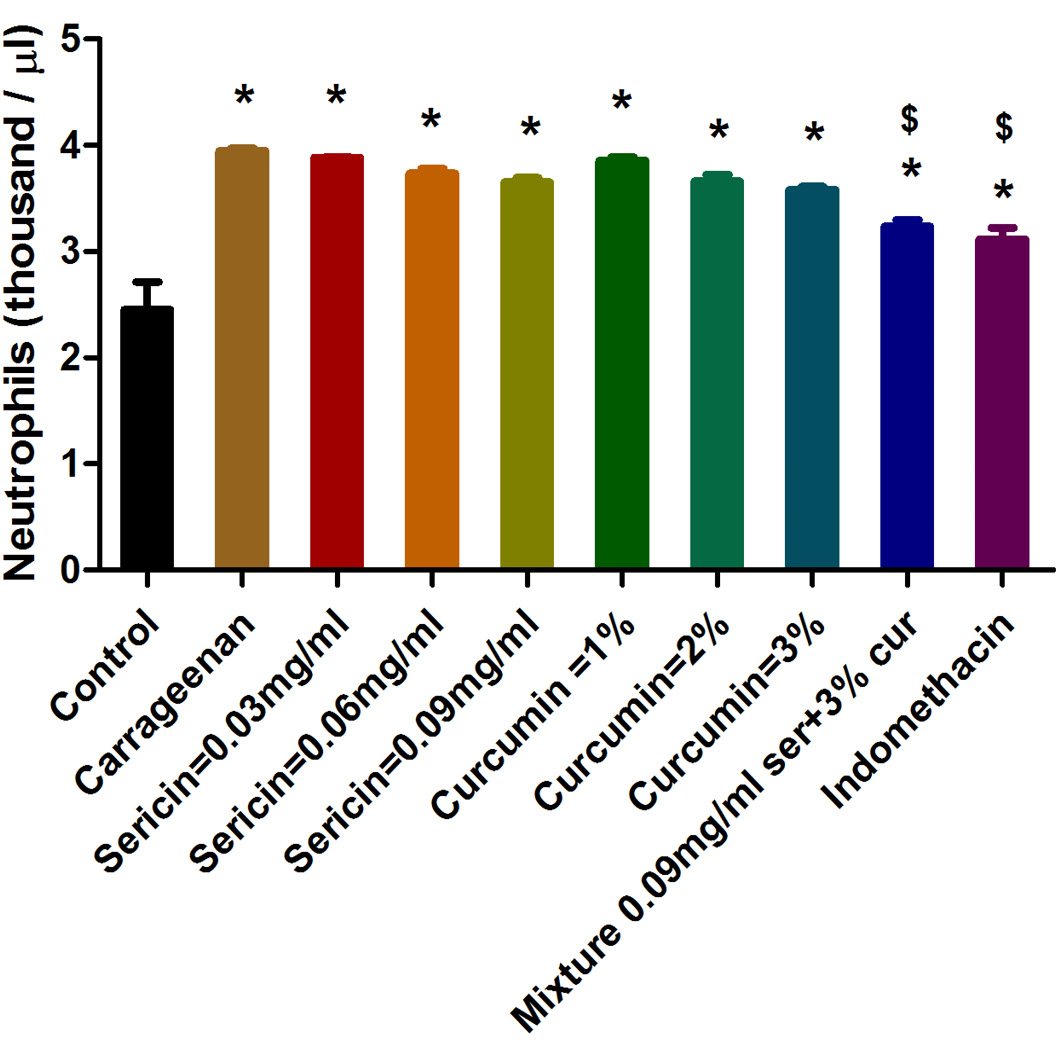
The effect of different doses of sericin, curcumin and their mixture observed on the Neutrophil count compared with the control and carrageenan (alone) induced group. See Figure 1 caption for statistical analysis.

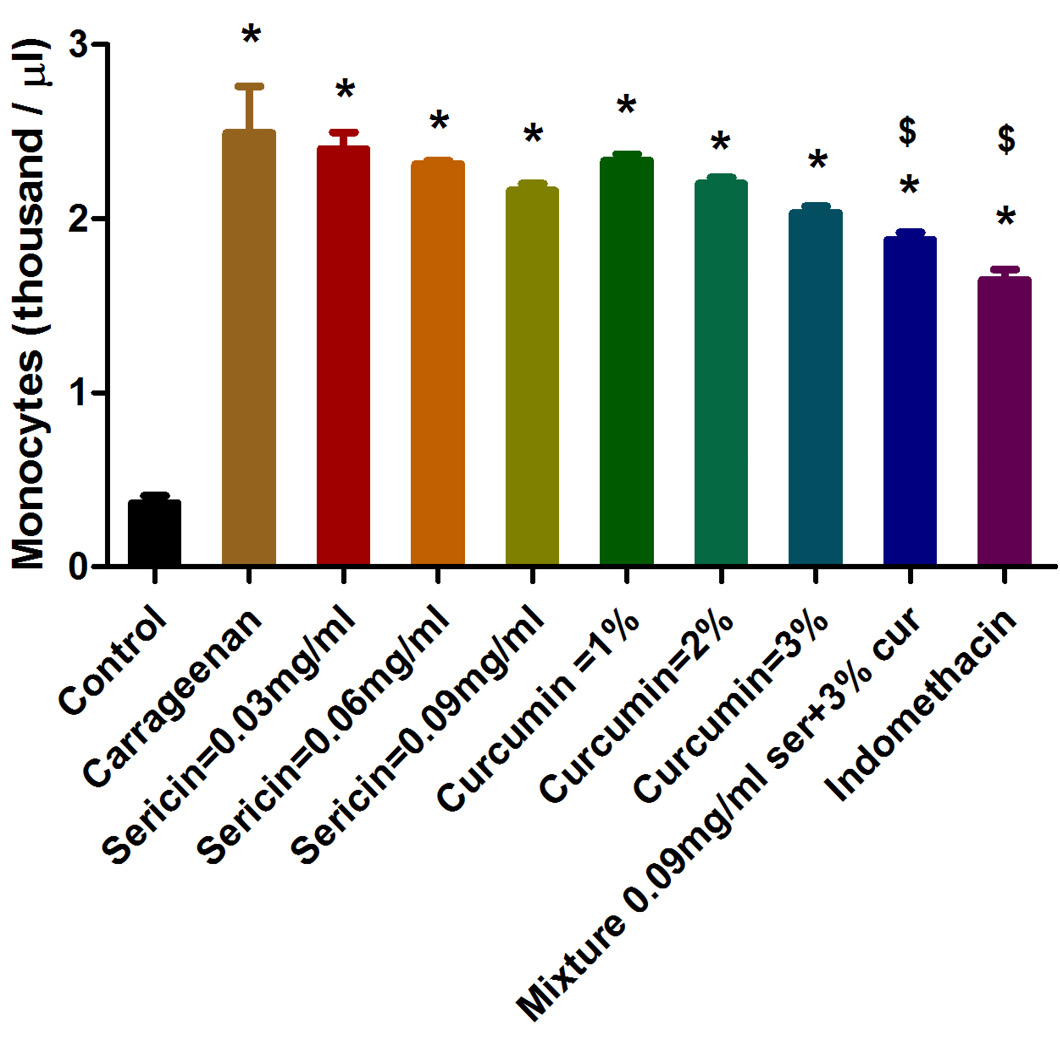
The effect of different doses of sericin, curcumin and their mixture observed on the Monocyte count compared with the control and carrageenan (alone) induced group. See Figure 1 caption for statistical analysis.
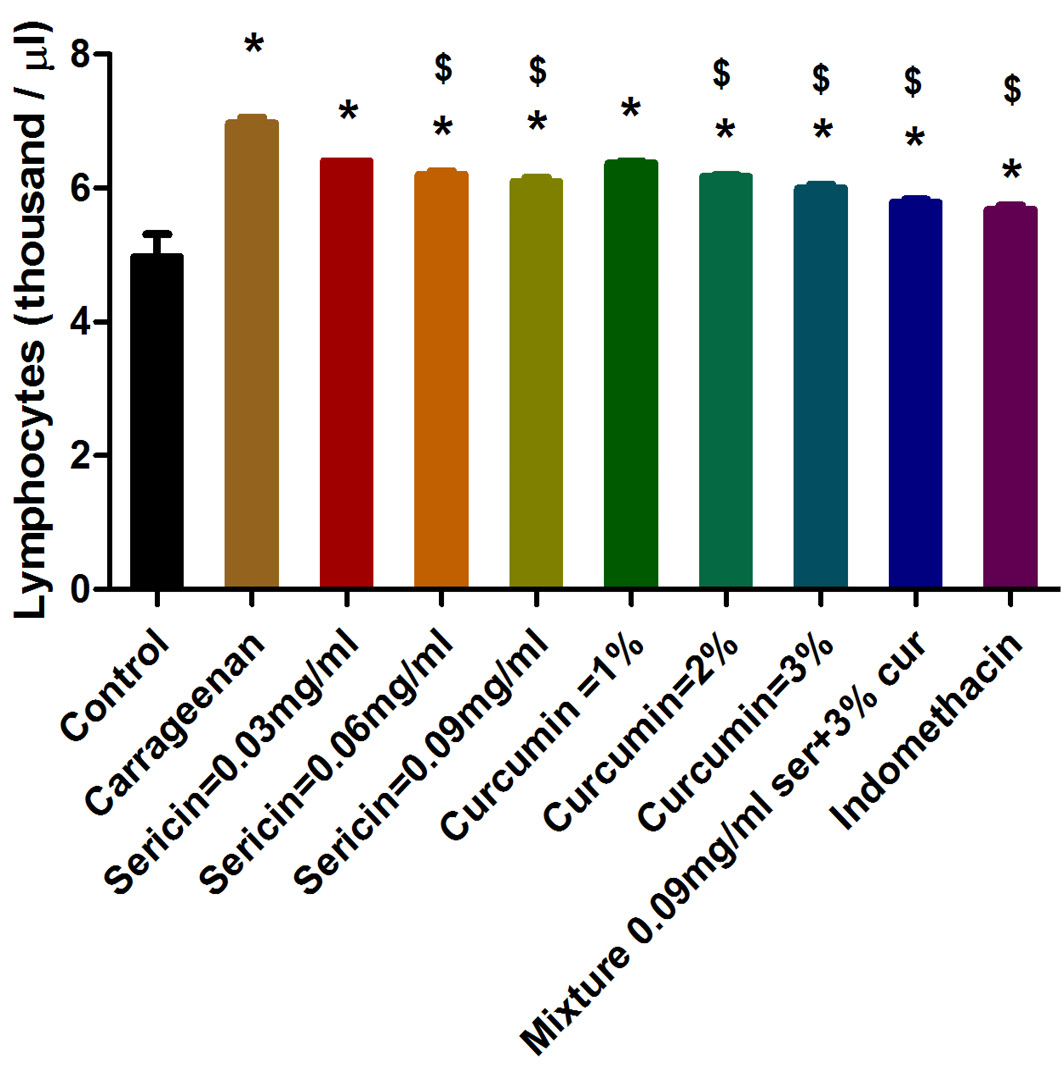
The effect of different doses of sericin, curcumin and their mixture observed on the lymphocyte count compared with the control and carrageenan (alone) induced group. See Figure 1 caption for statistical analysis.
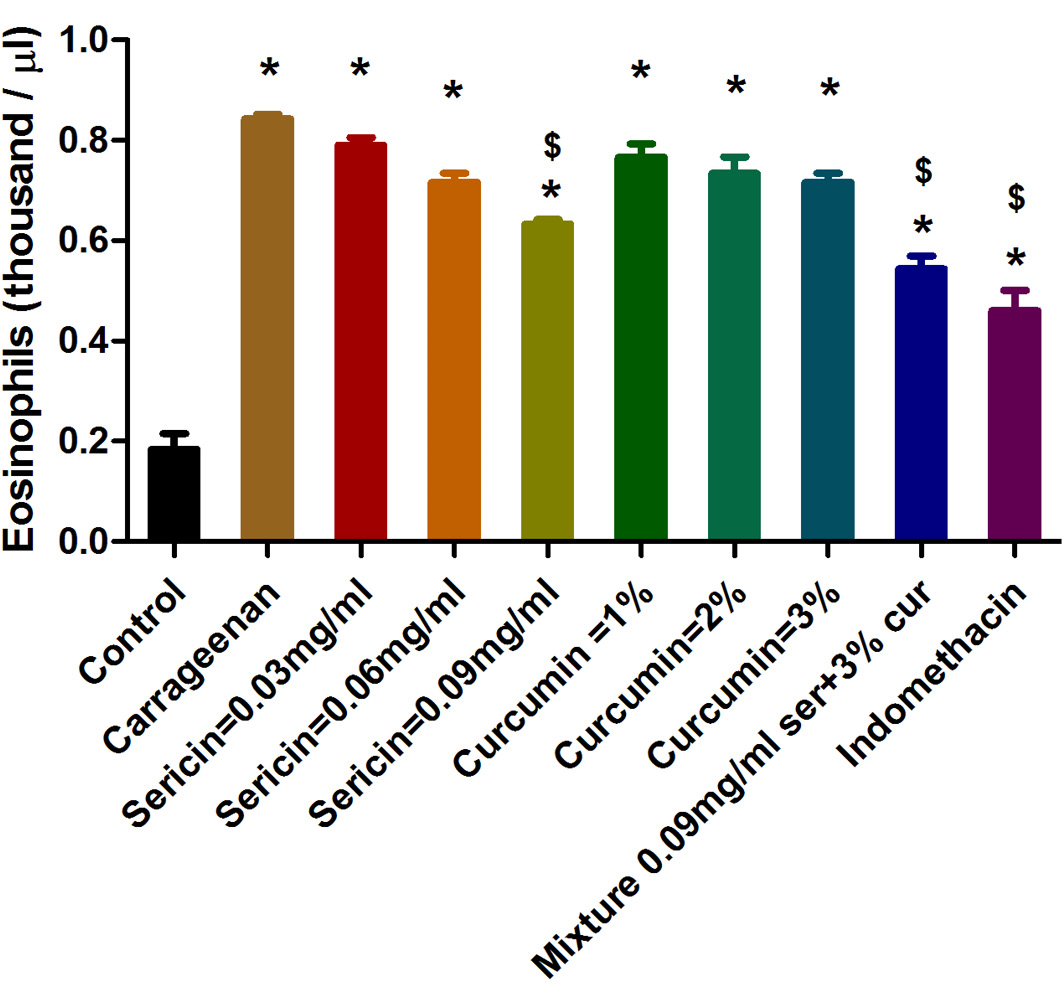
The effect of different doses of sericin, curcumin and their mixture observed on the Eosinophil count compared with the control and carrageenan (alone) induced group. See Figure 1 caption for statistical analysis.
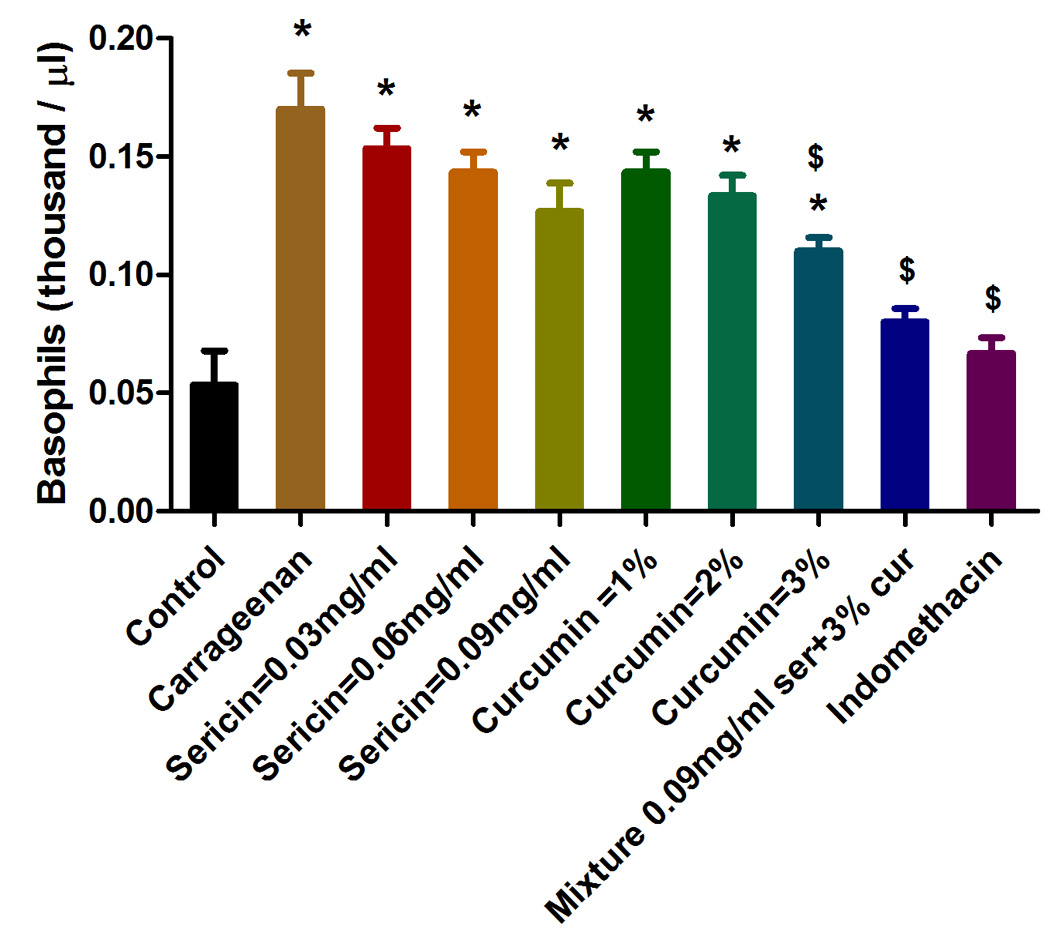
The effect of different doses of sericin, curcumin and their mixture observed on the Basophil count compared with the control and carrageenan (alone) induced group. See Figure 1 caption for statistical analysis.
