Effect of Rock Phosphate Augmented with Humic Acid on Phosphorus uptake and Yield of Wheat (Triticum aestivum L.)
Effect of Rock Phosphate Augmented with Humic Acid on Phosphorus uptake and Yield of Wheat (Triticum aestivum L.)
Sonia Sumreen1, Muhammad Sharif2, Tariq Sultan1 and Ijaz Ali1*
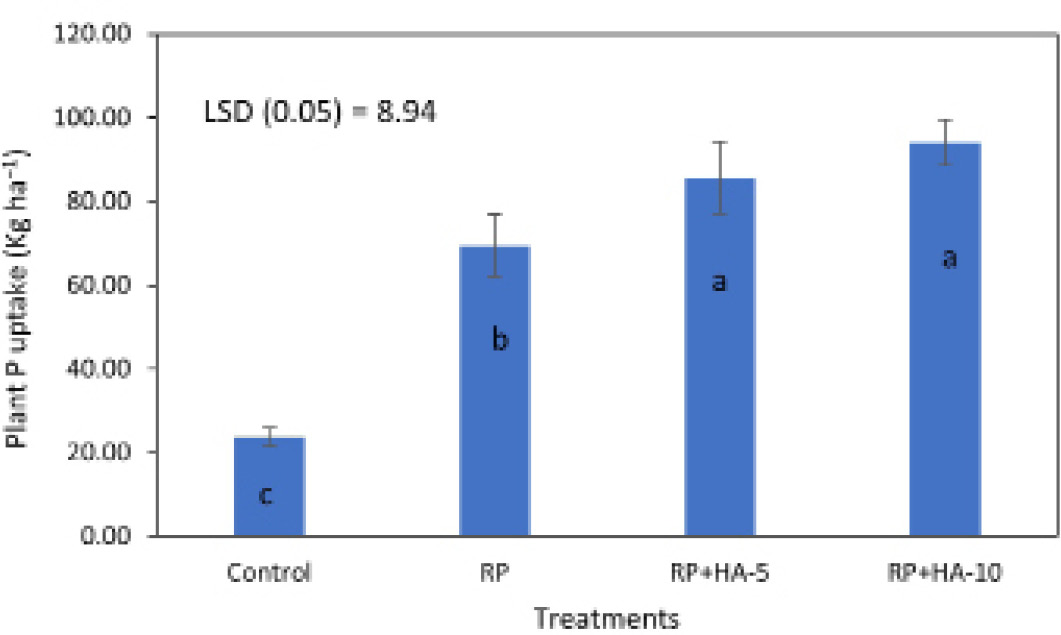
Effect of rock phosphate with and without different levels of humic acid on P uptake by wheat. Where RP, rock phosphate; RP+HA-5, rock phosphate with humic acid @ 5 kg ha-1; RP+HA-10, rock phosphate with humic acid @ 10 Kg ha-1. Bars having different letter(s) are significantly different at P ≤ 0.05.
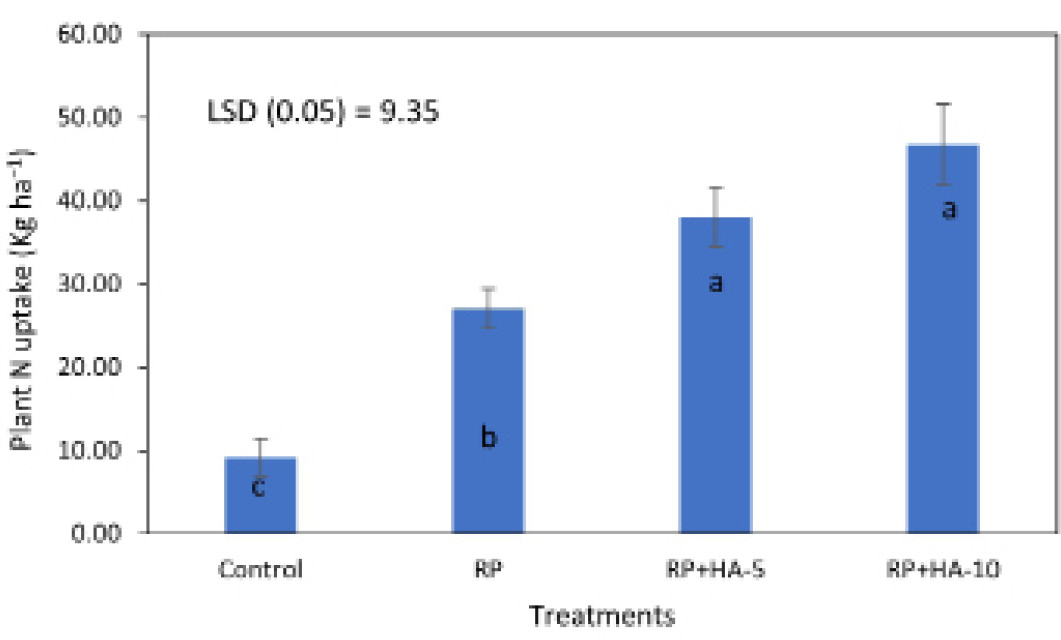
Effect of rock phosphate with and without different levels of humic acid on N uptake by wheat. Where RP, rock phosphate; RP+HA-5, rock phosphate with humic acid @ 5 kg ha-1; RP+HA-10, rock phosphate with humic acid @ 10 Kg ha-1. Bars having different letter(s) are significantly different at P ≤ 0.05.
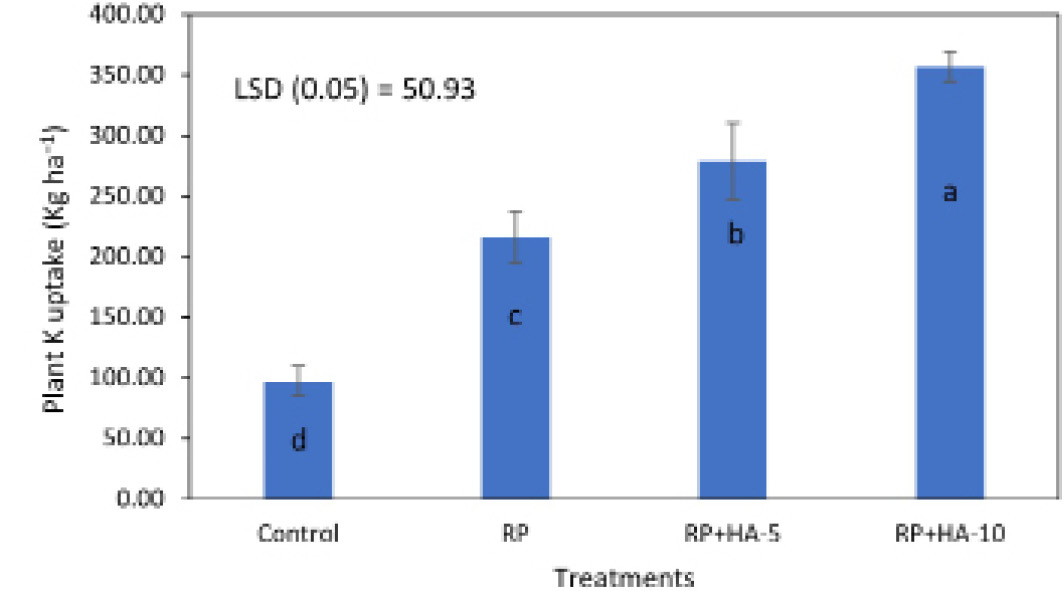
Effect of rock phosphate with and without different levels of humic acid on K uptake by wheat. Where RP, rock phosphate; RP+HA-5, rock phosphate with humic acid @ 5 kg ha-1; RP+HA-10, rock phosphate with humic acid @ 10 Kg ha-1 Bars having different letter(s) are significantly different at P ≤ 0.05.
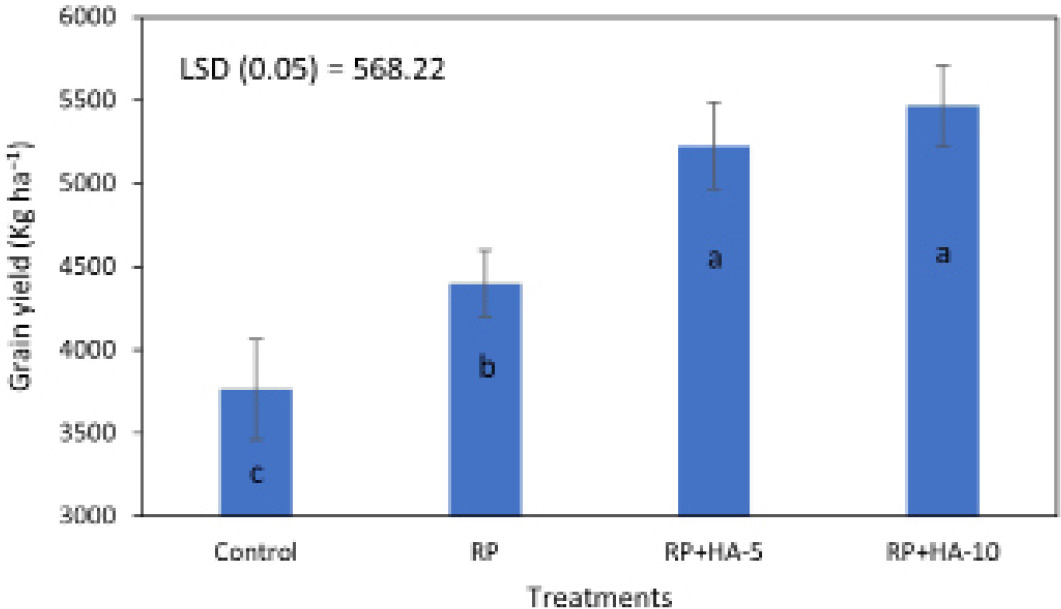
Effect of rock phosphate with and without different levels of humic acid on grain production of wheat. Where RP, rock phosphate; RP+HA-5, rock phosphate with humic acid @ 5 kg ha-1; RP+HA-10, rock phosphate with humic acid @ 10 Kg ha-1 Bars having different letter(s) are significantly different at P ≤ 0.05.
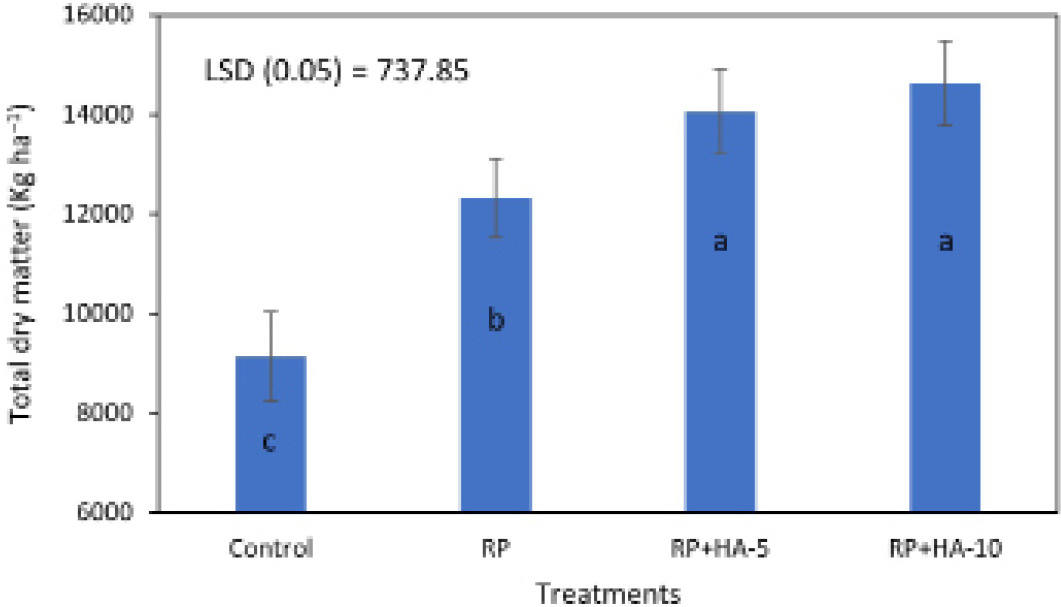
Effect of rock phosphate with and without different levels of humic acid on total dry matter production of wheat. Where RP, rock phosphate; RP+HA-5, rock phosphate with humic acid @ 5 kg ha-1; RP+HA-10, rock phosphate with humic acid @ 10 Kg ha-1 Bars having different letter(s) are significantly different at P ≤ 0.05.
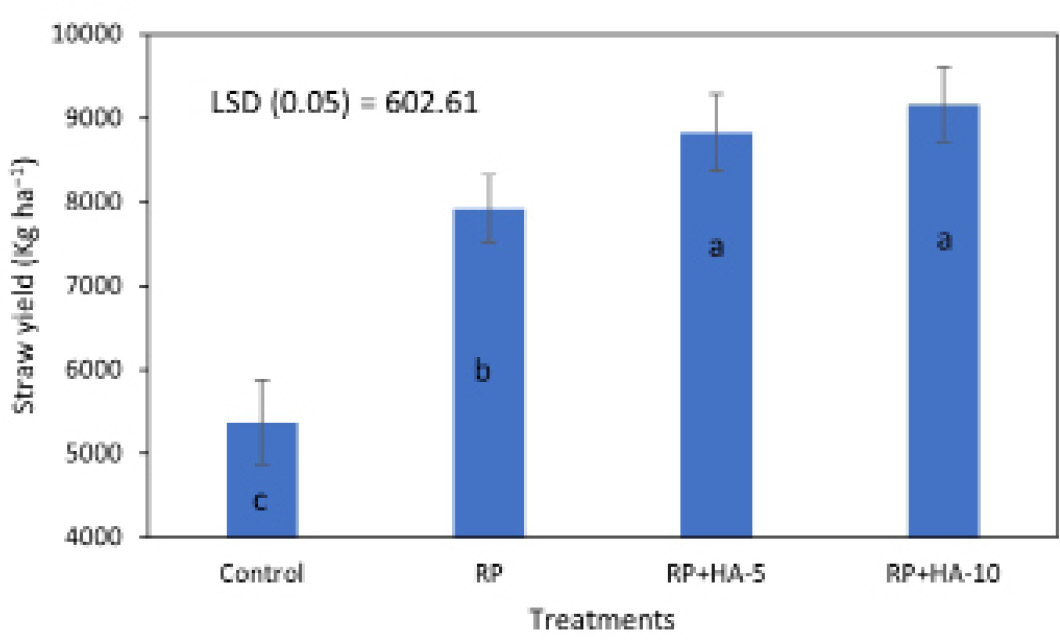
Effect of rock phosphate with and without different levels of humic acid on straw production of wheat. Where RP, rock phosphate; RP+HA-5, rock phosphate with humic acid @ 5 kg ha-1; RP+HA-10, rock phosphate with humic acid @ 10 Kg ha-1 Bars having different letter(s) are significantly different at P ≤ 0.05.


