
Economics of Milk Production in District Mardan, Khyber Pakhtunkhwa (KP), Pakistan


Research Article

Economics of Milk Production in District Mardan, Khyber Pakhtunkhwa (KP), Pakistan
Neelum Andaleeb* and Munir Khan
Department of Agricultural and Applied Economics, University of Agriculture Peshawar, Khyber Pakhtunkhwa, Pakistan.
Abstract | This study is conducted to find out the cost and net return of milk production in district Mardan. The aim of this study was to identify factors affecting milk production in the study area. A multistage sampling method was used to select a sample of 274 livestock farm households from 6 union councils, and a well-structured questionnaire was used to collect data from the female respondents through face to face interview. Cobb-Douglas production function and cost benefit analysis were used to arrive at the main conclusion. Results show that feed cost was the major component of total cost followed by labor cost. Average milk produced by buffalo and cow was 180 and 135 liters per month, respectively. Average total costs of milk production of buffalo and cow were Rs.12835 and Rs.10070 per month respectively whereas the average net income per liter from the buffalo and cow milk was Rs. 29 and Rs. 5 thus benefit-cost ratios for buffalo and cow is1:1.43 and 1:1.07, respectively, which show buffaloes were more productive and profitable than cows. Results from Cobb-Douglas production function analysis show that dry fodder, green fodder and daily labor hours have positive significant effect on milk production, while herd size has negative significant effect. Furthermore, the addition of estimated coefficients is less than 1, indicating a decreasing return to scale in milk production. These results suggest that small sized dairy farms are more productive and profitable; however, farmers need to utilize each input at its allocatively efficient level in order to get maximum profit.
Received | August 29, 2016; Accepted | January 30, 2017; Published | February 21, 2017
*Correspondence | Neelum Andaleeb, Department of Agricultural and Applied Economics, University of Agriculture Peshawar, Pakistan; Email: neelumandaleeb@gmail.com
Citation | Neelum, A. and M. Khan. 2017. Economics of milk production in District Mardan, Khyber Pakhtunkhwa (KP), Pakistan. Sarhad Journal of Agriculture, 33(1): 42-46.
DOI | http://dx.doi.org/10.17582/journal.sja/2017.33.1.42.46
Keywords | Milk production, Multistage sampling, Profitable cost-benifit-ratio, Cobb-Douglas production function
Introduction
Livestock is a significant sub-sector of agriculture and occupies a distinctive position in Pakistan’s current plan for economic development. Livestock sector contributes 56.3 percent to the value added by agriculture sector and approximately 12 percent to the national GDP. Livestock have increased value of gross addition from Rs. 778 billion to Rs. 801 billion in 2013-14 to 2014-2015 so a total 3 percent increased is observed from the previous year (GoP, 2014-15). In Pakistan more than 8 million rural families are concerned in livestock and is the main source of their occupation (GoP, 2014-15). Thus development of livestock sector can play a significant part in rural poverty reduction through uplifting the socioeconomic situation of the rural poor. Buffalo, cow, sheep, goat, camels, horses, asses and mules are the main livestock in Pakistan. While main products of these livestock are, meat, milk, wool, bones, fat, eggs, hides and skins. Milk and meat are regarded as significant product among all the livestock products. In addition, livestock are also used for draught purposes.
One of a significant product of livestock is milk. The milk production in Pakistan during 2014-2015 was 52632 thousand tones (GoP, 2014-15). Dairy products and fresh milk form an important element of our diet. In many countries household spend a significant part of their income on dairy products and milk. Similarly in developing countries like in Pakistan dairy product and milk also form a significant part of their daily diet. According to a review dairy product and milk accounts approximately 27 percent of the total household daily expenses in Pakistan (Seale et al., 2003). Livestock therefore play important role in Pakistan’s agriculture not only in terms of milk and milk product but also through other products like mutton beef eggs and poultry which form an important part of household diet. Milk also form one of a significant livestock product in terms of market value.
In Khyber Pakhtunkhwa, livestock accounts for approximately 17 percent of the provincial gross domestic product (GDP). According to the Livestock Census (2014), the local livestock herd of Khyber Pakhtunkhwa comprise of 7.7 million domestic animals, 2.4 million buffaloes, 0.07 million camel, 3.7 million sheep and 11.07 million goats(GoKP, 2014).
Justification of the study
Although the significance of milk and milk product is well accepted by the society but yet studies regarding milk production and its determinants are insufficient in Pakistan in general and in Khyber Pakhtunkhwa province in particular. For achieving self-reliance in food grains has led the policy makers and researchers to center their concentration on increasing the output of major food crops. Thus development of livestock sector can also play an important role in rural poverty alleviation through uplifting the socioeconomic conditions of the rural poor because more than 8 million people are involved in this sector and this sector is therefore considered as an economic engine for poverty alleviation and food security (GoP, 2014-15). Therefore keeping in view the significance of livestock in socio-economic transformation as well as maintaining the agricultural sustainability and the economic viability of poor farmers in developing countries like Pakistan in general and district Mardan in particular, the study in hand is initiated to address the issues pertaining to the dairy sector. The exact objectives of the research are as follow:
- 1. To study the socioeconomic characteristics of dairy farmers.
- 2. To estimate the cost and return realized by farmers from milk production.
- 3. To identify factors affecting milk production.
Materials and Method
Study area and sampling technique
Mardan is one of the leading livestock production districts of Khyber Pakhtunkhwa. According to the livestock census 2014 the local distric Mardan livestock herd comprises of 0.6 million total domestic animals, 0.2 million cattle 0.11 million buffaloes, 0.05 million sheep and 0.20 million goats. Even though the importance of milk as a product is well established, yet research studies pertaining to milk is insufficient in Khyber Pakhtunkhwa in general and district Mardan in particular.
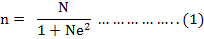
A multistage sampling technique was used for selecting the sample. In the first stage out of three tehsils (Mardan, Katlang and TakhtBhi) two tehsils namely Mardan and Katlang were selected purposively for having maximum number of livestock farms. Each tehsil was further divided into urban and rural union councils (UCs) and three rural UCs were randomly selected from each. In the final stage, households in each selected union council were divided into livestock farmers and others. Households from livestock farmers were selected randomly. Thus a total 274 households were selected and number of households from each union council was selected based on Yamane’s formula (Yamane, 1967) that is:
 c
c
Where:
n: Sample size in each union council; N: Total number of household having livestock in ith union council; e:Precision which is set at 16% (0.16)
Data collection
A well-designed questionnaire was used to collect data from the selected farmers using face to face interview. Efforts were made to keep it simple and understandable so as to capture all the necessary information. The questionnaire was first translated in to Urdu and was pretested on 43 respondents. Final changes were made in the light of results from pretested questionnaire. Data collection was started in December 2015 and was completed in January 2016.
Data analysis
Total cost of milk production was estimated by from fixed cost and variable cost on livestock. The estimation of fixed cost includes depreciation in the value of milking animals, shed, machinery, and interest cost on own as well as borrowed capital (Chaudhry and Ahmad, 1996). These costs were determined by the methods as reported by (Ahmad et al., 1996; Chaudhary and Ahmad, 1996) where milch animal depreciation was charged approximately 5.5 percent. There were 3 types of livestock sheds in the study areas, pakka kacha (concrete, mud) and mixed type. Depreciation on the current values of shed was charged @ 2.5 percent, 5.0 percent and 4.0 percent for concrete, mud and mixed type sheds annually, respectively. Cost on shed per milch animal unit was calculated by dividing the total cost on shed by total number of animal units per farm per annum. All these values were then adjusted for monthly and daily calculations for analysis.
The components of variable costs for milk production were feeding, labor and other costs. Other costs for milk production include animal medicinal charges, artificial insemination, repairing charges of the equipments and electricity charges etc. Cost of both stable and occasionally hired labor, and opportunity cost of family labor busy in livestock farming were calculated on monthly basis. Then, labor cost per milch animal was derived as a ratio of total number of animal units per farm to total labor cost.
Returns from milk production per farm (per animal) were calculated by multiplying average monthly milk production per farm (per animal) with average price per liter. Net income per liter and benefit-cost ratios of milk production were also determined.
The following Cobb-Douglas type of production function was used as used by Shah et al. 2009 and Afridi et al. 2009 to determine factors affecting milk production. This study uses the same model to estimate milk production and also to trace out the return to scale in milk production.

Where:
Y: Milk yield (production per animals) in liters/ day; DF = Dry fodder (kg/day); GF: Green fodder (kg/day); LH; Labor (hrs/day); ED: Education of the head (years); HS: Herd size; C: Constant; βs: Coefficients with respect to (DF, GF, LH, ED, HS)
For ordinary least square (OLS) estimation it can be transformed in to a linear form by taking log on both sides of equation 2.

In this transformed model, β1, β2, β3, β4 and β5 are the elasticities of output with respect to DF, GF, LH, ED and HS, respectively. Also the summation of β1, β2, β3, β4 and β5 represent return to scale for the production function.
One of the drawback in Cobb-Douglas type of production function is the existence of single stage production function that could either exhibit a diminishing return to scale (β1 + β2 + β3+ β4+ β5 < 1), constant return to scale (β1 + β2 + β3+ β4+ β5 = 1) or increasing return to scale (β1 + β2 + β3+ β4+ β5>1).
Results and Discussion
Socioeconomic characteristics of the Respondents
Before discussing the cost and returns of milk production, this section discusses the socioeconomic characteristics of the livestock farmers. Survey data show that all of the selected households are headed by a male member. They are on average 48 years old, and their education level is on average 5 years of schooling. Household size is on average 9.45 individuals and average monthly income is Rs. 49184. A Land holding of the selected households is on average 5acres, and 31 percent of them are tenants. Buffaloes and cows are their main milk producing animals. The average number of milch cows and buffaloes per farm is1 and 0.72, respectively.
Estimated cost of milk production
As discussed in the materials and methods section, the fixed cost includes depreciation charges on milch animals, shed and machinery, and interest on capital invested. Table 1 shows that the overall total fixed cost per farm on milch animals is Rs.1512.05per month in the study area and that major part of this sum is animal depreciation cost (47.90% of the total fixed cost) and interest (47.29% of the total fixed cost). For buffalo and cow, the monthly fixed costs are Rs.1085 and Rs.720, respectively. The same Table (1) show that total average variable cost per farm on milch animals is Rs. 17927.50/-per month. Out of this variable cost, feed cost, labor cost and other costs
Table 1: Cost and return estimates
| No. | Cost/quantity/return | Particulars | Farm level | Buffalo | Cow |
|
1.
|
Variable cost
|
Feed cost (green+ dry) | 10777.50 (60.12%) | 6750.00 (57.45%) | 5850.00 (62.57%) |
| Labor cost | 3779.00 (21.08%) | 2300.00 (19.57%) |
2100.00 (22.46%) |
||
| Other cost | 3371.00 (18.80%) | 2700.00 (22.98%) | 1400.00 (14.97%) | ||
| Total variable | 17927.50 (100.00) | 11750.00 (100.00) | 9350.00 (100.00) | ||
|
2.
|
Fixed cost
|
Shed cost | 72.85 (4.82%) | 45.00 (4.15%) | 40.00 (5.56%) |
| Interest cost | 715.00 (47.29%) | 500.00 (46.08%) | 350.00 (48.61%) | ||
| Animal cost | 724.20 (47.90%) | 540.00 (49.77%) | 330.00 (45.83%) | ||
| Total fixed | 1512.05 (100.00) | 1085.00 (100.00) | 720.00 (100.00) | ||
| 3. | Total cost | Fixed cost + Variable cost | 19439.55 | 12835.00 | 10070.00 |
|
4.
|
Quantity/ value
|
Milk yield per month (liters) | 266.40 | 180.00 | 135.00 |
| Value of milk (Rs.) | 23940.00 | 18000.00 | 10800.00 | ||
| Value of farm yard manure | 638.75 | 375.00 | 365.00 | ||
| 5. | Gross revenue | Milk value + Farm yard manure | 24578.75 | 18375.00 | 11165.00 |
| 6. | Net revenue | Gross revenue – Total cost | 5139.20 | 5540.00 | 1095.00 |
| 7. | Cost per liter | Total cost/ Milk yield per month | 72.97 | 71.31 | 75.00 |
|
8.
|
Profit
|
Profit per liter of milk | 27.03 | 28.69 | 5.04 |
| Benefit cost ratio | 1.26 | 1.43 | 1:1.07 |
are Rs. 10777.50(60.12%), Rs. 3779.00 (21.08%) and Rs. 3371.00 (18.80%), respectively. For buffalo and cow, the monthly variable costs are Rs. 11750 and Rs. 9350, respectively. The feed cost of buffalo is greater than the feed cost of cow by Rs. 900. The average estimated total cost per farm on milch animals is Rs. 19439.55/- per month. The total costs of milk production per cow and buffalo are Rs.10070 and Rs.12835, respectively.
Estimated gross revenue and net revenue from milk production
Table 1 shows that average monthly gross revenue from milk production per farm isRs.24578, while from buffalo and cow the figures are Rs. 18375 and Rs. 11165, respectively. The average monthly net revenue is estimated by subtracting average monthly total cost from average monthly gross revenue. The same Table (1) shows that average monthly net revenue from milk production per farm is Rs. 5139.20. The average net revenue from a buffalo is considerably more than average net income from a cow.
These outcomes reveal that livestock farming is a beneficial activity in the research area and that farmers can raise their profit by preferring/ rearing buffaloes for milk production.
Estimated milk production function
Before using the estimated results for discussion and policy recommendations, post estimation diagnostic tests are conducted to check for multicollinearity and hetroscadasticity problems. Variance inflation factor (VIF) test was conducted to check for multicollinearity. The mean VIF valueisless than 2, and the VIF values for each variable is also less than 2. This means that there is no multicollinearity problem in the estimated models. A Breusch-Pagan test was used for detection of heteroscadasticity problem. The chi square (χ2) value is less than 0.1 and the probability of rejecting the presence of heteroscadastic variance of the error term is more than 10 percent. This indicates that there is no hetroscadasticity problem in the estimated models.
OLS estimated results for Cobb-Douglas function for milk yield are given in Table 2. As discussed in methodology section, the estimated coefficient (β) for an explanatory variable represents the elasticity of milk yield with respect to that variable. Dry fodder and green fodder consumption and daily labor hours have positive significant effects on milk yield. Logically it means that as more and more dry and green fodder consumption increased milk yield will also increased. Similarly herd size has a negative significant effect on milk yield it means that as herd size increase management of livestock become difficult which negatively affect milk yield. The education level of the head of the household has insignificant coefficient; however, its positive sign is in accordance with prior expectations that is more educated people will get more milk yield from livestock because they have recent information about how to increase milk yield than those who is uneducated.
The addition of β1, β2, β3, β4 and β5 is less than 1, indicating a decreasing return to scale and that milk production at farm level is in stage-II of the production surface.
Table 2: OLS estimates of Cobb Douglas milk production function
| Factors | Coefficients | t-value | p-value | Mean value |
| Intercept | -0.10 | -0.32 | 0.75 | - |
| Dry Fodder (Kgs/day) | 0.13 | 1.76 | 0.09 | 8.00 |
| Green Fodder (Kgs/Day) | 0.17 | 1.80 | 0.07 |
10.05 |
| Daily labor ( hours) | 0.50 | 2.06 | 0.04 | 5.99 |
| Head education (years) | 0.14 | 0.71 | 0.48 | 5.00 |
| Herd size (numbers) | -0.41 | -5.30 | 0.00 | 2.65 |
|
R2 |
29 | - | - | - |
| F value | 7.87 | - | - | - |
| P value | 0.000 | - | - |
- |
Conclusion
From benefit cost analysis it is concluded that livestockfarming is a beneficial endeavor in district Mardan and that dairy farmers can further increase their profit by preferring buffaloes over cows for milk production. Cobb-Douglas function analysis reports a negative significant effect for herd size over milk yield. This reveals that small sized dairy farms are more productive and profitable. The analysis also report positive significant coefficients for green and dry fodder consumption and labor hours; however, the sum of the estimated coefficients was less than 1 which indicates a decreasing return to scale in milk production.These results suggest that livestock farmers should utilize each input at its allocatively efficient level in order to get maximum profit.
Author’s Contribution
This research is one of a part of phd research of first author, Neelum Andaleeb. Dr. Munir Khan is the major supervisor of my entire phd research.
References
Afridi, G.S., M. Ishaq and S. Ahmad. 2009. Estimation of Costs and Returns and Factor Productivity in Livestock Enterprise in Northern Areas, Pakistan. Pak. J. Life Soc. Sci. 7(1):43-51.
Chaudhry, M.A. 1996. Economics of Livestock Production and Management. Agric. Soc. Sci. Res. Centre, Univ. of Agric., Faisalabad. 89-90.
Ahmad, B., M. Ahmad and M.A. Chaudhry. 1996. Economics of Livestock Production and Management. Agric. Social Sci. Res. Centre, Univ. of Agric., Faisalabad. 89-90.
GoKP. 2014. Economic survey of Pakistan. 2012-13. Ministry of Finance Govt. of Pakistan. Government of Khyber pakhtunkhwa.2013. Department of agriculture and livestock cooperation.
GoP. 2010. Important district wise-socio economic indicators of Khyber Pakhtunkhwa 2010. Bureau of statistics planning and development department government of Khyber Pakhtunkhwa. pp. 55.
GoP. 2014-15. Economic Survey. Econ. Advisory Wing, Finance Div., Islamabad.
Livestock Census. 2014. Government of Khyber Pakhtunkhwa. Directorate of Livestock & Dairy Development Peshawar.
Gujarati, D.N., and Porter, D.C. 2009. Basics Econometrics. 5th ed. McGraw Hill Inc. New York, USA.
Seale, J., A. Regmi and J. Bernstein. 2003. International evidence on food consumption patterns. Tech. Bullet. No. 1904. US Deptt. Agric. www.ers-usda.gov.
Shah, A., A. Saboor and S. Ahmad. 2009. An estimation of cost of milk production in Pakistan: A microeconomic approach. Sarhad J. Agric. 25(1): 141-147.
USAID. 2009. District Mardan health profile. PAIMAN (Pakistan Initiative for Mothers and Newborns)
Yamane, T. 1967. Statistics, an Introductory Analysis (2nd.). New York: Harper and Row.
To share on other social networks, click on any share button. What are these?


