

Dynamic Effects of Ketogenic Diet on Autophagy and Cell Cycle in a Mouse Model of CT26+ Colon Cancer


Dynamic Effects of Ketogenic Diet on Autophagy and Cell Cycle in a Mouse Model of CT26+ Colon Cancer
Junrong Yang1, Ning Zhang1*, Muhammad Akram Khan2, Qingpeng Wang1*, Zhengping Wang1*, Quiqin Liu3, Lanjie Li3, Jun Han1, Abdul Asim Farooq4, Aayesha Riaz5 and Ruiyan Zhang1
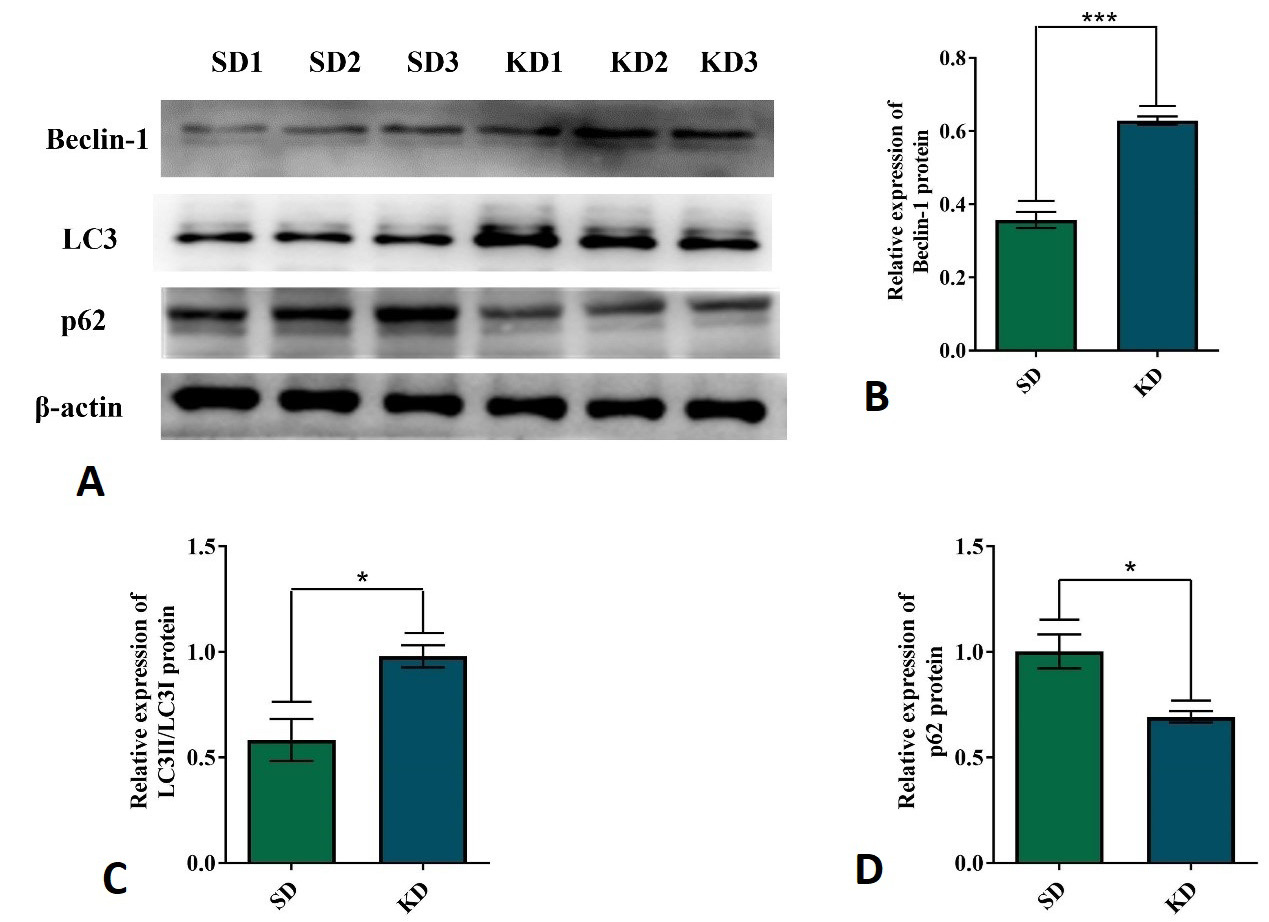
KD induced autophagy in CT26+ colon cancer mouse model. (A) The representative expression of Beclin-1, LC3, and p62 proteins in CT26+ tumor tissues and β-actin as the internal control for normalization. Quantitative analysis of Beclin-1 (B), LC3 (C), and p62 (D) proteins. Each experiment was repeated thrice, and all the data were presented as mean ± SEM in each case. Independent-sample T-test was used when different sets of data were compared. Statistically significant differences between different groups were indicated as *p < 0.05, **p < 0.01 and ***p < 0.001.
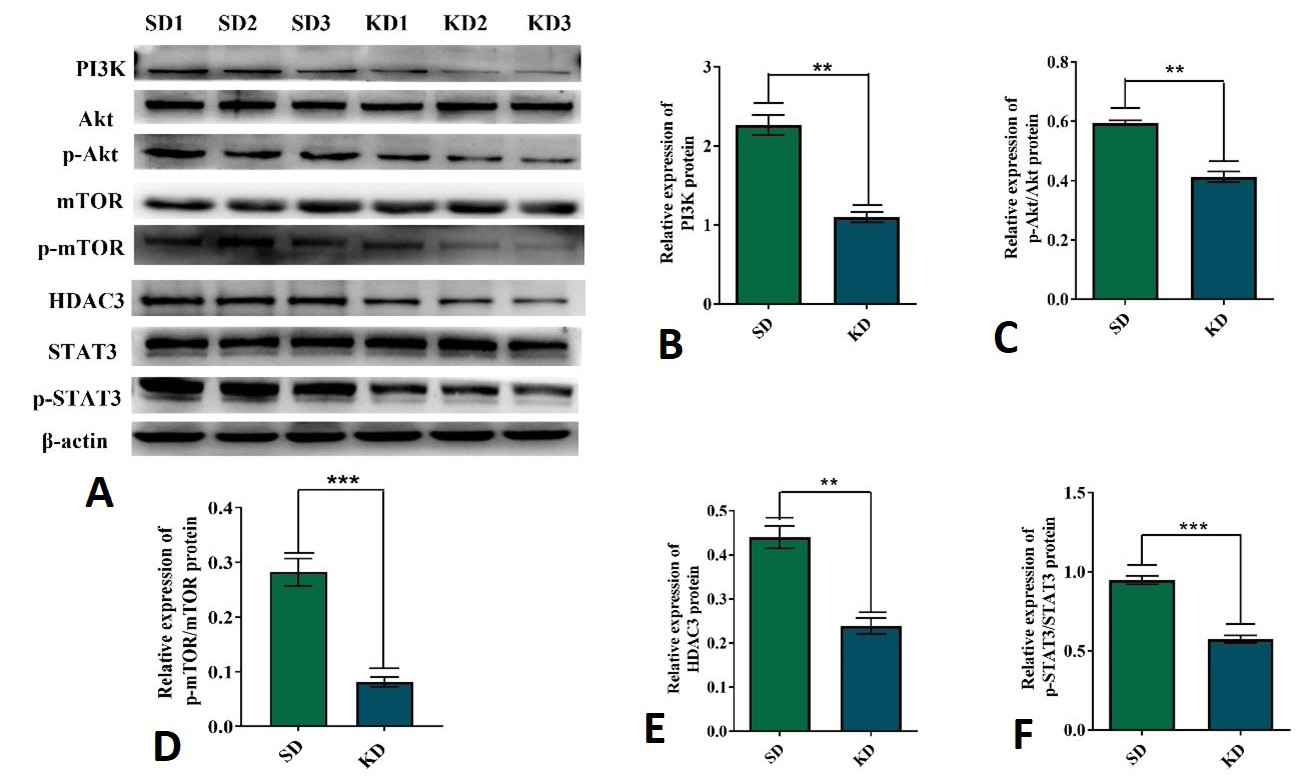
The expression of PI3K, p-Akt, Akt, p-mTOR, mTOR, p-STAT3, STAT3 and HDAC3 proteins in CT26+ colon cancer mouse model with SD and KD treatment. (A) The representative expression of PI3K, p-Akt, Akt, p-mTOR, mTOR, p-STAT3, STAT3 and HDAC3 in CT26+ tumor tissues and β-actin as the internal control for normalization. Quantitative analysis of PI3K protein (B), the ratios of p-Akt to total Akt protein (C), the ratios of p-mTOR to total mTOR protein (D), HDAC3 protein (E) and the ratios of p-STAT3 to total STAT3 protein (F). Each experiment was repeated three times, and all the data were presented as mean ± SEM in each case. Independent-sample T-test was used when different sets of data were compared. Statistically significant differences between different groups were indicated as *p < 0.05, **p < 0.01 and ***p < 0.001.
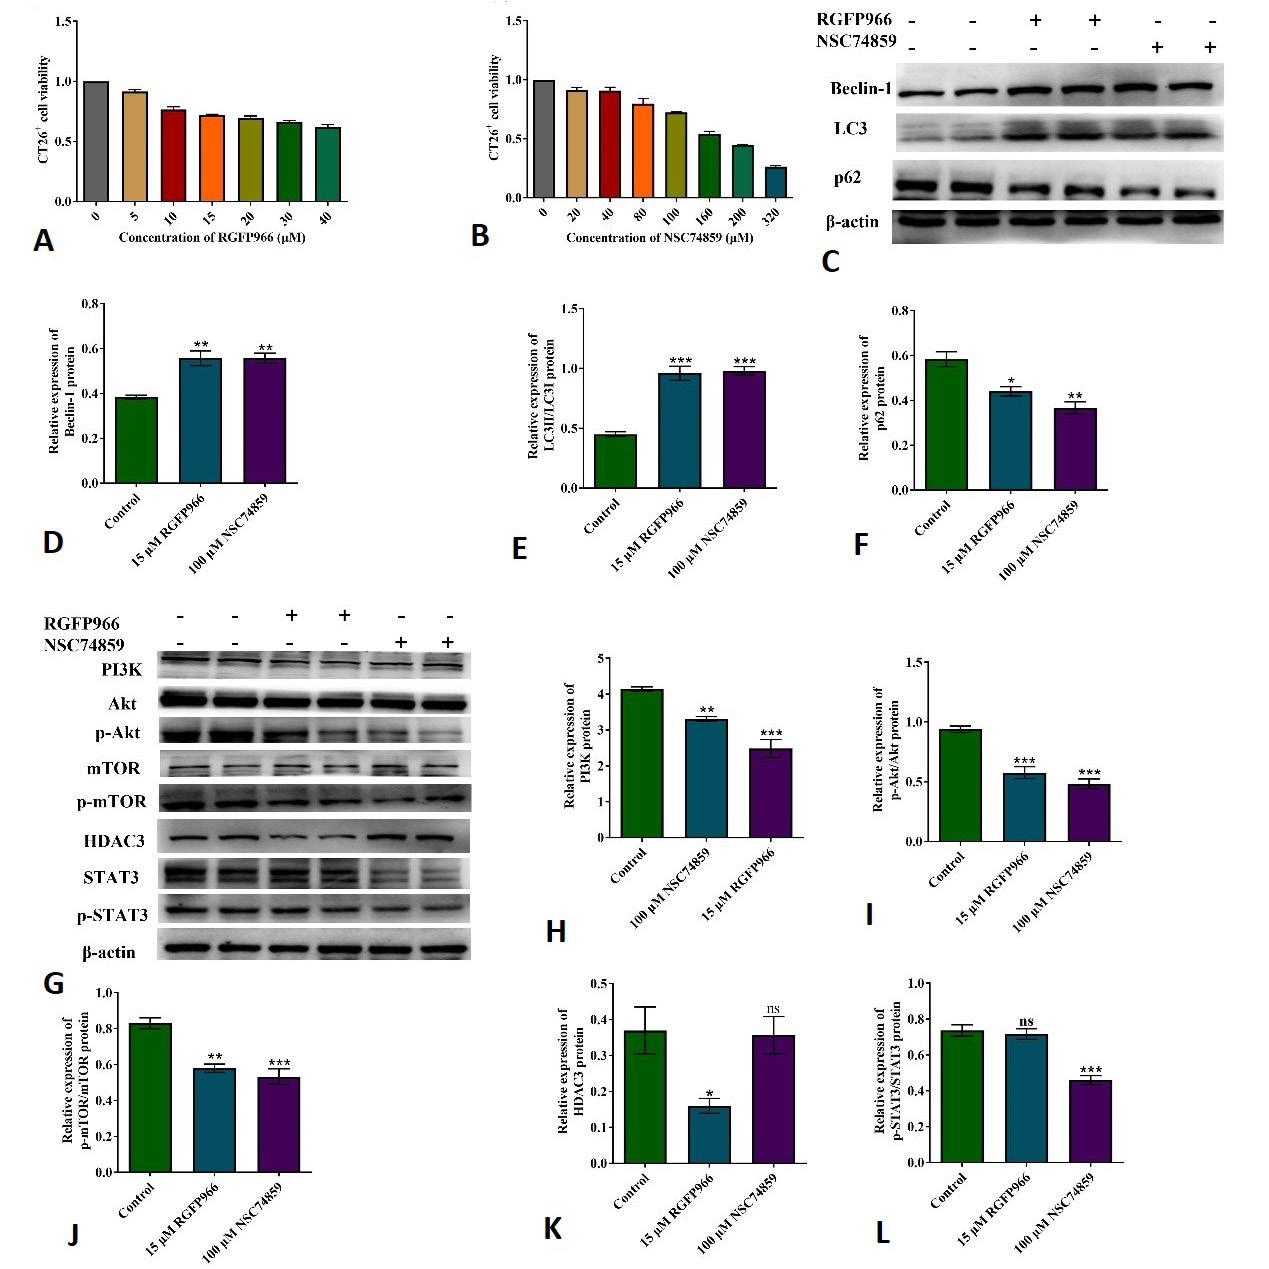
HDAC3 and STAT3 regulated the expression of PI3K, p-Akt, Akt, p-mTOR, mTOR, Beclin-1, LC3 and p62 in CT26+ colon cancer cells. The viability of CT26+ cells was detected by CCK8 with RGFP966 treatment (A) and NSC74859 treatment (B). (C) The representative expression of Beclin-1, LC3 and p62 in CT26+ cells treated with RGFP966 and NSC74859, β-actin as the internal control for normalization. Quantitative analysis of Beclin-1 (D), LC3 (E) and p62 (F) proteins in RGFP966 and NSC74859 treated groups. (G) The representative expression of PI3K, p-Akt, Akt, p-mTOR, mTOR, p-STAT3, STAT3 and HDAC3 in CT26+ colon cells treated with RGFP966 and NSC74859, β-actin as the internal control for normalization. Quantitative analysis of PI3K (H), p-Akt/Akt (I), p-mTOR/mTOR (J), HDAC3 (K) and p-STAT3/STAT3 (L) in RGFP966 and NSC74859 treated groups. Each experiment was repeated three times, and all the data were presented as mean ± SEM in each case. ANOVA was used when different sets of data were compared. Statistically significant differences between different groups were indicated as *p < 0.05, **p < 0.01 and ***p < 0.001 and ns: no significance.
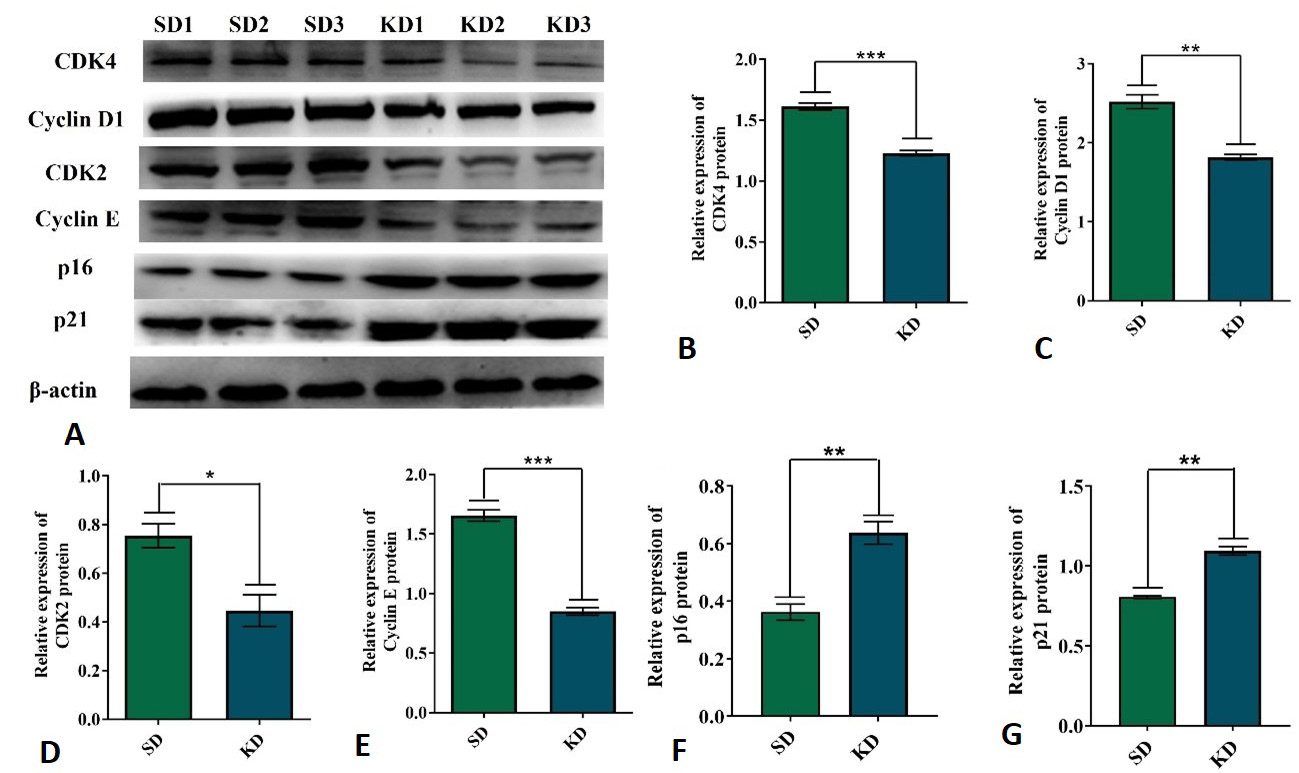
The effect of KD on the expression of Cyclins and CDKs in CT26+ colon cancer mouse model. (A) The representative expression of CDK4, Cyclin D1, CDK2, Cyclin E, p21 and p16 proteins in tumor tissues and β-actin as the internal control for normalization. Quantitative analysis of CDK4 (B) and Cyclin D1 (C), CDK2 (D) and Cyclin E (E), p16 (F) and p21 (G) proteins. Each experiment was repeated thrice, and all the data were presented as mean ± SEM in each case. Independent-sample T-test was used when different sets of data were compared. Statistically significant differences between different groups were indicated as *p < 0.05, **p < 0.01 and ***p < 0.001.
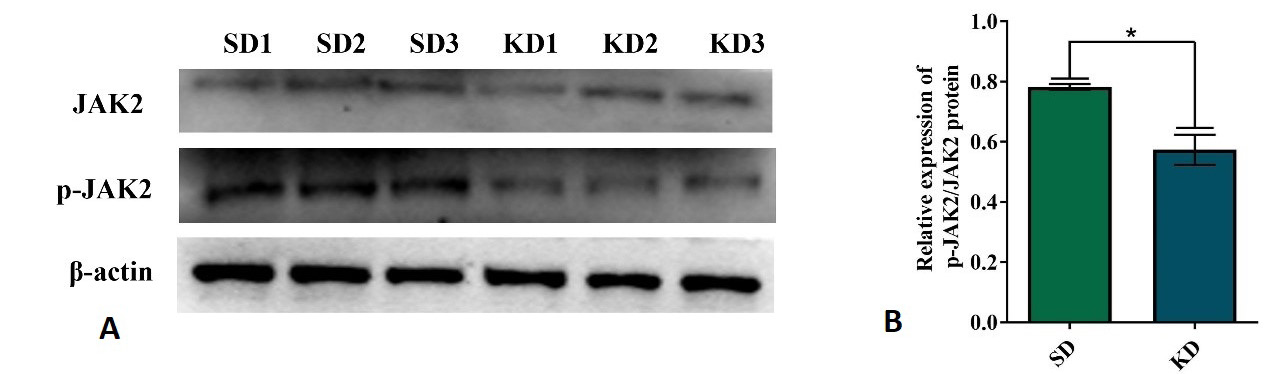
The effect of KD on the expression of JAK2 in the CT26+ colon cancer mouse model. (A) The representative expression of p-JAK2 and JAK2 protein tumor tissues and β-actin as the internal control for normalization. (B) Quantitative analysis of p-JAK2/JAK2 ratio in tumor tissues. Each experiment was repeated three times, and all the data were presented as mean ± SEM in each case. Independent-sample T-test was used when different sets of data were compared. Statistically significant differences between different groups were indicated as *p < 0.05, **p < 0.01 and ***p < 0.001.
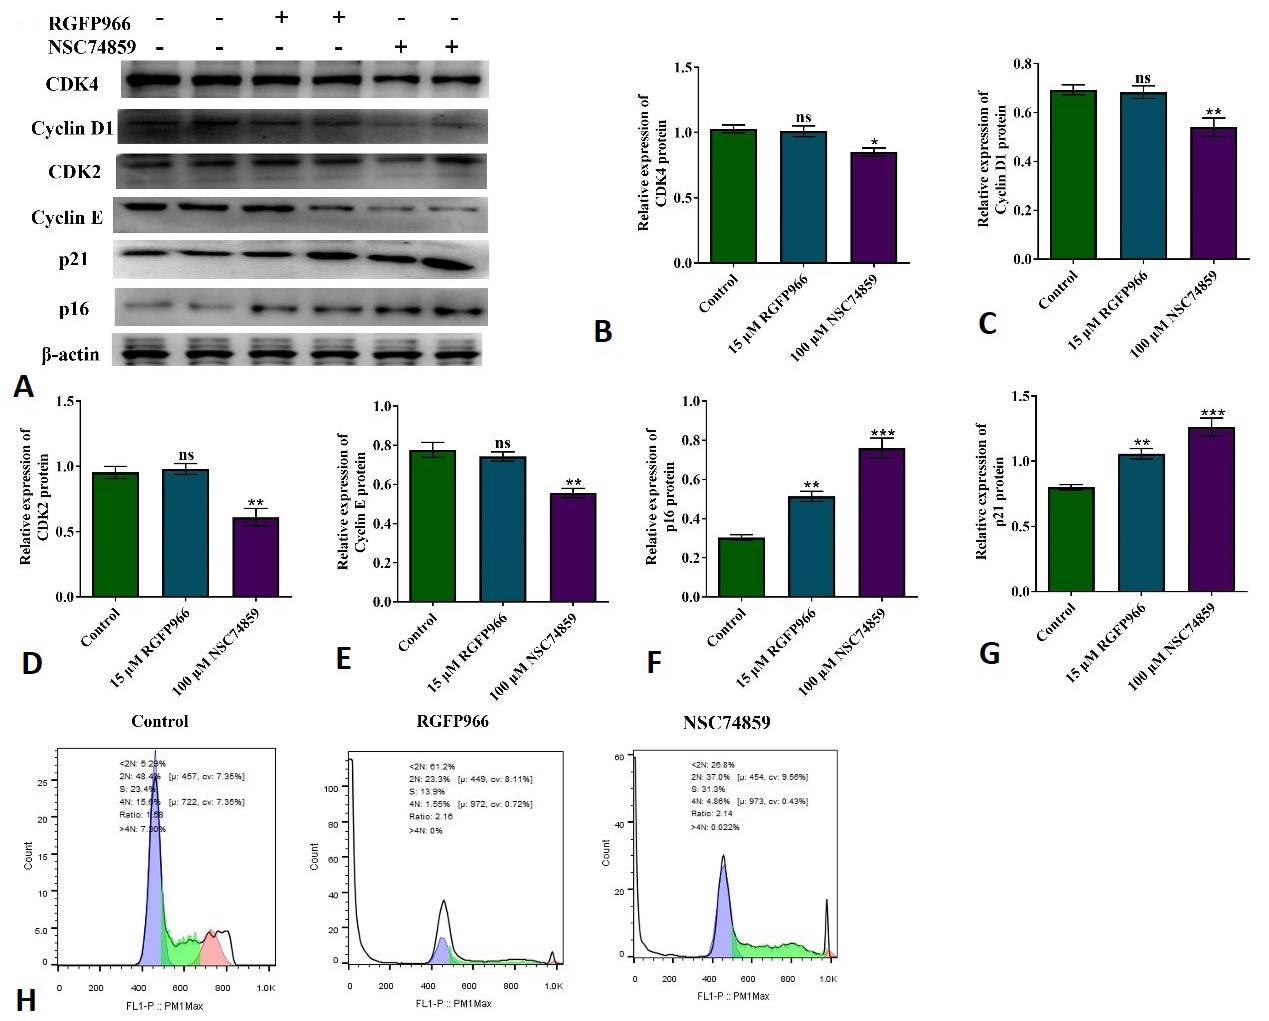
Effect of RGFP966 and NSC74859 on the cell cycle of CT26+ colon cancer cells. (A) The representative expression of CDK4, Cyclin D1, CDK2, Cyclin E, p21 and p16 in CT26+ colon cancer cells and β-actin as the internal control for normalization. Quantitative analysis of CDK4 (B), Cyclin D1 (C), CDK2 (D), Cyclin E (E), p16 (F) and p21 (G) proteins. (H) Flow cytometric analysis of CT26+ colon cancer cells treated with RGFP966 and NSC74859. Each experiment was repeated three times, and all the data were presented as mean ± SEM in each case. One-way analysis of variance (ANOVA) was used when different data sets were compared. Statistically significant differences between different groups were indicated as *p < 0.05, **p < 0.01, ***p < 0.001and ns: no significance.
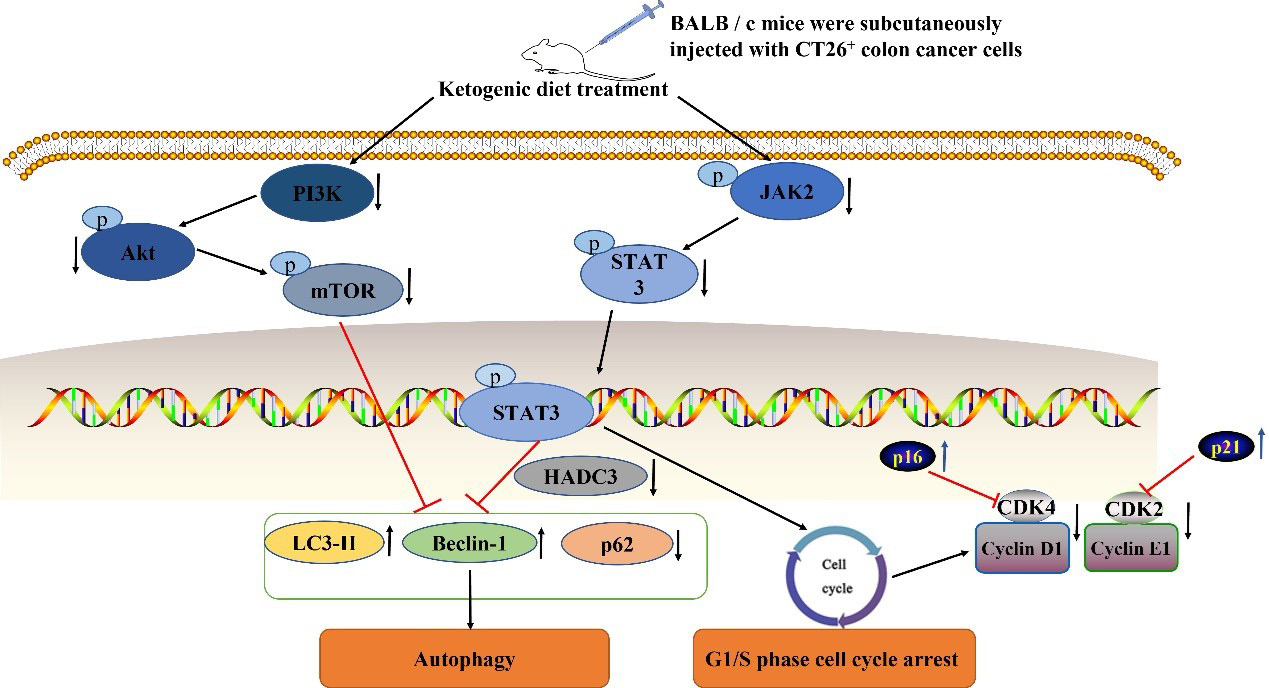
Suggested mechanism of KD on autophagy and cell cycle arrest in CT26+ tumor bearing mice.


