Descriptive Analysis of Water Resources in Pakistan: A Perspective of Climate Change
Ateeq Ahmad1, Umar Hayat2, Shahid Ali2*, Hazrat Bilal3, Naveed Ali2, Khan Mir Khan4 and Khalid Khan4
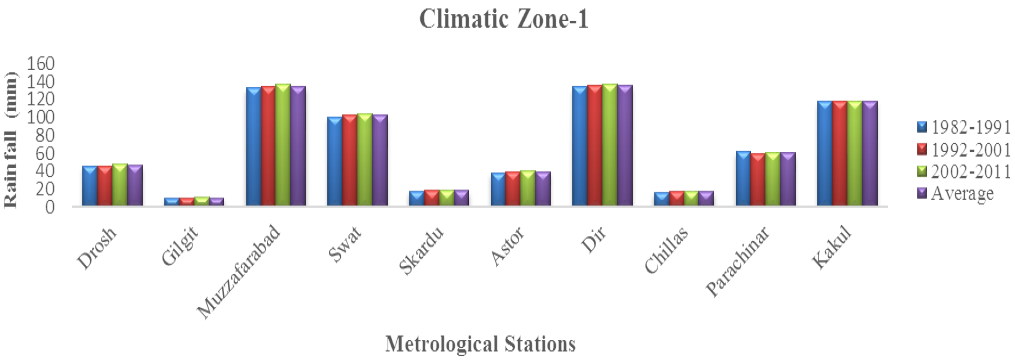
Graph showing 30 years mean annual rainfall of zone 1.
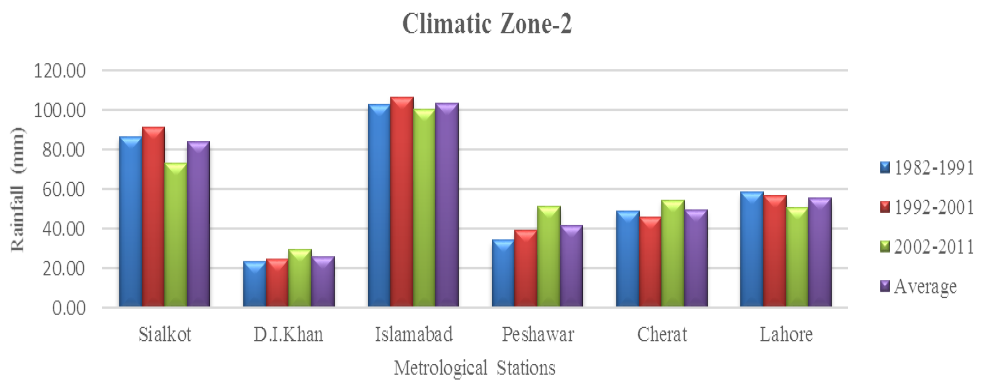
Graph showing 30 years mean annual rainfall of zone 2.
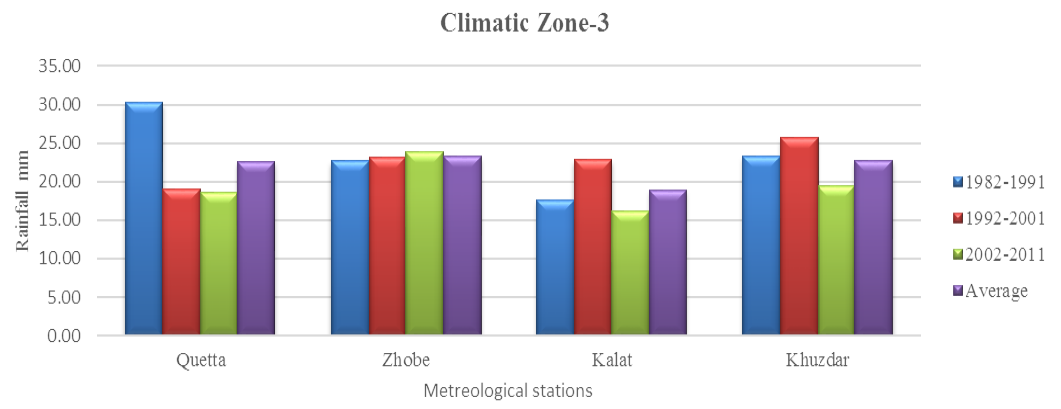
Showing 30 years mean annual rainfall for Zone 3.
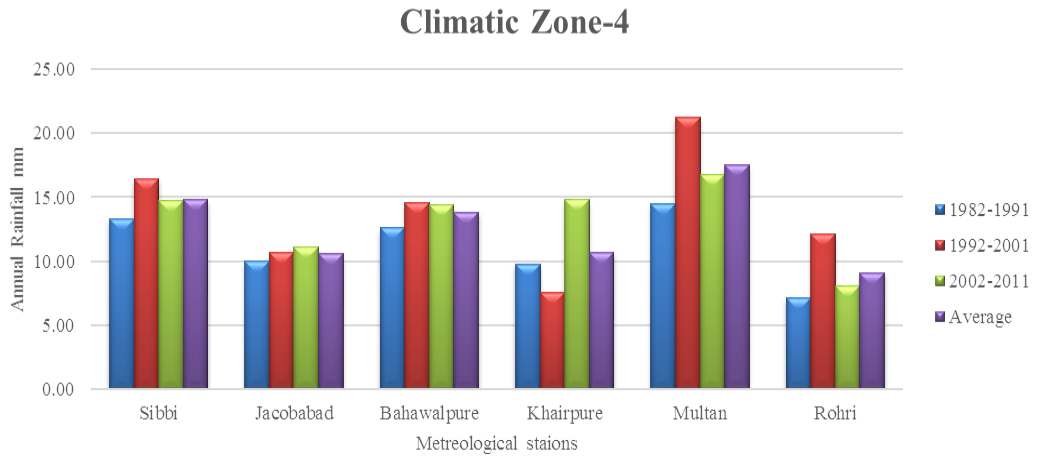
Showing 30 years mean annual rainfall for Zone 4.
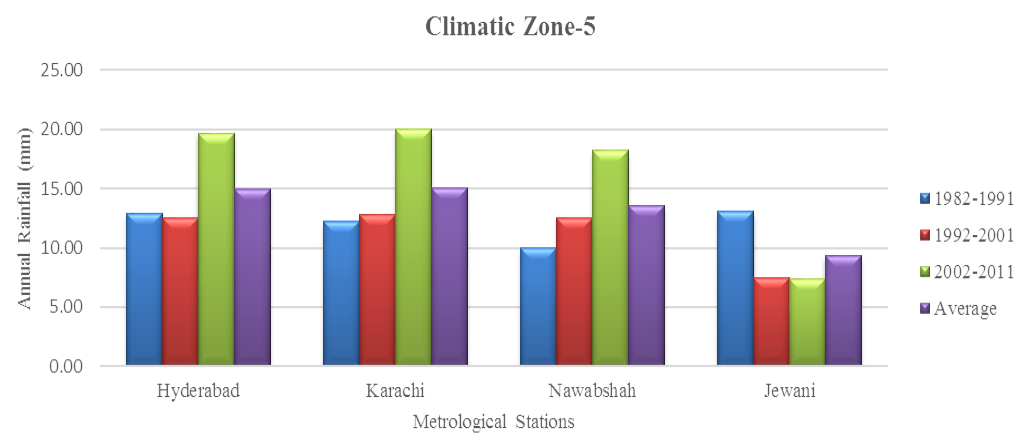
Showing 30 years mean annual rainfall trend for Zone 5.
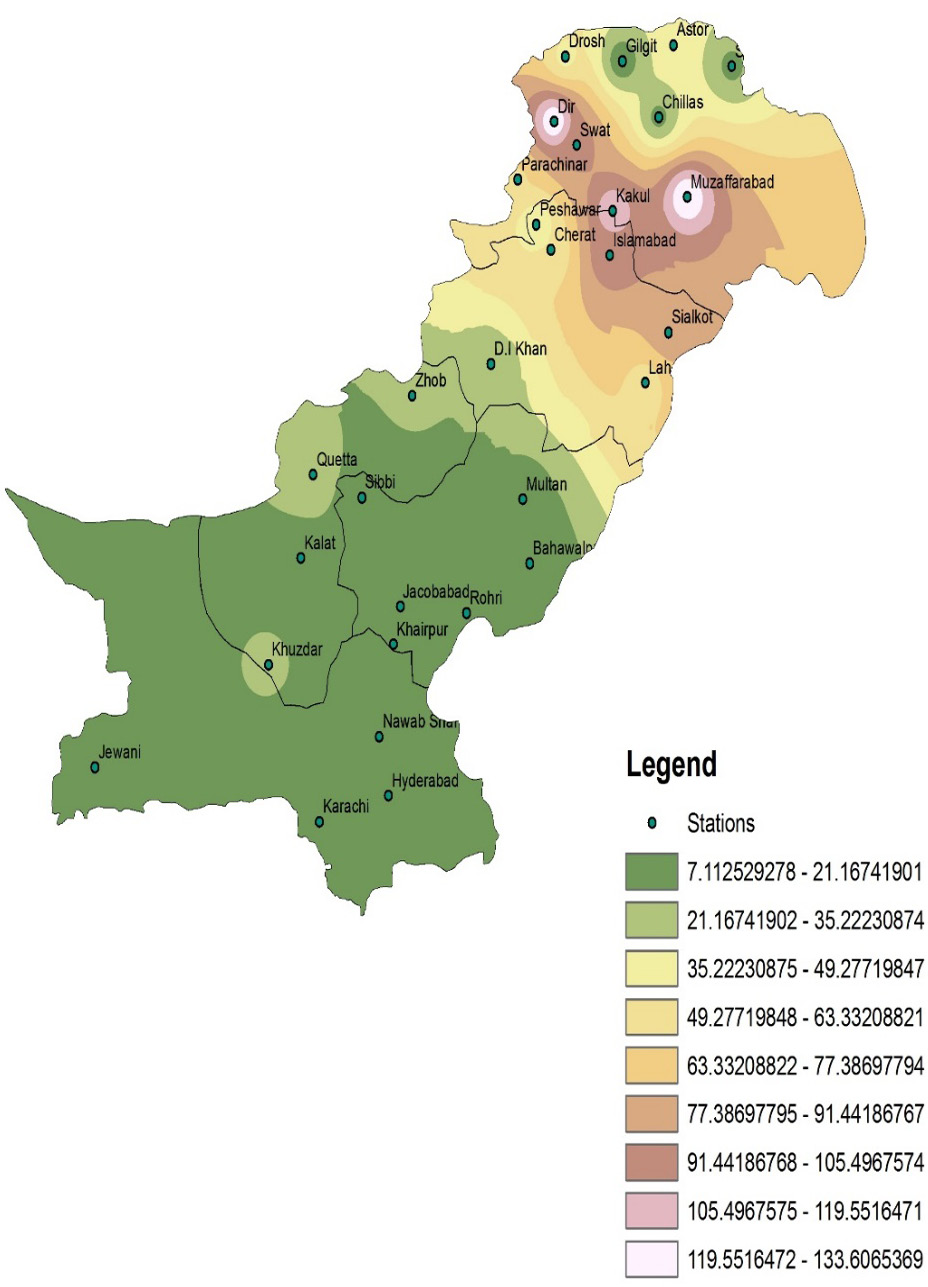
Showing the average rainfall for all stations from 1982 – 1991.
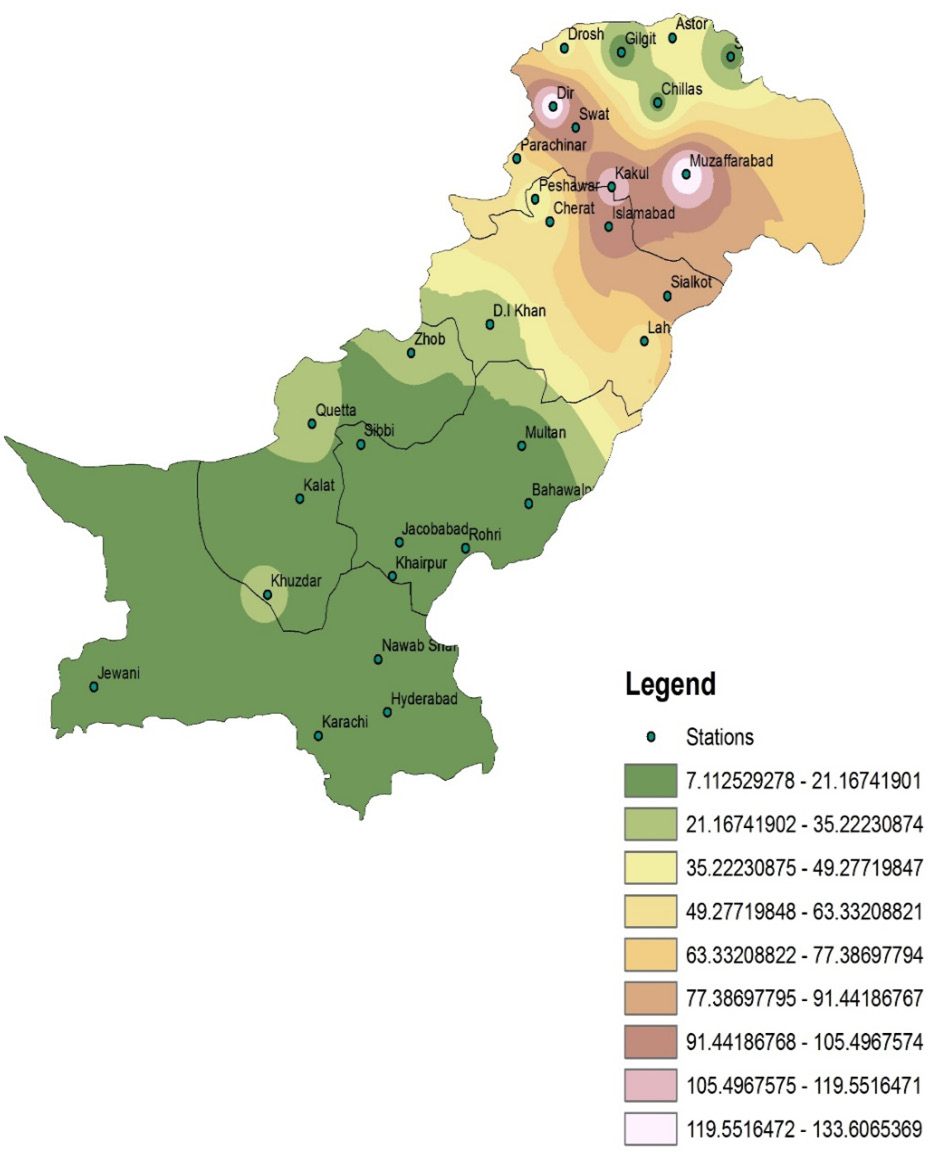
Average rainfall for all stations from 1992–2001.
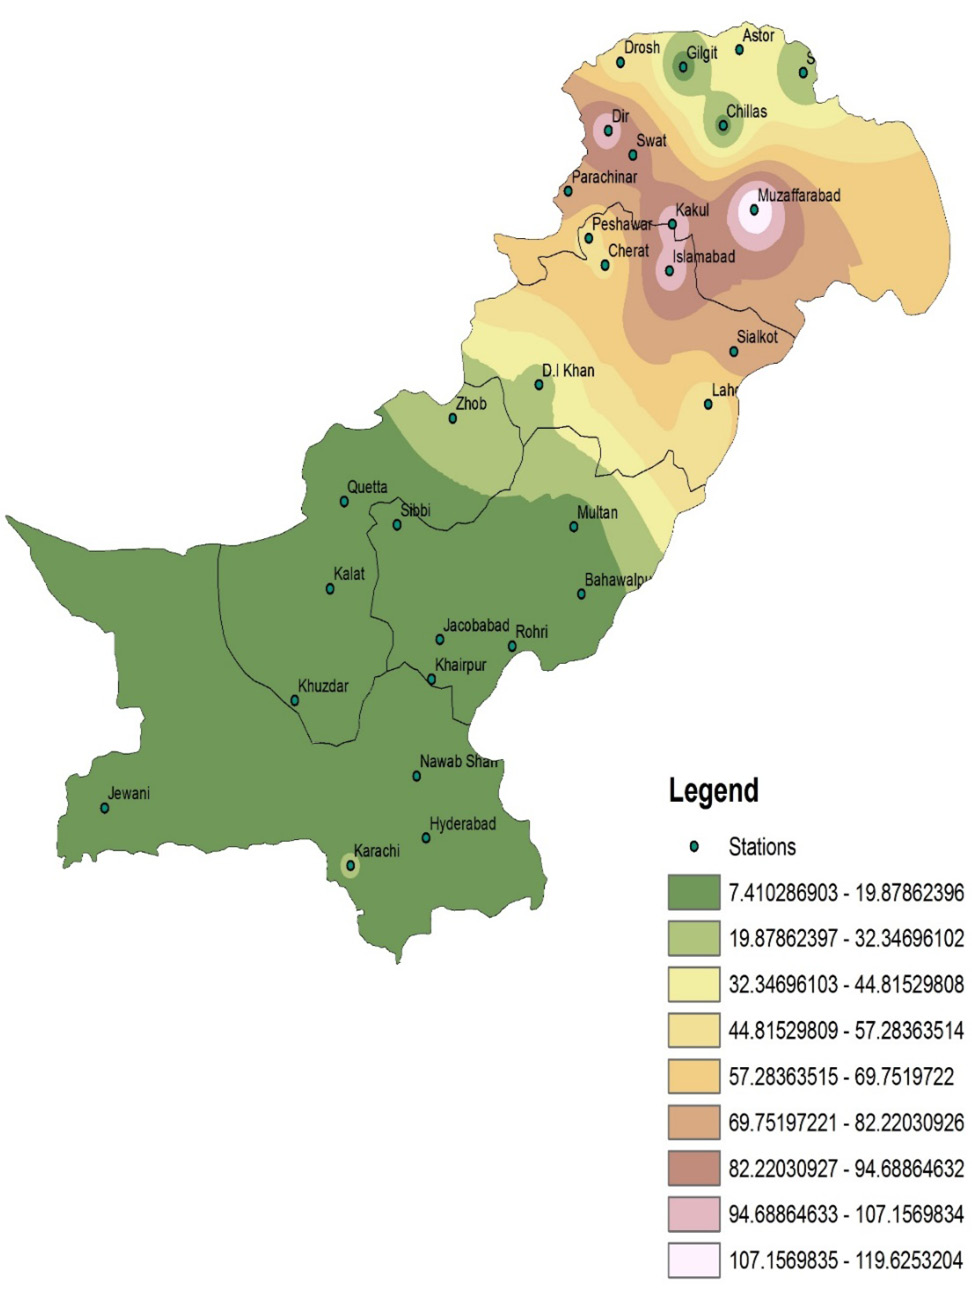
Average rainfall for all stations from 2002 – 2011.
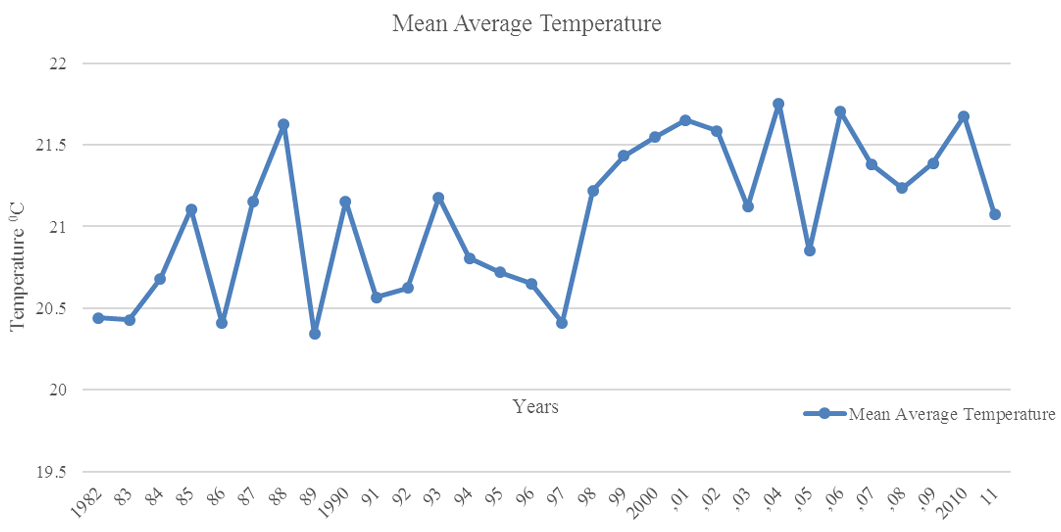
Mean annual temperature trend for 30 years 1982-2011.
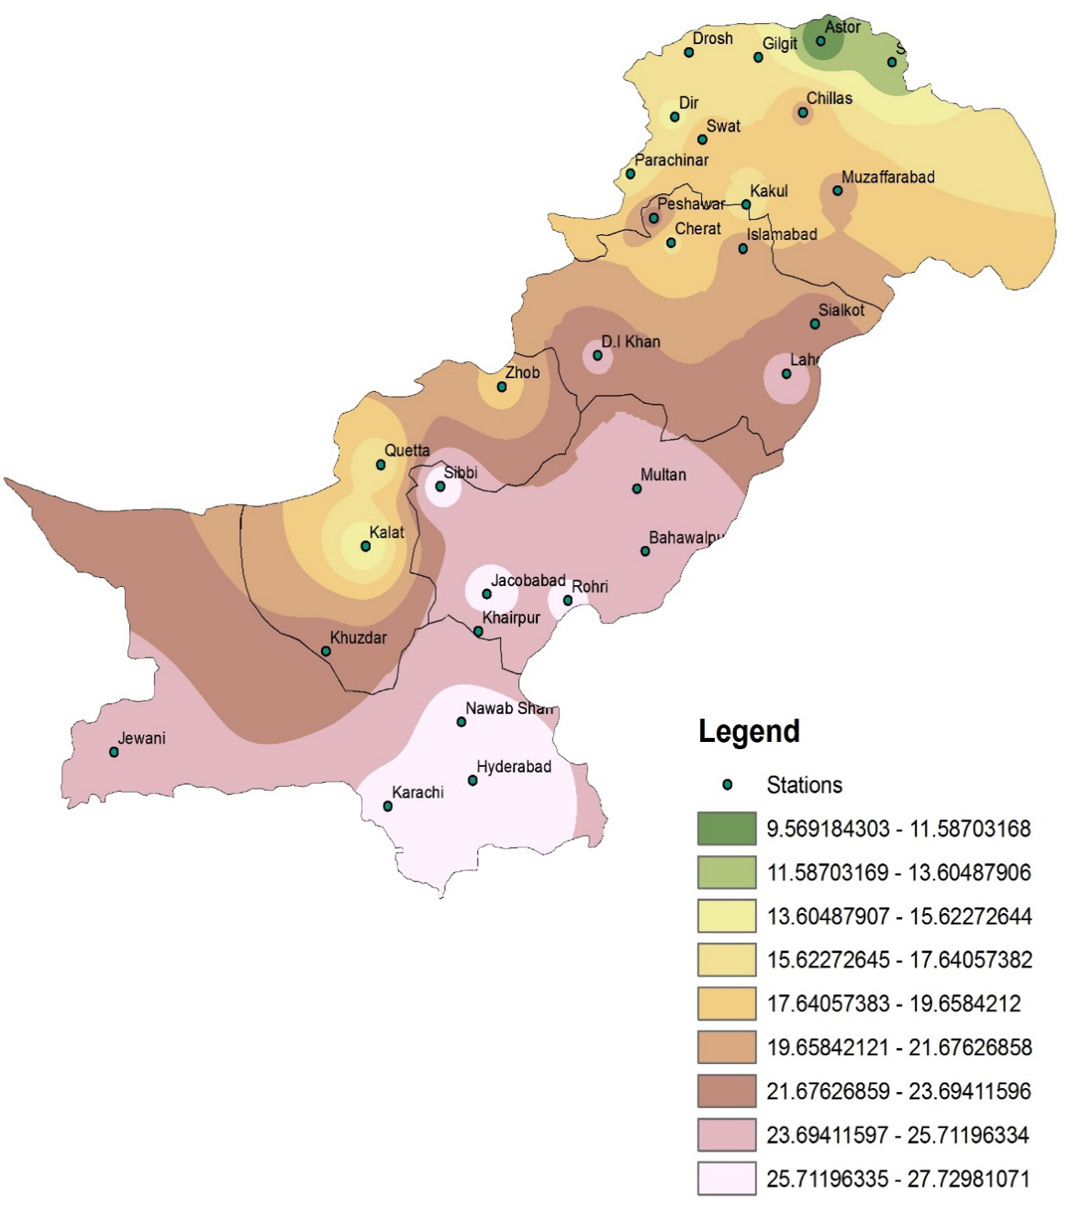
Average temperature for all stations from 1982 – 1991.
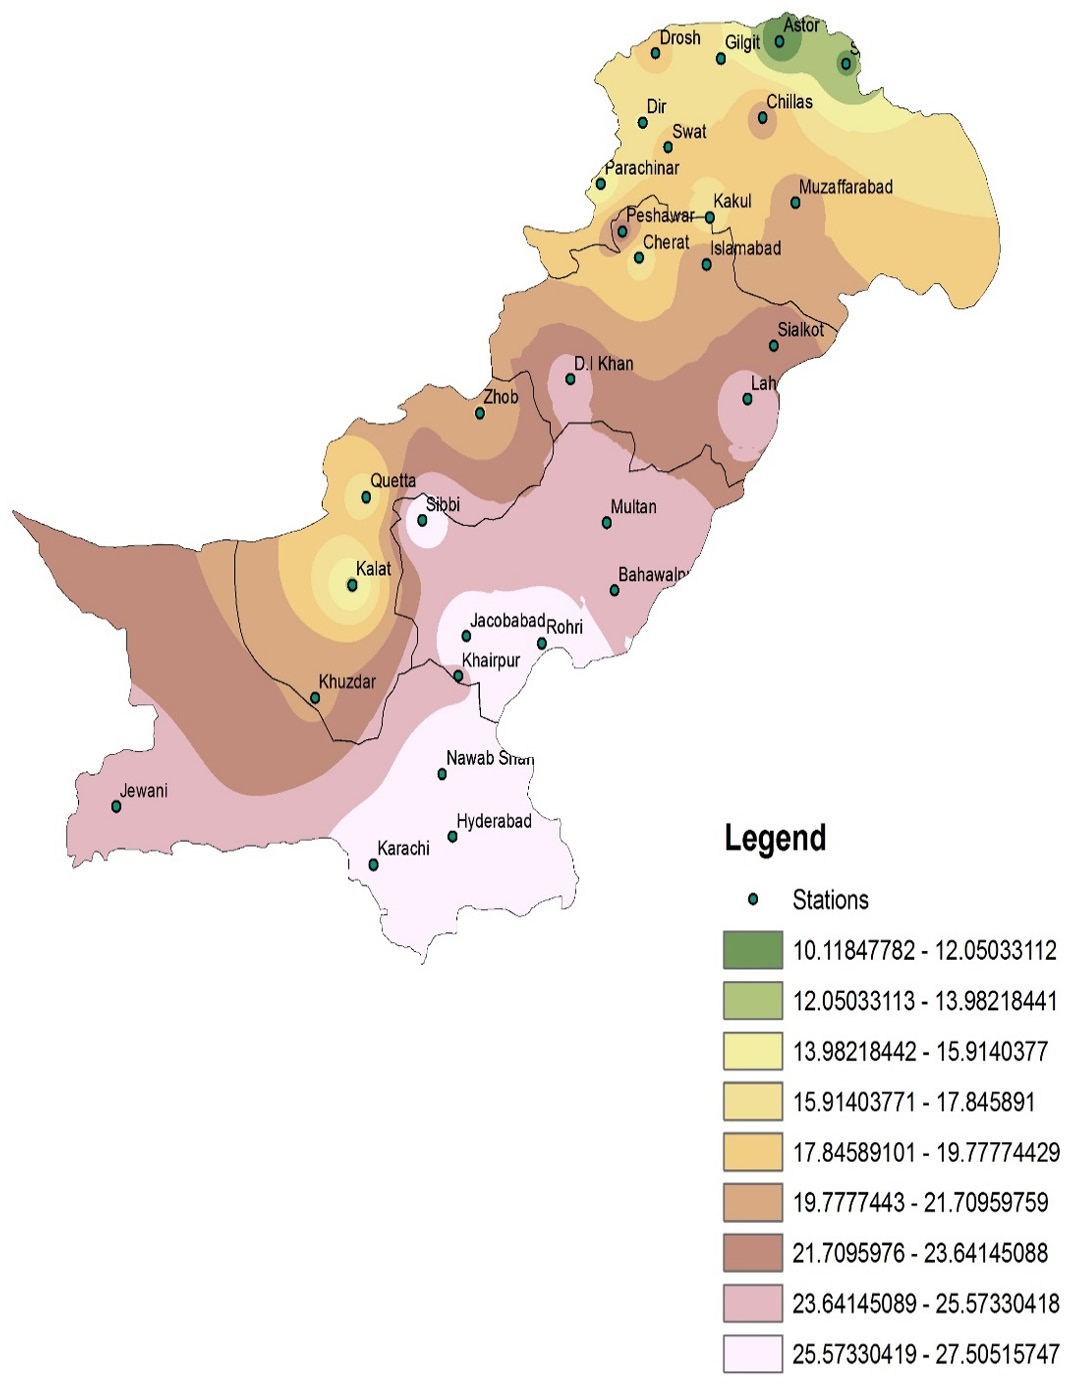
Average temperature for all stations from 1992 – 2001.
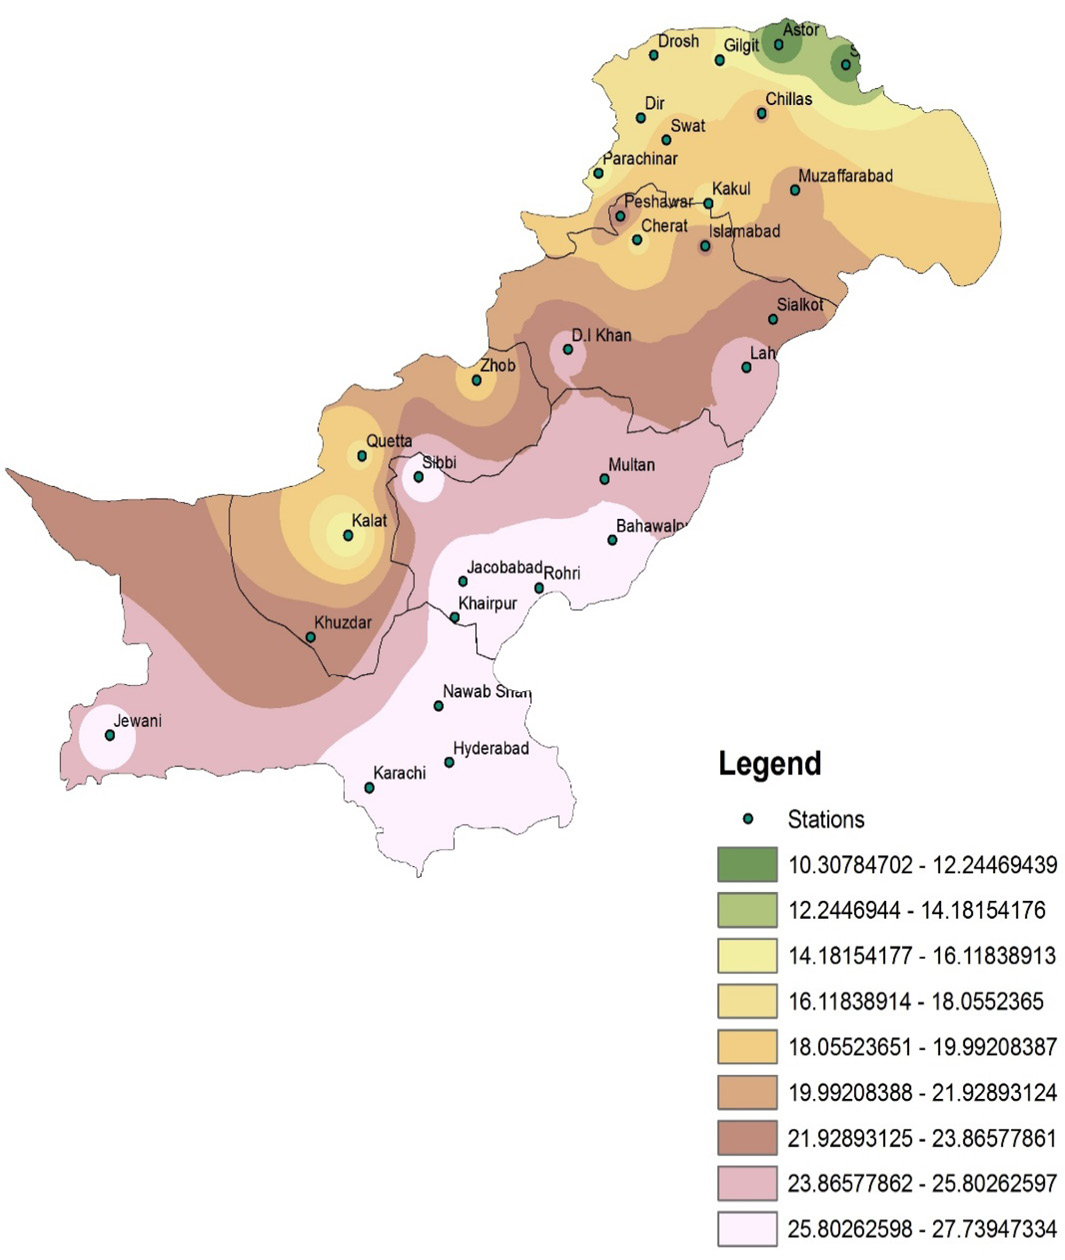
Average temperature for all stations from 2002 – 2011.


