
Delineation of Vulnerable Zones for YSB Attacks under Variable Temperatures Using Remote Sensing and GIS


Delineation of Vulnerable Zones for YSB Attacks under Variable Temperatures Using Remote Sensing and GIS
Syed Muhammad Hassan Raza1*, Syed Amer Mahmood1, Veraldo Liesenberg2 and Syed Shehzad Hassan1
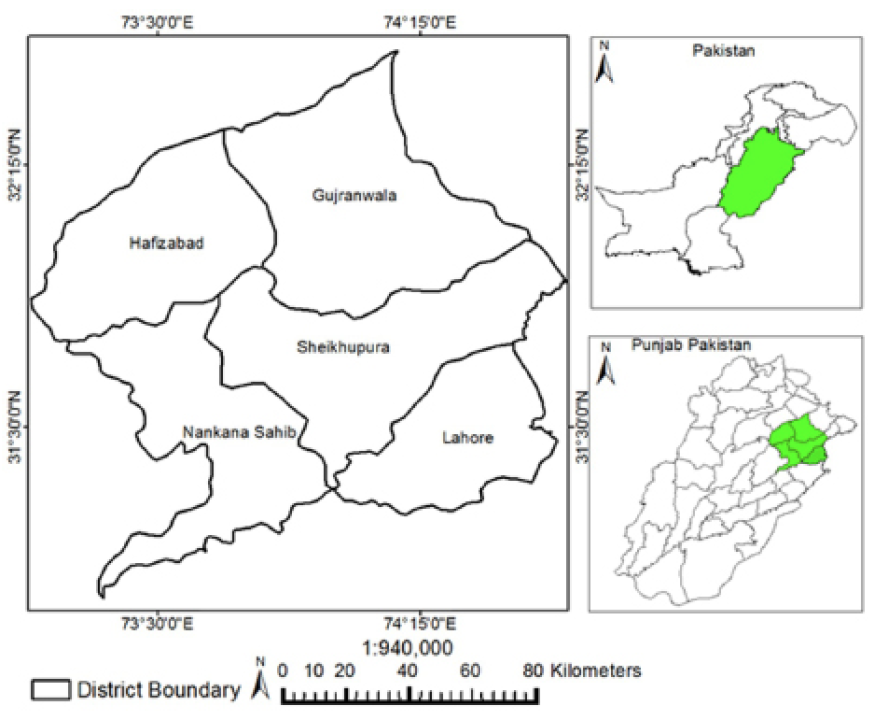
Figure 1
Study Area.
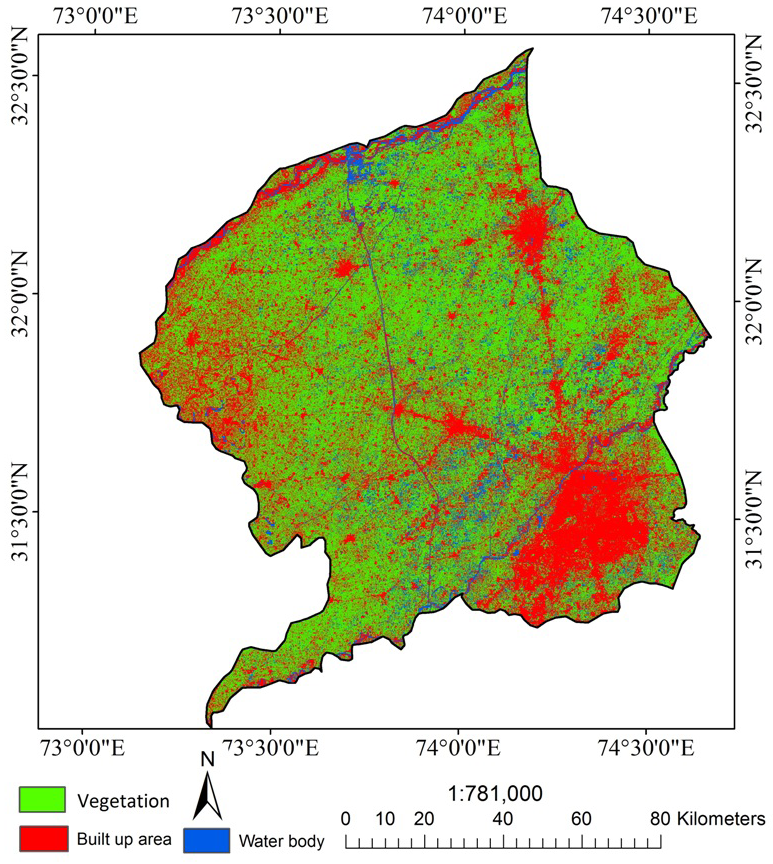
Figure 2
Land use land cover.

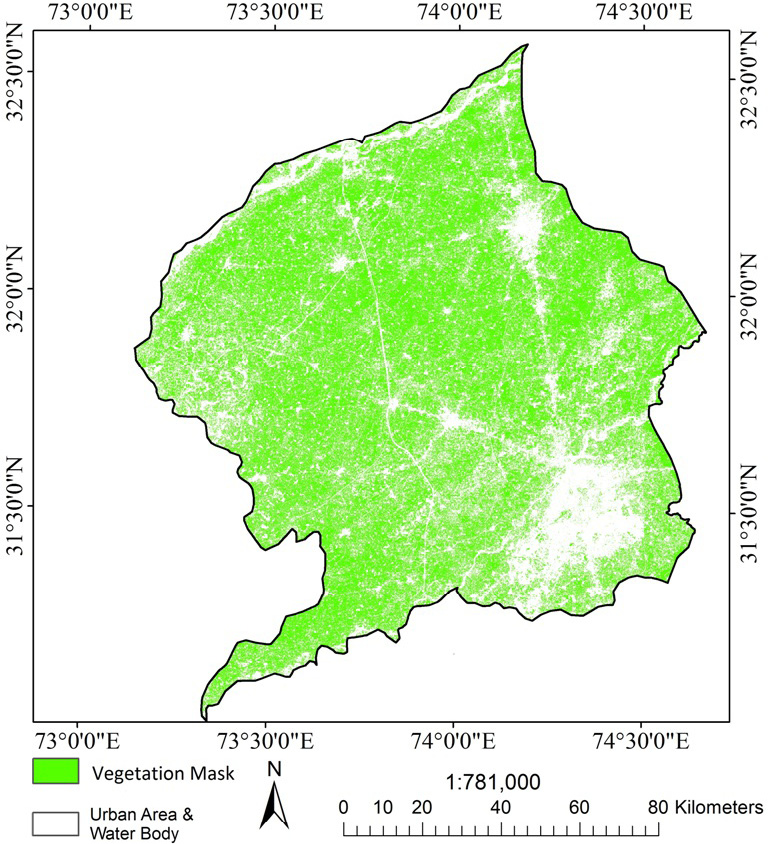
Figure 3
Vegetation mask.
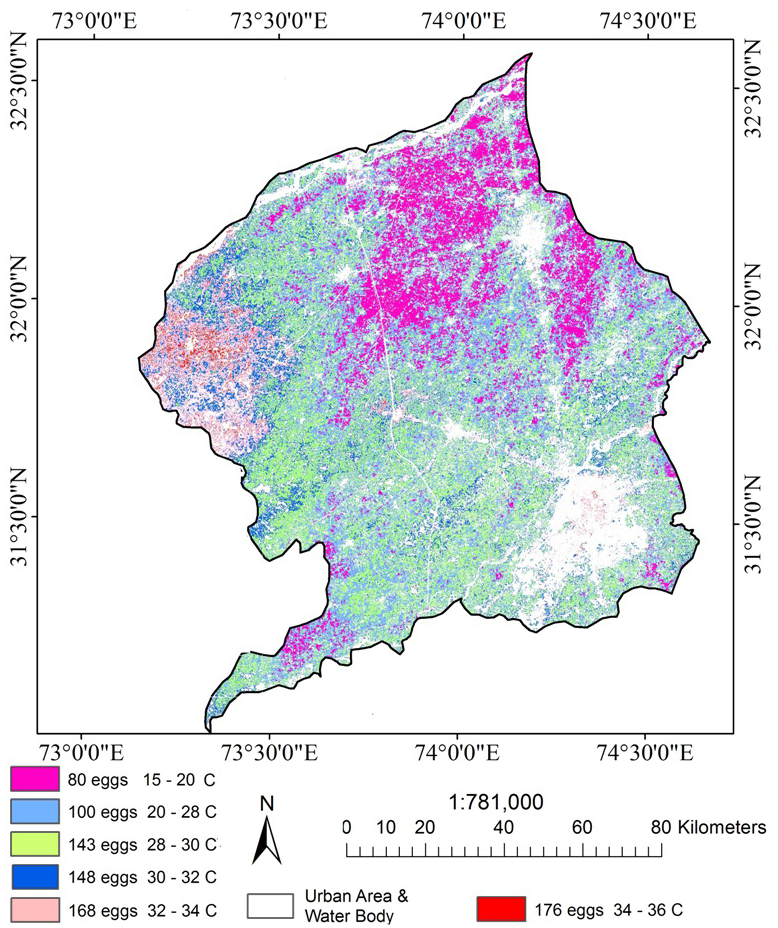
Figure 4
April egg Distribution.
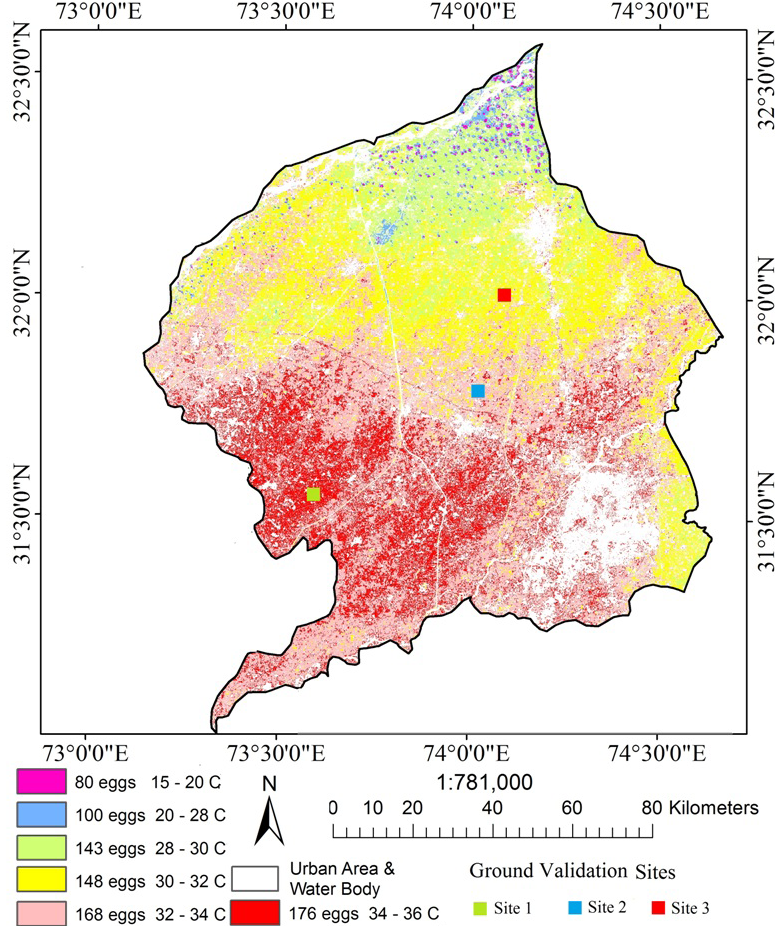
Figure 5
April egg map.

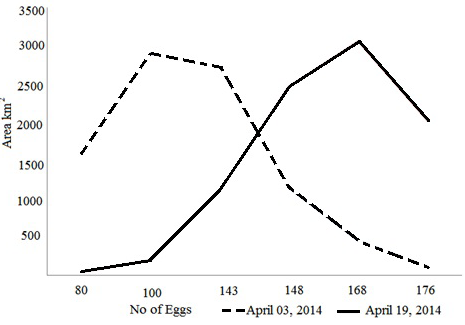
Figure 6
Egg leaving comparision.

Figure 7
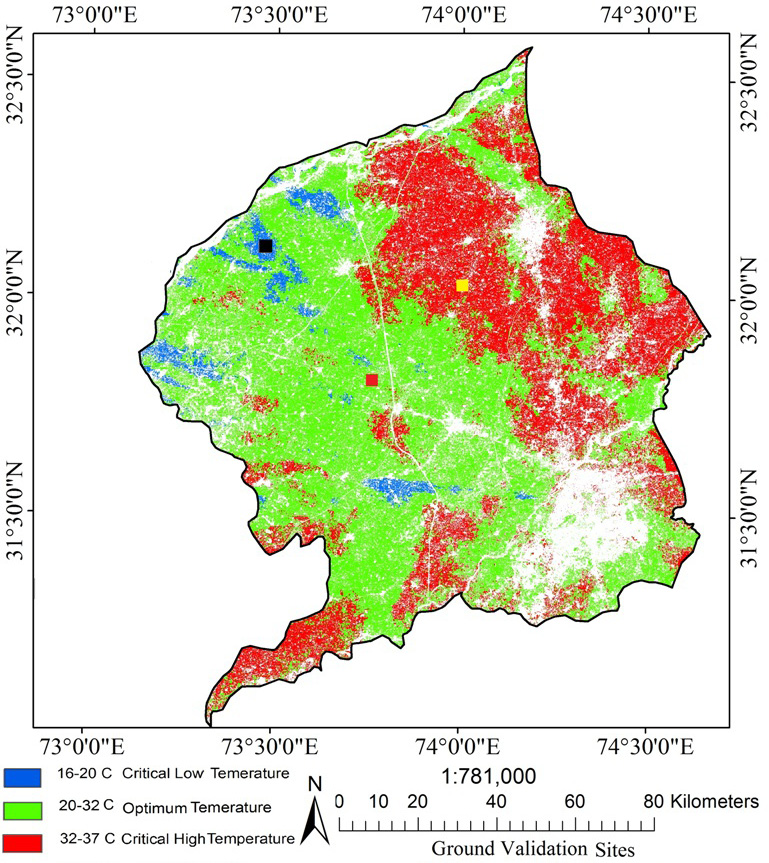
May egg hatch map.

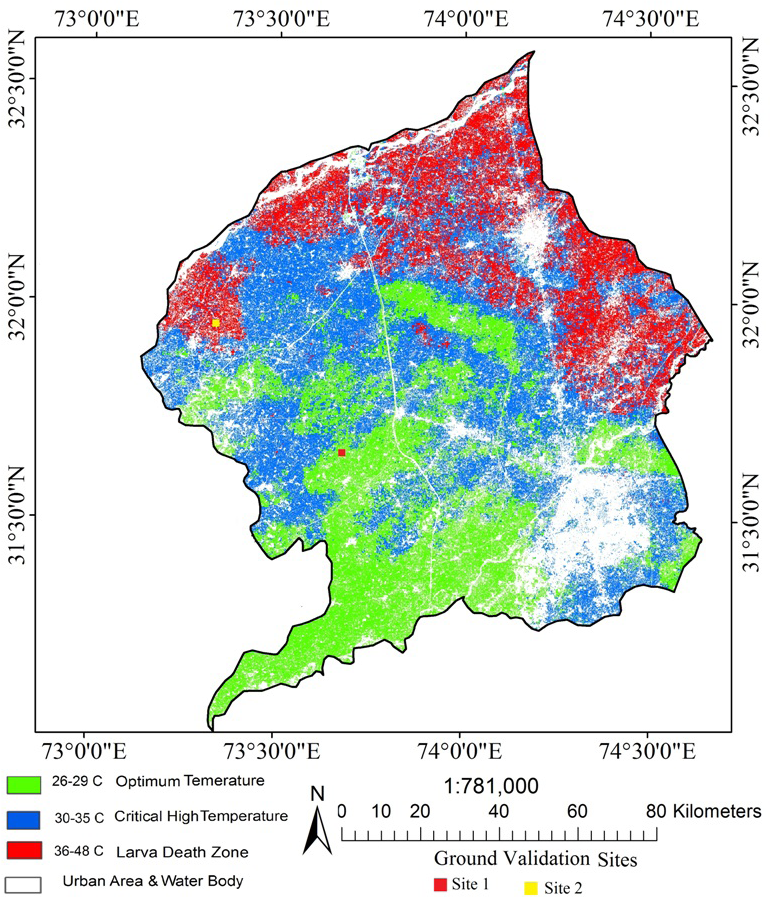
Figure 9
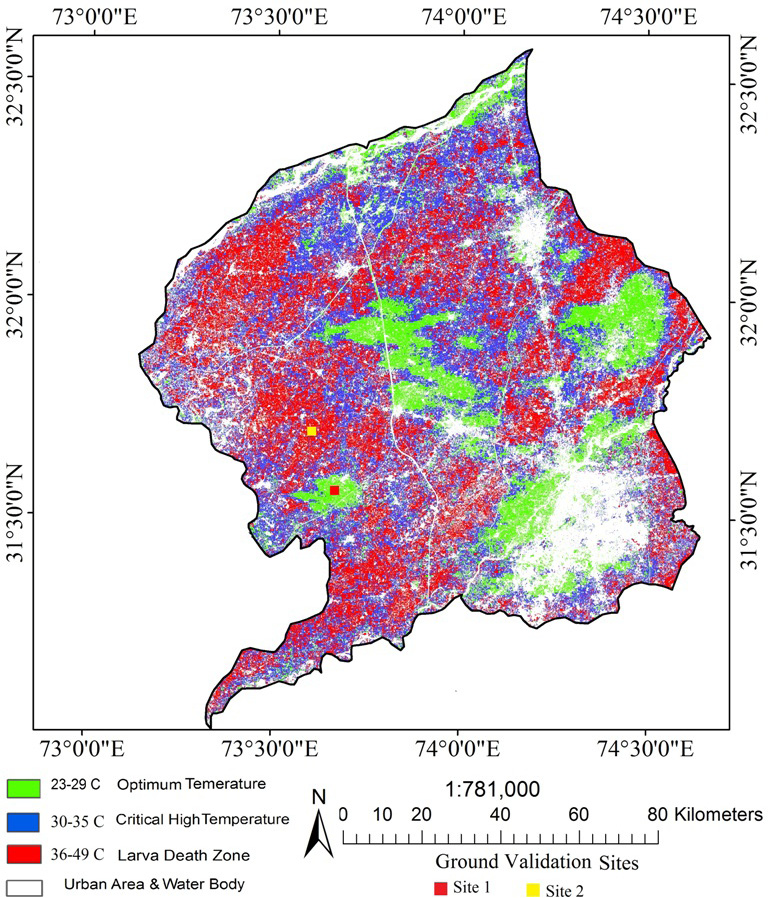
June larva map

Figure 10
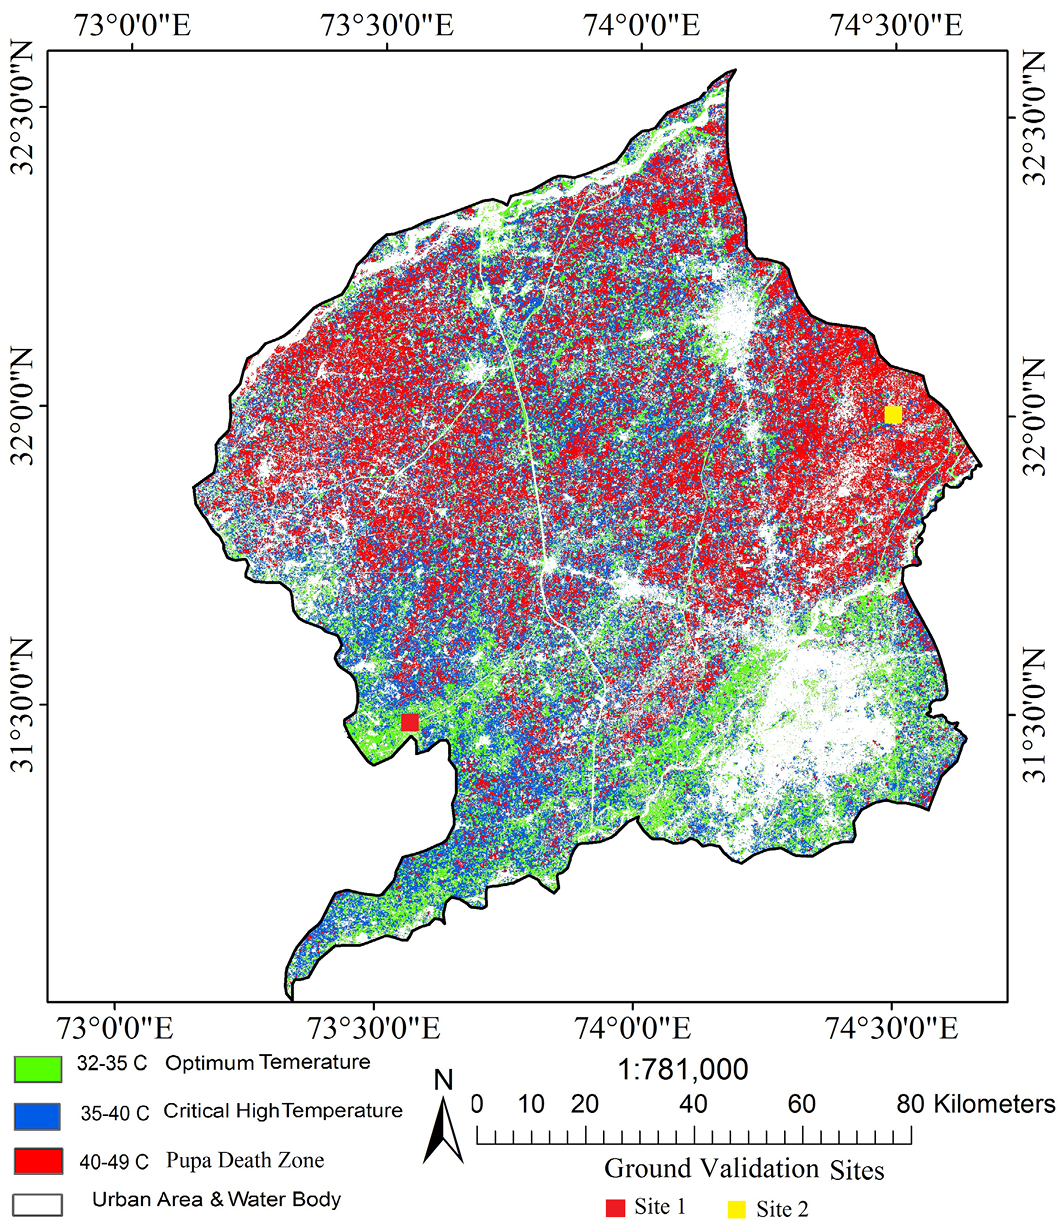
June pupa.
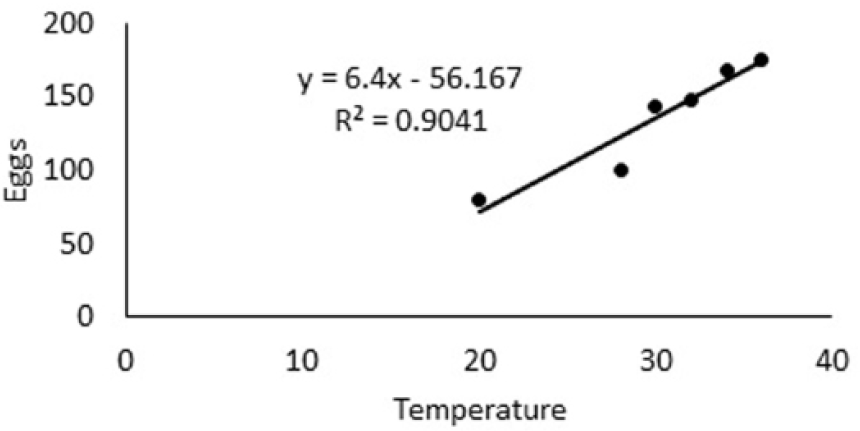
Figure 11
Egg laying at various temp.

September 2018
Vol. 34, Iss. 2, Pages 494-711


