
Correlates of Poverty in Azad Jammu and Kashmir: A Logit Analysis


Research Article
Correlates of Poverty in Azad Jammu and Kashmir: A Logit Analysis
Gulnaz Hameed1, Abdul Saboor1, Khuram Nawaz Sadozai2*, Ghaffar Ali2, Dawood Jan2 and Mansoor Rasheed3
1Department of Economics, PMAS Arid Agriculture University, Rawalpindi, Pakistan; 2Department of Agricultural and Applied Economics, The University of Agriculture, Peshawar, Khyber Pakhtunkhwa, Pakistan; 3Department of Agricultural Economics, Balochistan Agriculture College, Quetta, Pakistan.
Abstract | Azad Jammu and Kashmir has an agrarian economy which is confronted with substantial challenges of poverty, health facilities and education. To cope-up with deprivations through various facet, series of rural/community development programs have been launched for long times. The research gap needs to be addressed is an empirical analysis of contribution of such initiatives in the welfare of masses through poverty reduction in the area. This research endeavor is designed to figure out the impact of one of such projects named as Azad Jammu and Kashmir Community Development (AJKCDP) through poverty estimation and exploring the correlates of poverty in AJ and K. Multistage sampling technique was used to draw a sample of 540 respondents from the universe comprising both registered and nonregistered members of AJKCDP. Primary data were collected through interview schedule. Foster Greer and Thorbecke measure was used to calculate incidence of poverty which is then used to model the probability expressions with the help of Logit to investigate the correlates of poverty in the research area. Poverty was found at below for registered members and investigations showed that education, area under cultivation, possession of assets, status of employment, ownership of livestock and jobs of females increased the likelihood of decrease in poverty. Therefore, successful components of this program should be replicated with great care and focus should be given on education because any intervention in community cannot be helpful in reducing poverty unless the respondents are educated. The study also revealed empirically that participation of women in different economic activities plays an important role in poverty reduction so the policies which are gender friendly can be highly advantageous particularly in the distant regions. Local communities may be involved and private sector should also be invited by foundation of mutual social conscientiousness to improve education related infrastructure.
Received | February 03, 2019; Accepted | February 26, 2020; Published | April 28, 2020
*Correspondence | Khuram Nawaz Sadozai, Department of Agricultural and Applied Economics, The University of Agriculture, Peshawar, Khyber Pakhtunkhwa, Pakistan; Email: ksaddozai@aup.edu.pk
Citation | Hameed, G., A. Saboor, K.N. Sadozai, G. Ali, D. Jan and M. Rasheed. 2020. Correlates of poverty in Azad Jammu and Kashmir: A logit analysis. Sarhad Journal of Agriculture, 36(2): 593-602.
DOI | http://dx.doi.org/10.17582/journal.sja/2020/36.2.593.602
Keywords | Correlates, Poverty, Logit, Community development program
Introduction
Poverty is the inability to sustain a minimum level of livelihood in accordance with the basic consumption requirements or the amount of income needed to satisfy them (World Bank, 2006). It is one of the biggest issues easily observable in the rural communities especially in the developing countries. Studies showed that people of developing economies living in absolute poverty amounts to 1.29 billion which is an alarming situation (Jalbani, 2014; Farooq, 2014).
Pakistan has shown upward trends of growth and development in many aspects, in various regions (GoP, 2016-17). However, the residents of Azad Jammu and Kashmir (AJ and K) are still facing the lack of availability of basic health facilities, quality education, proper housing structure and employment opportunities etc. About forty percent of the population was living below poverty line during 2004 (AJKCDP, 2004). Main source of income of rural population of AJK is forestry, agriculture, livestock and non-formal employment and national per capita income on average was estimated to be 1368US$. Unemployment ranges between 9-13 percent while social indicators of health and population did not show much proficiency (GoP, 2013-14). The state of AJ and K has faced numerous economic issues since partition in 1947 and started witnessing a period during seventies when economic development phase started.
Development is regarded as a multifaceted course of progress that involves not only major changes and challenges in national institutions, social structure but also includes accelerating the economic growth and reducing poverty and inequality in income and wealth. So in order to address the key issue of poverty in AJK many developmental activities have been initiated by different non-profit organizations in addition to government existence since long, among them Azad Jammu Kashmir Community Development Program (AJKCDP) was proposed in accordance with International Fund for Agricultural Development’s (IFAD) supported community development programs. This program was aimed at reducing poverty and uplifting marginalized and vulnerable communities of the rural areas of AJ and K. The program focused on social as well as economic upbringing of the people. The AJKCDP was established during 2004. However, it was properly executed after the earthquake of 2005. It was started as a private, non-profit organization/corporation with the chief purpose to progress the socio-economic conditions of population in rural areas of AJ and K. This program also had alliance with various government departments to ensure public sector ownership (AJKCDP, 2010).
Although a variety of developmental interventions through such programs have been carried out in the area but there is a missing link of independent impact evaluation of these initiatives for development in AJ and K. This needs to be focused for deriving workable policy lessons for this region of the country and to learn lesson from any success stories from AJ and K that can be replicated in other parts of the country. Primarily it could be done by exploring the determinants of poverty in the rural communities which would lead us towards the further steps of poverty eradication. Many studies have been conducted to filter the impact of community development interventions on poverty alleviation and to identify the determinants of poverty (Bogale et al., 2011; Sokoto, 2002; Olaniyan and Bankole, 2005; Buhl and Sen, 2006; Hashmi and Sial, 2007).
An analysis of data from 210 randomly selected beneficiaries of poverty alleviation program of International Fund for Agriculture Development (IFAD) from Local Government Areas (LGAs) of Sokoto State, using Logit regression model revealed that education has negative relationship with poverty while age, gender and household size has positive relationship. Overall it was found that program has positive impact on poverty reduction in the area and it was recommended to improve the education level of the communities and the provision of infrastructure for poverty reduction (Shehu et al., 2012). Reduction in household size, dependency ratio, persons per room and improvement in education level and assets, female and household participation in labor force, access to market in remote areas can alleviate rural poverty (Chaudhry, 2009; Bokosi, 2006).
AJKCDP has completed its first phase of year 2005 to year 2012-13 while second phase is started in 2018 under the umbrella of (IFAD) with the same objective of poverty eradication but there is a dilemma of lack of empirical work done in determining the correlates of poverty in the area which could be a barrier in enjoying the full benefits of this Program. So there is a dire need of the study which can answer the questions like what is the most important cause of poverty in AJK? How can poverty be reduced in the area? What are different factors which can directly be helpful in improving the wellbeing? Whether AJKCDP is helpful in reducing the poverty level in the area? How can we make this program more fruitful for the society? This study on this end can be very useful not only for the policy makers of the government side but for other stakeholders like organization teams of AJKCDP phase 2 and other development programs to target the specific dimensions/domains for poverty reduction which can directly be helpful to achieve the objective of having long run positive impact of such development interventions. So keeping in view the importance of determining the impact of AJKCDP the current study is conducted to estimate the poverty status of the registered and nonregistered members of the Program area and exploring covariates of poverty in AJ and K through probability regression analysis to identify the policy derivatives out of the empirical analysis.
Materials and Methods
Sampling framework
Presently AJK is administratively divided into three divisions i.e. Muzaffarabad, Poonch and Mirpur which are further divided in to ten districts. Muzaffarabad consists of three districts Muzaffarabad, Neelum and Hattian, division Poonch comprises Ponnch, Bagh, Sudhnoti and Haveli districts. In third division districts Kotli, Mirpur, and Bhimber are included. These districts are divided further into 18 tehsils and 32 subdivisions and according to Board of Revenue, Muzaffarabad (2013). In order to draw the sample from the universe of the study (AJK) multistage sampling procedure was employed and in the first stage four districts Muzaffarabad, Bagh, Sudhnoti and Kotliwere selected purposively covering all three divisions.
Then from these districts different mobilized Community Organizations termed Cos were randomly selected to target the registered members of sampled villages. Sample size of 87 registered members determined through table based on formulation by Bartlett et al. (2001) which was rounded off to 90. Fifty percent of registered members i.e. 45 non registered members were then randomly selected from the same areas thus making a sample of 180 nonregistered members. Therefore, a total sample size of 540 respondents were selected for data collection through a well-structured interview schedule keeping in view the limitations of finance, time and topography of this hilly area (Hameed et al., 2017). A wide range of yearly reviews, published reports and external evaluations of AJKCDP regarding working strategy of COs have thoroughly been reviewed before finding results and reaching conclusion of study.
Analytical framework
After data collection, data was analyzed in three steps. Firstly, data was properly screened and cleaned through basic descriptive statistics like frequencies, sums, averages and ranges etc. Secondly incidence of poverty was estimated by using proper poverty threshold and thirdly covariates of poverty were explored using Logit model.
Poverty estimation: For estimating poverty first step was to determine suitable poverty line which was determined on the basis of Pakistan Planning Commission’s approved caloric intake method, by which a threshold level of 2350 Kcal /adult/day was converted to monetary value. This value was Rs. 1745 for the year 2010-11(GoP, 2013-14) and was estimated for the year 2015-16 by adjustments of inflationary changes through Consumer Price Index. Thus a poverty line of Rs. 2434.15 was used to calculate Incidence of poverty by FGT (Foster, Greer and Thorbecke) measure. The equation for Foster et al. (1984) is:
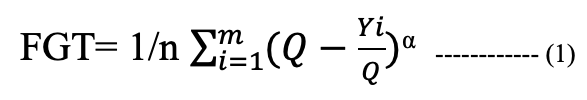
Where n is number of respondents in sample selected, m is the number of individuals living below poverty line, Q is the poverty threshold, Yi is per capita consumption expenditure of the ith household member/respondent and α may be 0,1 or 2 for headcount ratio(M0), poverty gap ratio(M1) and squared poverty gap ratio (M2). Headcount ratio/Incidence of poverty is the percentage of population below the poverty line and is further utilized for the estimation of Logit model.
Logistic regression model: In order to determine the correlates of poverty in AJ and K the Logistic Regression Model was applied, Logistic distribution is different from normal distribution with respect to its mean and variance (Abdelrahman, 2010) and mostly used for the variables which illustrates (0,1) form i.e. binary in nature (Maddala, 2007; Gujrati, 2005).
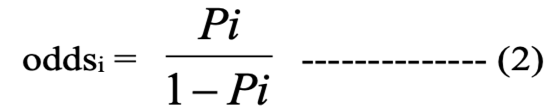
Logit model was constructed by introducing the idea of odds ratio at first step which means ratio of probability of occurrence (Pi)to that of nonoccurrence (1- Pi) of a phenomenon. In current case Pi is probability of poor and (1- Pi) is probability of non-poorand is written as:
Second step is taking natural log of this odds ratio thus making Logit as:
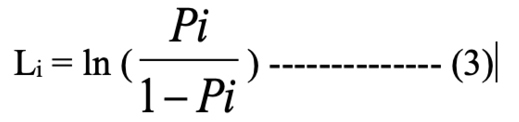
After applying log on odd-ratio it becomes a linear function of the parameters and explanatory variables both and equation becomes like.

Where β0 is intercept and all other betas are slope coefficient while X1 to Xk are the explanatory variables. In current study different variables including both quantitative (Xi) and qualitative information in the form of dummy variables(Di) were analyzed which are as follows:
Maximum likelihood: Maximum Likelihood Estimation (MLE) is used to estimate the parameters of the Logit model. As dependent variable is binary in nature so the variable and its error term is not normally distributed. MLE is appropriate in this case as it tries to maximize log likelihood (LL) instead of minimizing the residual (Meddala, 2007; Gujrati, 2005).
The odd ratios: Odd ratios are calculated to show the probability of some event to occur. The change in odds resulting from a unit change in predictor can be calculated by exponentiation the estimated parameter eβ i.e. odd ratios (Field, 2005). If exp β is greater than one it implies that as predictor increases the odds of the outcome occurring increases and vice versa (Field, 2005). In case of two identical groups of odds the odds ratio is equal to 1 (Field, 2005; Abdelrahman, 2010).
Marginal effects/ marginal probabilities: Estimated co efficient does not show the marginal effect on the dependent variable. Hence, for interpretation of parameters the slope coefficients are transformed (Green, 2003; Newell and Soren, 2003). For any distribution marginal probabilities are the first derivative but there is no need to check derivative if covariate is dummy variable (Kirchkamp, 2010).
Statistical significance/ goodness of fit test of logit model: Different tests are used to check the Individual and overall statistical significance of slope coefficients and the model and also to test goodness of fit of the logit model. These tests includePseudo-R2 (Bruderl, 1992), Pearson chi-square statistic (Hosmer et al., 1997), Likelihood ratio chi-square (Field, 2005; Green, 2003) etc. Predictive Accuracy of the Logit Model is measured through Sensitivity and Specificity (SAS, 1999) and ROC Curve (Weiss, 2008). If area under ROC curve is above 0.7 than results would be acceptable. Multicollinearity is also checked and is discussed later in detail.
Results and Discussion
Poverty estimation of respondents
Absolute (Unidimensional) poverty is estimated for registered members and non-members of AJKCDP. Estimated Results show that incidence of poverty (M0) for members is twenty eight percent and thirty three percent for nonmembers during 2015-16 in the study area. This shows a low poverty status of registered members as compared to non-members, similar to the research findings of Khurshid and Saboor (2013). According to them poverty of Agha Khan Rural Support Program’s registered members was proved to be less as compared to the non members. The poverty status estimates (M0) are further utilized in Logit model for analyzing correlates of poverty in the study area.
Econometric analysis of poverty correlates
This section presents the results for estimates of logistic regression which attempts to lay emphasis on major correlates of poverty status and it also assesses whether quantitative link can be possibly established between poverty status and poverty reduction programs like the one understudy, that is, “AJKCDP”.
The dependent variable is dichotomous as is the case in any standard logistic regression which assumes the value of 1 for poor and 0 for non-poor. The logistic regression is done for primary data collected for the year 2015-16 which covers 540 households that includes both those households who undertook in the program and those who opted out of it. It must be borne in mind here that poverty status is determined on the basis of shortfall in income from poverty line.
Logistic regression analysis
The maximum likelihood estimates for logistic regression are presented in Table 1 Most of the correlates are highly significant at 5 percent level of significance. The results indicate that households in which family head is working in either private or public sector has a better and statistically significant chance of being non-poor. Significant and regressive impact on being poor is also recorded for other variables like number of livestock, age of household head and is similar to finding of Hameed et al., 2018. If any female in the household does a job, number of physical assets, and squared of household head age are significantly contributing in poverty reduction. Total cultivated area of respondents also showed the significant negative relationship with poverty and this matches to Shugri, 2016.
Table 1: Explanatory variables of logit model.
| S. No | Variables used in current study |
| 1 |
D1 :1 for HHH* works in public sector 0 for self employed |
| 2 |
D2: 1 for HHH works in Private sector 0 for self employed |
| 3 |
X1: Number of Livestock |
| 4 |
X2: Number of Asset |
| 5 |
X3: Age of HHH |
| 6 |
X4: Total cultivated area |
| 7 |
D3: 1 if Female does some job, 0 for unemployed |
| 8 |
X5: HH* size |
| 9 |
D4: 1 for Presence of school, 0 for otherwise |
| 10 |
D5: 1 for Presence of First Aid, 0 for otherwise |
| 11 |
X6: Age of HHH Squared |
| 12 |
X7: HH Size Squared |
| 13 |
D6:Interaction between education of HHH and intervention |
| 14 |
D7: 1 for Intervention availed 0 for otherwise |
HHH*: Household Head; HH* : Household.
However, a couple of variables like presence of first aid facility and squared of household size though found out to be statistically insignificant still have expected signs of the coefficients. Nevertheless, it is peculiar to note that the coefficient of presence of school has a positive sign and is also statistically significant. This might hint towards apparent poor situation that characterize many schools in Pakistan at large which might also be consistent with those schools found in the study area. Consequently, the fact that presence of first aid facility has an insignificant impact on the probability of being non-poor and that presence of school is consistent with higher chance of being poor as shown by its positive and significant coefficient, this might suggest that health and education facilities are quite inefficient to reduce poverty levels.
Turning the attention towards assessing the impact of intervention on poverty status which is also the primary focus of this research, the results summarized in the table reveals that number of interventions taken by households plays no significant part in determining poverty status as its p-value is greater than the highest acceptable significance level of 10 percent. Along with this, the sign of its coefficient is also contradictory. However, using an interaction between number of interventions and education of household head presents an interesting result which can have implications for ensuring efficiency of any such poverty reduction schemes as the one under the focus of this research project. This interaction term has a negative sign and is also statistically significant at 5 percent level of significant and this implies that household heads with better education in terms of years of schooling have a better chance to escape poverty. All of these results are line with other studies like (Mok et al., 2007; Hashmi et al., 2008; Iqbal and Awan, 2010; Edoumiekumo et al., 2013; Naqvi et al., 2014).
The outcome of the results obtained is that poverty reduction program is a necessary condition for poverty reduction but education is a sufficient condition for ensuring that benefits of such programs can be translated into poverty reducing gains. Hence, education and poverty reduction programs are complementary inputs to any serious national poverty reduction effort. Analogy for this conclusion can be found in the coordination failure concept of economic development at the macro level in which a coordinated push is required to different parameters like education and health just to name a few in order to improve the level of development and not just to capital alone as commonly believed.
Odd ratios analysis: Odd ratios are a bit more intuitively appealing way of lending suitable explanation to the results found for logistic regression. Hence, Table 2 also includes odd-ratio values for each correlate. Ennin et al. (2011) states that a value of odd ratio (a) greater than one means that “success” is a times as likely to occur as “failure” for a unit change in X and in case of less than one, this implies that event is less likely to occur for a unit change in X. Consequently, as dependent variable in this study assumes 1 for poor and 0 for non-poor. A value of odd ratio less than 1 is more desirable. The results show that chance of being poor reduces by 74 percent for household heads in public sector while the same is 73 percent for those who are in private sector. This suggests that private sector and public sector employment has about the same impact on poverty status contrary to those results found by Ranathunga and Gibson (2014).
Table 2: Determinants of poverty: Maximum likelihood estimates: 2015-2016.
| Covariates | Coefficient | Odd-Ratio | Marginal effects | X | z-stat | P-value |
| HHH works in sector public | -1.01 | 0.36 | -0.16 | 0.32 | -3.41 | 0.001 |
| HHH works in private sector | -1.00 | 0.37 | -0.17 | 0.45 | -3.57 | 0.000 |
| Number of livestock | -0.08 | 0.92 | -0.01 | 5.37 | -3.63 | 0.000 |
| Number of assets | -0.31 | 0.74 | -0.05 | 3.56 | -3.41 | 0.001 |
| Age of HHH | -0.32 | 0.73 | -0.06 | 46.00 | -3.65 | 0.000 |
| Total cultivated area | -0.09 | 0.92 | -0.01 | 4.10 | -2.49 | 0.013 |
| Female does some job | -0.70 | 0.50 | -0.12 | 0.21 | -2.47 | 0.014 |
| HH size | 1.08 | 2.94 | 0.19 | 5.56 | 3.01 | 0.003 |
| Presence of school | 1.72 | 5.58 | 0.30 | 1.02 | 2.47 | 0.014 |
| Presence of First Aid | -0.01 | 0.99 | -0.01 | 0.57 | -0.06 | 0.954 |
| Age of HHH Squared | 0.00 | 1.00 | 0.00 | 2237.81 | 2.64 | 0.008 |
| HH Size Squared | -0.04 | 0.96 | -0.01 | 34.70 | -1.47 | 0.142 |
| Interaction between education of HHH and intervention | -0.06 | 0.94 | -0.01 | 7.80 | -2.23 | 0.026 |
| Intervention | 0.43 | 1.54 | 0.07 | 0.94 | 1.60 | 0.109 |
| Constant | 4.59 | 2.68 | 0.007 | |||
|
Pseudo R2 |
0.2580 | |||||
| Pearson goodness of fit test statistics | 494.24 (0.7468) | |||||
| Likelihood ratio chi-sq test statistic | 171.905 (0.0000) | |||||
| n*AIC/ BIC | 524.466/ -83.823 | |||||
| Specificity/ Sensitivity | 89.04% / 51.81% | |||||
| Correctly classified | 77.59 % | |||||
| Area under ROC curve | 0.8321 | |||||
| Iterations | 5 | |||||
Source: Author’s own calculations.
Similarly, an incremental increase in number of physical assets or livestock assets is consistent with 26 percent and 8 percent reduction in the probability of being poor respectively. In the same tune, an increase in household head age by one year would reduce the probability of being poor by 27 percent while increase in the size of cultivated area by an acre would cause a reduction by a mere of 8 percent. Likewise, probability of being poor reduces by 50 percent in those households in which a female does any kind of job and presence of school is associated with odds of being poor about 5 times as higher as that of non-poor households. As age doubles the odd of being poor is about as much as that of being non-poor since the value of odd ratio for household head age squared are 1. However, as for the interaction between education and number of interventions taken the odd ratio shows that about a simultaneous increase in schooling year and number of interventions reduces the chance of being poor by 6 percent.
Marginal effects analysis: Marginal effect is another interesting way to lend explanation to the correlates of logistic regression and hence, Table 2 makes a record of them. Along with this the added benefit of using marginal effect analysis is the use of threshold value for each correlate under investigation which is shown in the column X. However, the use of this threshold is of no value in case of dichotomous variable. Looking at the age variable of household head it can be seen that after passing the threshold age of 46 years any addition year in age reduces the chance of being poor by 6 percent. As for size of cultivated area, if threshold value of 4 acre is reached any further increase in cultivated area by 1 acre reduces the chances of being poor by 1 percent.
Concentrating on number of livestock assets and number of physical assets once threshold value of 5 and 3 in case of each respectively is reached any further addition in both kind of assets reduces the probability of any household to be poor by 1 percent and 5 percent for number of livestock assets and number of physical assets respectively. However, after a threshold of 5 family members any further addition to the household roster leads to increase the odds of being poor by 19 percent. Such poverty reducing patterns are also recorded for variables like household size squared and interaction between education and number of interventions as marginal effects in each case is -0.01. However, as for intervention variable it is found to be positive yet statistically insignificant.
Moving toward qualitative variables, marginal effects are -0.16, -0.17, and -0.12 for whether family head works in private sector, whether family head works in public sector, and whether any female is doing a job in the household respectively. This suggests that probability reduces for being poor in each case. Some of the other variables like presence of school and presence of first aid facility have marginal effects of 0.30 and -0.01 respectively though the coefficient for the latter is insignificant.
Individual significance of correlates
The model for determining poverty status is estimated using Maximum likelihood technique which lies at the core of any standard logistic regression. This estimation technique maximizes the log likelihood function through an iterative process like Newton’s method. However, there are still other methods as well like Pseudo likelihood and weighted likelihood which can also be used given certain pitfalls arises in terms of biasness of coefficients by maximum likelihood technique. As for the individual significance, the study has used p-value of z-statistic as more direct and operationally convenient way rather than using a more elaborate technique of comparing tabulated and estimated z-statistic value. Using three reference values for the level of significance as is often the case with any econometric analysis in research 1 percent, 5 percent, and 10 percent – it is found that apart from three variables which are household size squared, number of interventions taken, and whether health facility is available all of the variables are strictly significant at 5 percent or 1 percent level of significance. These p-values are also consistent for odd ratios and marginal effects.
Overall fit of the model
In order to assess the fitness of the model, the study has used pseudo R2, Pearson goodness of fit statistic, and likelihood ratio of chi-statistic. As for the value of pseudo R2 it can be seen in Table 1 that the correlates help explain about 25 percent variation and this low value is consistent with any analysis based on cross sectional data. Similarly, the value for Pearson goodness of fit statistic is evaluated using its p-value against the null hypothesis that model is good fitted as suggested by Stata Manual. Hence, as its p-value is greater than the acceptable benchmark value of 5 percent and 10 percent, the null hypothesis of a good fitted model can’t be rejected on any grounds. Turning towards likelihood ratio of chi-square test statistic, Table 1 shows that its corresponding p-value is less than 1 percent hence it implies that at least one correlate is non-zero and this leads to the conclusion that model is reliable and good fitted.
Tests for predictive accuracy
ROC value and sensitivity and specificity values are used to check of predictive accuracy. Where sensitivity shows the percentage of true positive identified by the test as meeting a certain while as for specificity it measures the proportion of true negative correctly specified. ROC curve is plotted with sensitivity on the vertical axis and 1-specificit on the vertical axis for each cut-off point. The corresponding curves for each of these can also be found in the appendix. Table 1 also records the values of each of these tests.
Though higher values are ideal for sensitivity and specificity are ideal, as for this study using a cut-off point of 0.5 the value for sensitivity and specificity is 89 percent and 51 percent respectively while about 77 percent are correctly classified (Supplementary Figure 1). In case ROC value, it is found to 0.83 which confirms good predictive accuracy (Supplementary Figure 2).
Multicollinearity diagnostics
Multicollinearity is the prospective relationship between the independent variables of any deterministic regression and this logic also extends to logistic regression. The importance for checking for multicollinearity arises because any model ridden by it results in inefficient estimators. However, some degree of multicollinearity always exists between independent variables. Hence, standard methods to check for multicollinearity are used for the logistic regression in Table 1 which can be found in the appendix iii. Before assessing these methods, it must be mentioned here that the model has used squared terms for household size and age of household head so correlation between them would be extremely high. Another way which is constructed from another variable in the model is interaction between number of interventions and education in terms of years of schooling for household head only. Hence, there is high correlation between number of interventions and this interactions term is inevitable.
Consequently, as suggested by Jaccard and Turrisi (2005) one way to get around this is by using the mean centered approach which subtracts mean from each value of the variable concerned before checking for Multicollinearity. Hence, age squared is calculated by first subtracting average age from each value of age and then squaring it. The same comes out for household size and number of interventions and education of household head. After making these adjustments, it can see in the Supplementary Table 1, that value of VIF, TOL, and R-squared are all well below the alarming level in case of VIR and R-squared and well above in case of TOL. As for correlation coefficient, it is also low between each possible pair of independent variables as shown in Supplementary Table 2. One important observation from correlation matrix is that age and age squared in only 0.14 while for household size and household size squared, it is only 0.56. These values have emerged as the result of the adjustment mentioned above.
Conclusions and Recommendations
This research endeavor concludes that practicing dynamics of community development on local level has been successful in improving welfare of people by eradicating poverty through the participation of communities. This study is the novel and opening attempt to map and measure the extent of poverty in AJK through FGT measure. The results clearly indicate that AJKCDP was successful in decreasing the incidence of poverty of AJK through different interventions for development of communities. In the research area age and employment status of household head, livestock availability, physical assets and female employment have significant negative relationship with poverty thus played an important role in reducing poverty. As far as interventions of the program under study are concerned, an important implication was observed that these interventions have significantly reduced poverty only for educated members thus highlighting the importance of education dimension in such developmental ventures.
Although a sufficient amount of attention was given by AJKCDP in community development through COs but there remained a few shortcomings which call for a skillful notice. Based on face-to-face interactions with respondents and data analysis of research findings, following policy lessons have been derived for further improvement in the valley and for replicating the same development initiatives in fine-tuned ways. Gender friendly policies are highly recommended especially in the remote regions where women spent a plenty of their time in domestic affairs. Their fundamental awareness and empowerment through trainings and skill development is highly linked to the reduction of poverty through health improvements, child care and employment generation. The provision of infrastructure on priority basis is required particularly in education sector and it can be done by involving local communities through cooperation of private sector. In general, the structured roads and facilitating transport system can give a good boost to the tourism industry which would further create employment and other economic opportunities.
Supplementary Material
There is supplementary material associated with this article. Access the material online at: http://dx.doi.org/10.17582/journal.sja/2020/36.2.593.602
Novelty Statement
This research study is the novel and opening attempt to map and measure the ex-tent of poverty in AJK through FGT measure. The major findings indicate that AJK-CDP is successful in diminishing the incidence of poverty at AJK through different interventions for development of communities.
Author’s Contribution
Gulnaz Hameed: Designed the central theme of this re-search and specified the study model.
Abdul Saboor: Supervised this research endeavor and contributed in data analysis.
Khuram Nawaz Sadozai: Contributed in data anal-ysis and helped in the major results write-up.
Ghaffar Ali: Helped in the proofreading and provided the technical backstopping for this research.
Dawood Jan: Provided the technical backstopping for this research.
Mansoor Rasheed: Helped in the review of literature, data entry and proofreading.
References
Abdelrahman, A.I., 2010. Applying logistic regression model to the second primary cancer data http://interstat.sta2010/articles/1001006.pdf. Searched on 30-12-2010.
AJK community development program. 2010. Planning and development department, Azad Government of the state of Jammu and Kashmir.
Bogale, A., D. Bacha, R. Namara and A. Tesfaye. 2011. Impact of small scale irrigation on household poverty: empirical evidence from the ambo district in Ethiopia. Irrig. Drain., 60(1): 1-10. https://doi.org/10.1002/ird.550
Bokosi, F.K., 2006. Household poverty dynamics in Malawi. MPRA Paper No. 1222. Available at http://mpra.ub.uni-muenchen.de/1222
Bruderl, J., 1992. Applied regression analysis of stata. Lectures Mannheim. pp. 25.
Buhl, S. and R. Sen. 2006. A preliminary poverty impact assessment. Indo-German Dev. Cooper. Natl. Resour. Manage. pp. 1-73.
Chaudhry, I.S., 2009. Poverty alleviation in Southern Punjab (Pakistan): An empirical evidence from the project area of Asian Development Bank. Int. Res. J. Finance Econ., ISSN 1450-2887.23. pp. 23-32.
Edoumiekumo, S.G., S.S. Tombofa and T.M. Karimo. 2013. Multidimensional energy poverty in the South-South Geopolical zone of Nigeria. J. Econ. Sustainable Dev., 4(20): 42-51.
Farooq, S., 2014. Effectiveness of cash transfer programmes for household welfare in Pakistan: The case of the Benazir Income Support Programme. Pak. Dev. Rev., 53(2): 145-174. https://doi.org/10.30541/v53i2pp.145-174
Ennin, C.C., P.K. Nayarko, A. Agyeman, F.O. Mettle and E.N. Nortey. 2011. Trend analysis of determinants of poverty in ghanna: Logit approach. Res. J. Math. Stat., 3(1): 20-27.
Field, A., 2005. Discovering statistics using SPSS.2nd eds. Sage Publications, London. pp. 124-189.
Gujrati, D.N., 2005. Basic econometrics. Fourth Edition. Mc. Grawhill Inc. pp. 32.
Green, W.H., 2003. Econometrics analysis. Fifth Edition. Dorling Kindersley (India) Pvt. Ltd. ISBN 978-81-7758. 684-688.
GoP, 2013-14. Economic survey of Pakistan. Ministry of finance, Pakistan.
GoP, 2016-17. Economic survey of Pakistan. Ministry of finance, Pakistan.
Hameed, G., A. Saboor, A.U. Khan, I. Ali and M.K. Wazir. 2017. Impact of community development in poverty reduction: reflections of Azad Jammu and Khasmir community development program. Soc. Indic. Res., 130: 1073-1086. https://doi.org/10.1007/s11205-016-1235-3
Hameed, G., S. Shaheen, A. Saboor and K.N. Sadozai. 2018. Tracing the causality between livestock and poverty alleviation in the rural economy of Gilgit Baltistan-Pakistan. E3S Web Conf. Volume 52, 2018. http://www.e3sconferences.org/articles/e3sconf/abs/2018/27/contents/contents.html
Hashmi, A.H., A.A. Maann, K. Asghar and M. Riaz. 2008. Gender role in livestock management and their implication for poverty reduction in rural Toba Tek Singh, Punjab-Pakistan. Pak. J. Agric. Sci., 44(4): 674-678.
Hosmer, D.W., T. Hosmer, S.L. Cessie and S. Lemeshow. 1997. A comparison of goodness of fit tests for the logistic regression model. Stat. Med., 16: 965-980. https://doi.org/10.1002/(SICI)1097-0258(19970515)16:9<965::AID-SIM509>3.0.CO;2-O
Iqbal, N. and M.S. Awan. 2010. Determinants of urban Poverty; the case study of medium sized city in Pakistan. Pak. Inst. Dev. Econ. Rev., 47(4): 909-923.
Jaccard, J. and R. Turrisi. 2005. Interaction effects in multiple regression. Series: Quantitative application in the social sciences. second edition. A sage united paper. https://mises.org/sites/default/files
Kirchkamp, O., 2010. Advance econometrics. University of Jena. pp. 342-398.
Khurshid, N. and A. Saboor. 2013. Impact assessment of economic interventions of AKRSP on the lives of rural women: a case study of northern areas of Pakistan. Int. J. Econ., Commerce Res., 3(1): 49-56.
Maddala, G.S., 2007. Introduction to econometrics. Third edition. Wiley India Ltd. pp. 316-332.
Mathie, A and G. Cunningham. 2010. Asset-based community development as a strategy for community-drive development. Dev. Pract. 13(5): 474-486. https://doi.org/10.1080/0961452032000125857
Moseley, M.J., 2003. Rural development: Principles and practice London: SAGE Publications Ltd.
Mok, T.Y., C. Gan and A. Snayal. 2007. The determinants of urban household poverty in Malaysia. J. Soc. Sci., 3(4): 190-196. https://doi.org/10.3844/jssp.2007.190.196
Naqvi, M.A., H.M. Sabir, A. Shamim and M. Tariq. 2014. Social safety nets and poverty in Pakistan: A case study of BISP in tehsil Menkera district Bhakkar. J. Finance Econ., 2(2): 44-49. https://doi.org/10.12691/jfe-2-2-1
Olaniyan, O. and A.S. Bankole. 2005. Human capital capabilities and poverty in rural Nigeria. Afr. Econ. Res. Consortium (AERC). pp. 1-43.
Phillips, R. and R.H. Pittman. 2008. An introduction to community development. Taylor and Francis. pp. 23. https://doi.org/10.4324/9780203886939
SAS. 1999. Categorical data analysis. NCSSM Statistics Leadership Institute. pp. 1-3.
Saleem, M., 2001. Impact of micro-credit scheme of Punjab Rural Support Program on the people of rural areas of Sargodha region, Pakistan. Biblography, Univ. Agric., Faislabad. pp. 109.
Shehu, R.I., Y.Z. Abdullahi and H.M. Aliero. 2012. Impact of IFAD poverty intervention program on rural poverty reduction in selected LGA’s of Sokoto state. J. Res. Natl. Develop. 10(2): 266-274. .
Sokoto, A.A., 2002. Grass root microcredit scheme in Nigeria: A case study of SACDO/IFAD cooperation. A Phd thesis Submitted to the Dep. Econ. Usmanu Danofodiyo Univ., Sokoto.
Shugri, F.F., 2016. Dimensions and determinants of poverty in agro-pastoral households of Kabribayah District, Fafan Zone, Somali Regional State, Ethiopia (Doctoral dissertation, Haramaya University, Haramaya).
UNDP, 2000. Human development report. Oxford, Oxford University Press. pp. 62.
World Bank. 2006. Equity and development. World development report. pp. 1-273.
Weiss, J., 2008. Lectures at University of North Carolina, Chapel Hill. Retrieved from http://langston.web.unc.edu/files/2014/08/curvitae.pdf. Searched on 30-12-2013.
To share on other social networks, click on any share button. What are these?


