

Complete Mitochondrial Genome of Three Fish Species (Perciformes: Amblyopinae): Genome Description and Phylogenetic Relationships


Complete Mitochondrial Genome of Three Fish Species (Perciformes: Amblyopinae): Genome Description and Phylogenetic Relationships
Zisha Liu1, Na Song1, Takashi Yanagimoto2, Zhiqiang Han3, Bonian Shui3 and Tianxiang Gao3*

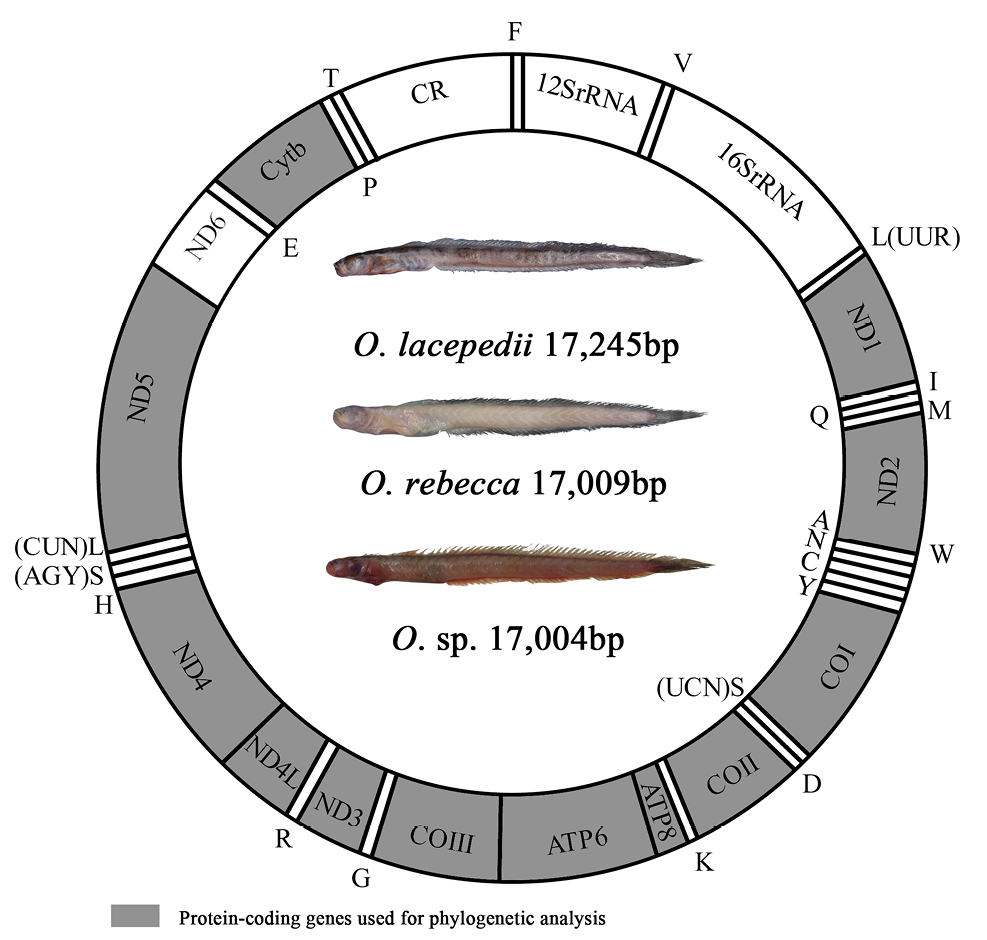
Gene organization of the mitochondrial genome of O. lacepedii, O. rebecca and O. sp. All protein-coding genes are encoded on the H-strand, with the exception of ND6 which is encoded on the L-strand. The two ribosomal RNA genes are encoded on the H-strand. Transfer RNA genes are designated by single-letter amino acid codes. Genes encoded on the H-strand and L-strand are shown outside and inside the circular gene map, respectively.

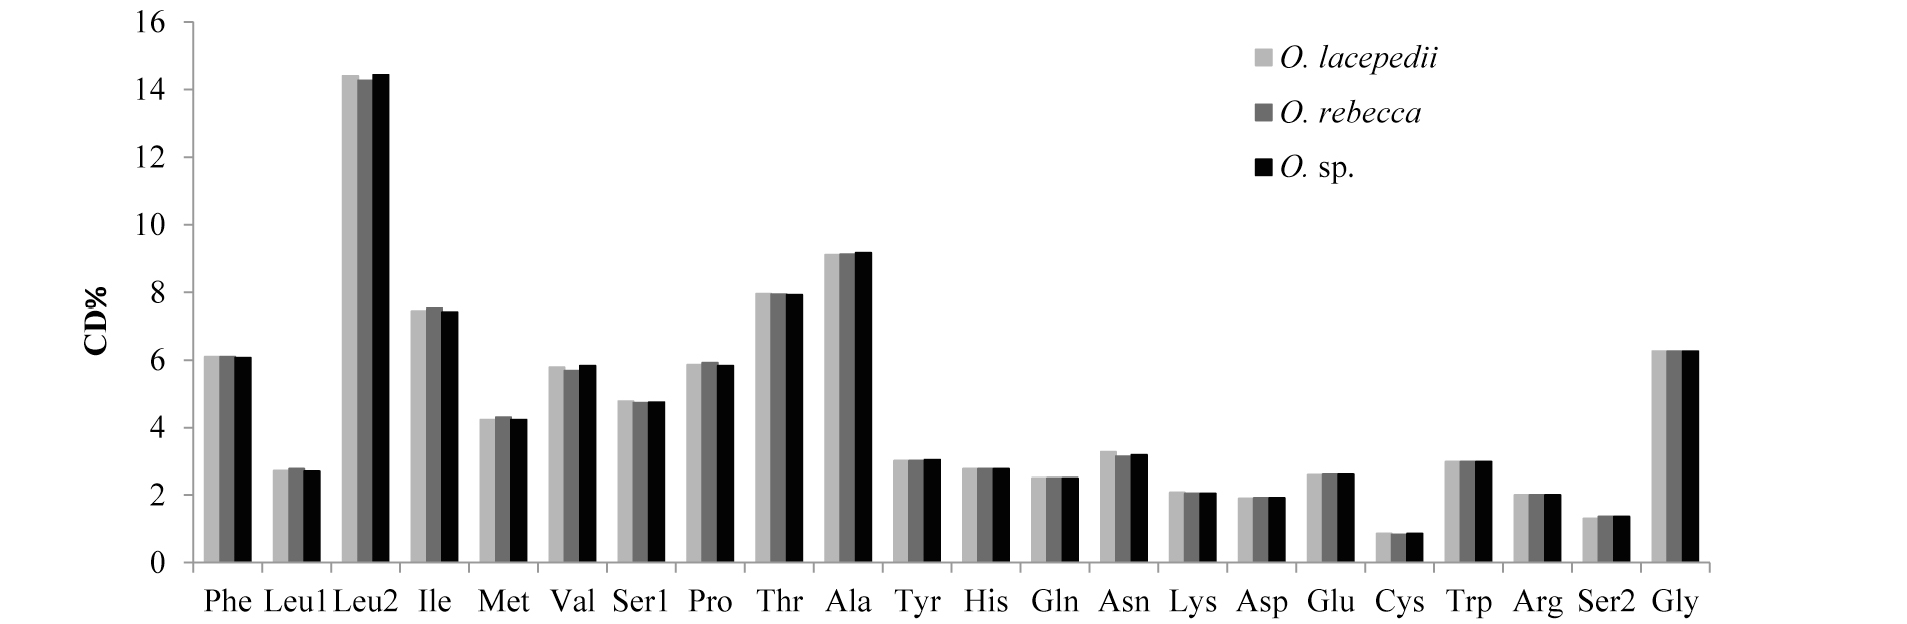
Codon distribution in 13 protein-coding genes of O. lacepedii, O. rebecca and O. sp. with 3805 codons, 3804 codons and 3805 codons, respectively, for each mitochondrial sequence analysis, excluding all stop codons. CDs%, the percentage of codons.
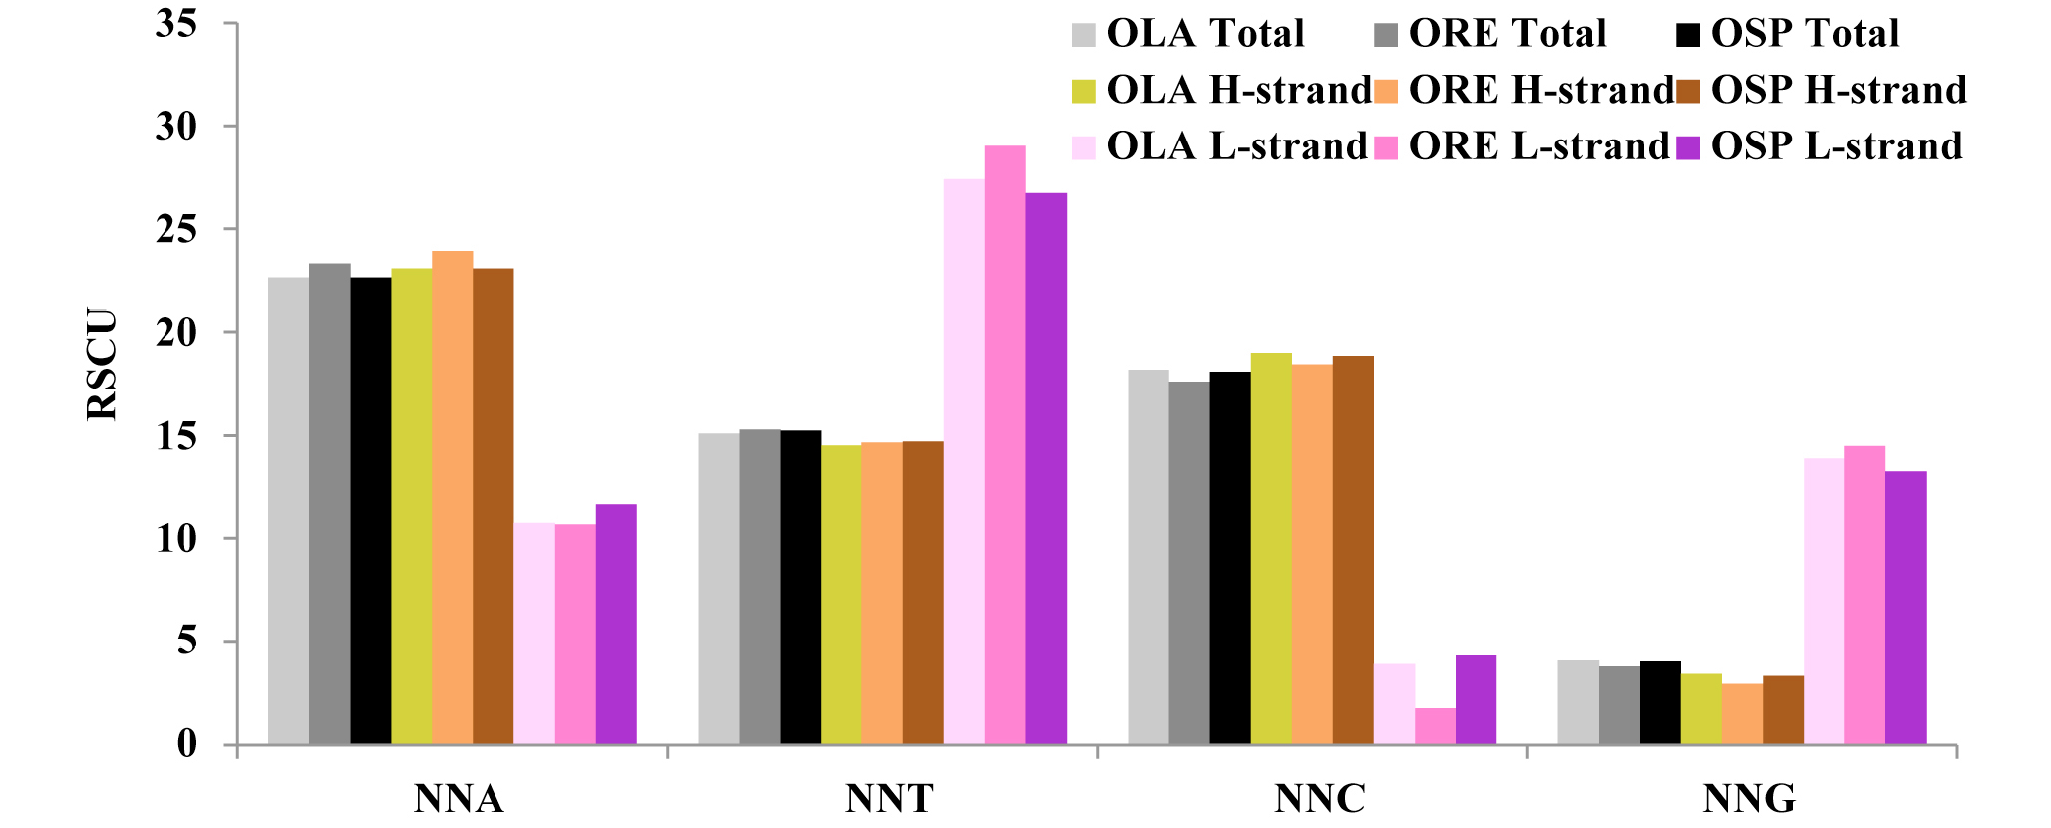
Frequencies of codons ended with the same nucleotide on total and each strand (H, L) of O. lacepedi, O. rebecca and O. sp. mitogenomes. Values on the y-axis indicate the sum of RSCU values of codons ended with the same nucleotide across all codon families (x-axis). RSCU, relative synonymous codon usage. OLA, O. lacepedi. ORE, O. rebecca. OSP, O. sp.

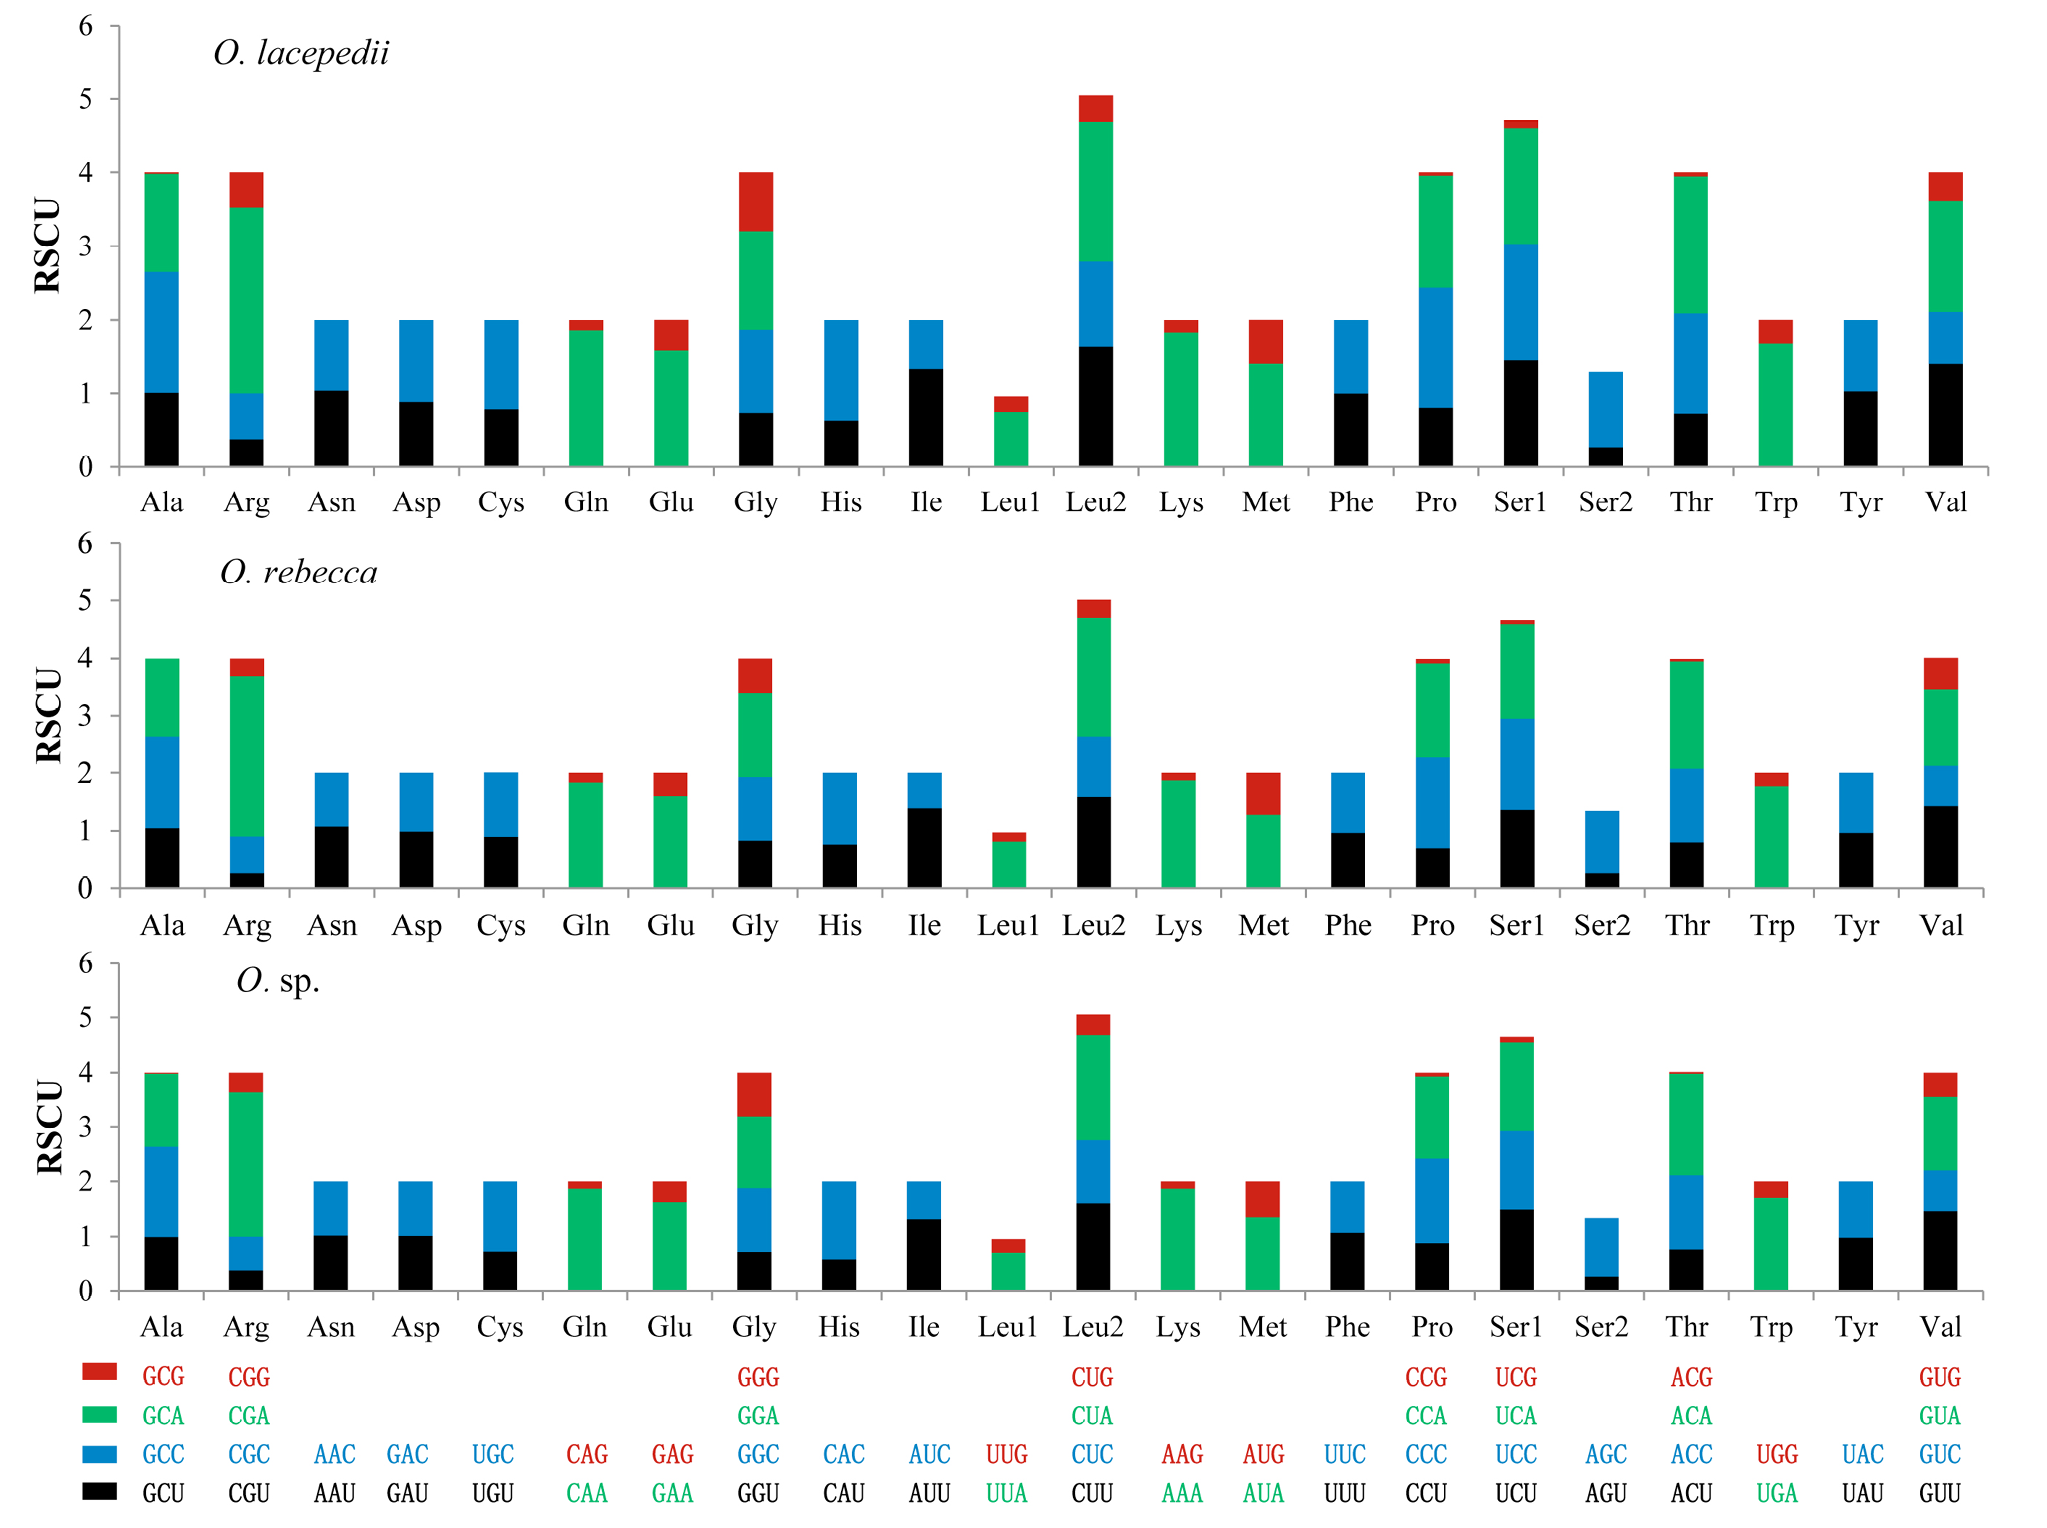
RSCU in 13 protein-coding genes of O. lacepedii, O. rebecca and O. sp. Codon families are provided on the x-axis.
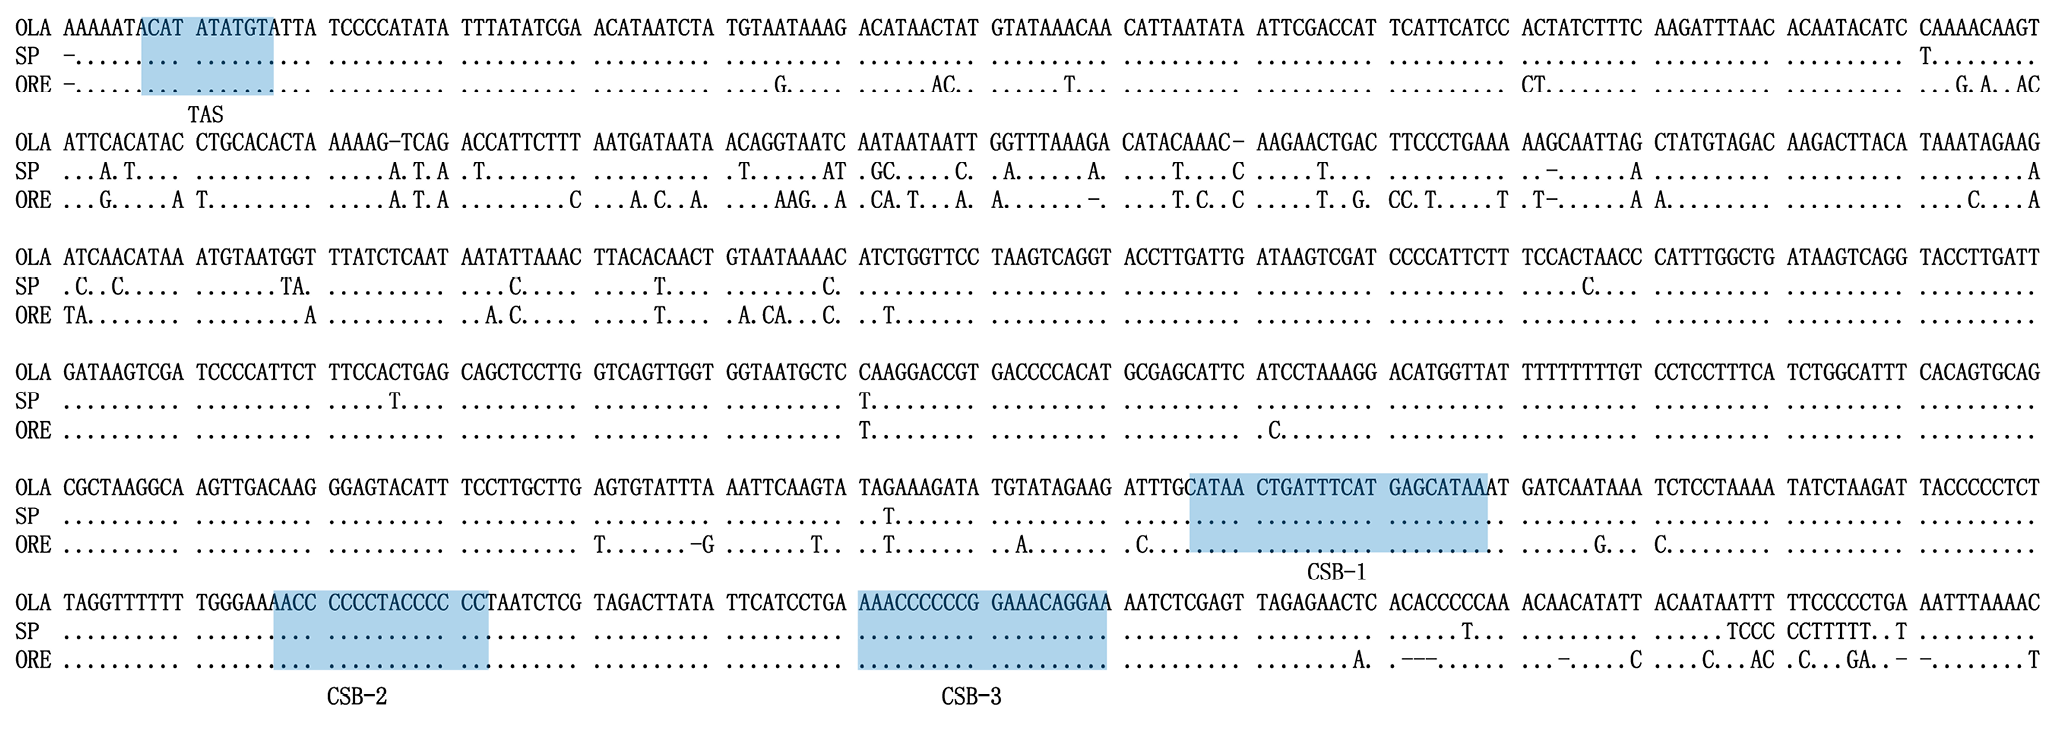
Comparison of the characteristics of mitochondrial control region of three gobies. TAS: termination-associated sequence; CSB-1, 2, 3: conserved sequence blocks 1, 2 and 3.
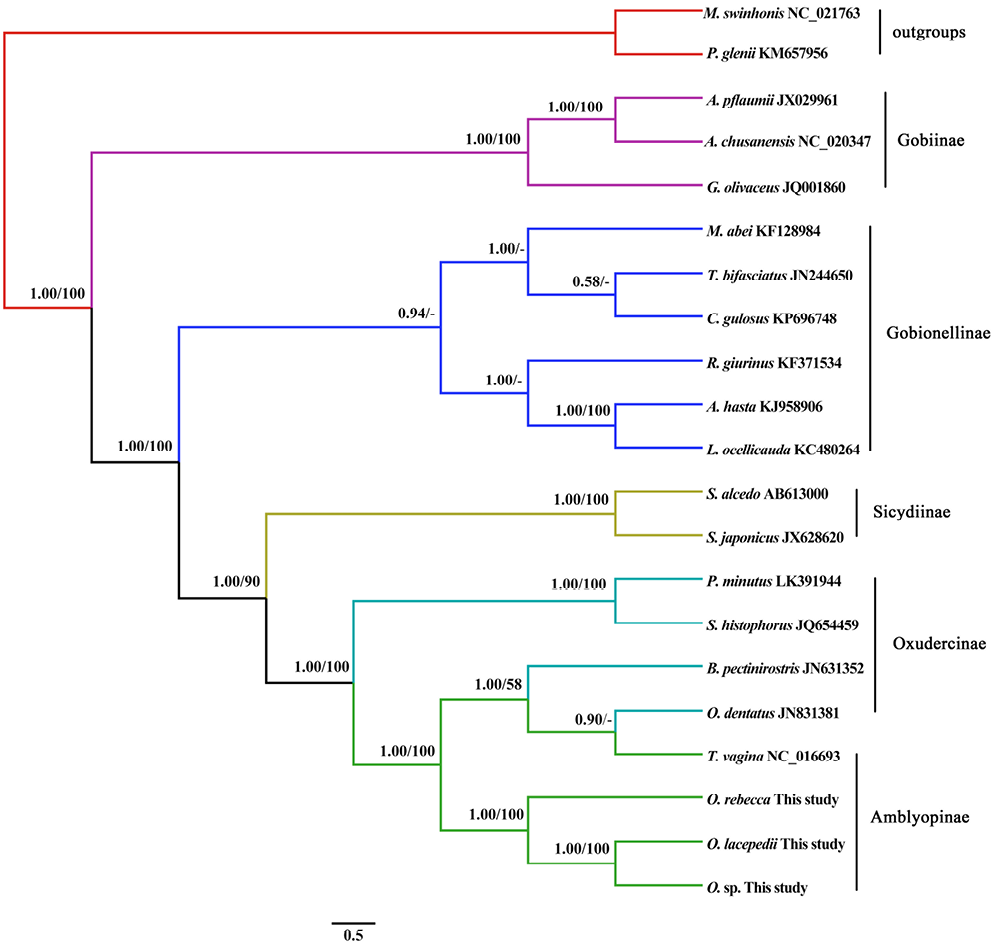
Phylogenetic tree of Gobiidae fishes based on 12 protein-coding genes excluding ND6 gene. The tree was built based on the TIM3+I+G model (-ln L= 119,585.39, A:C:G:T= 0.3172, 0.3187, 0.1016, 0.2625, I= 0.2830, G= 0.4140). The topology generated by Bayesian inference is shown, and is identical to the result of maximum likelihood analyses. Bayesian posterior probabilities and bootstrap support values above 50% replicates are shown adjacent to each internode. M. swinhonis and P. glenii were used as outgroups.


