
Comparison Among Different Stability Models for Yield in Bread Wheat


Comparison Among Different Stability Models for Yield in Bread Wheat
Malak Atiq Ullah Khan1*, Fida Mohammad2, Fahim Ullah Khan3, Sheraz Ahmad2, Mian Ahmad Raza1 and Tariq Kamal1
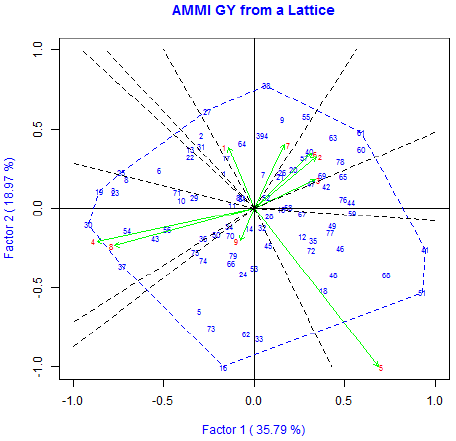
Figure 1
AMMI biplot for grain yield.

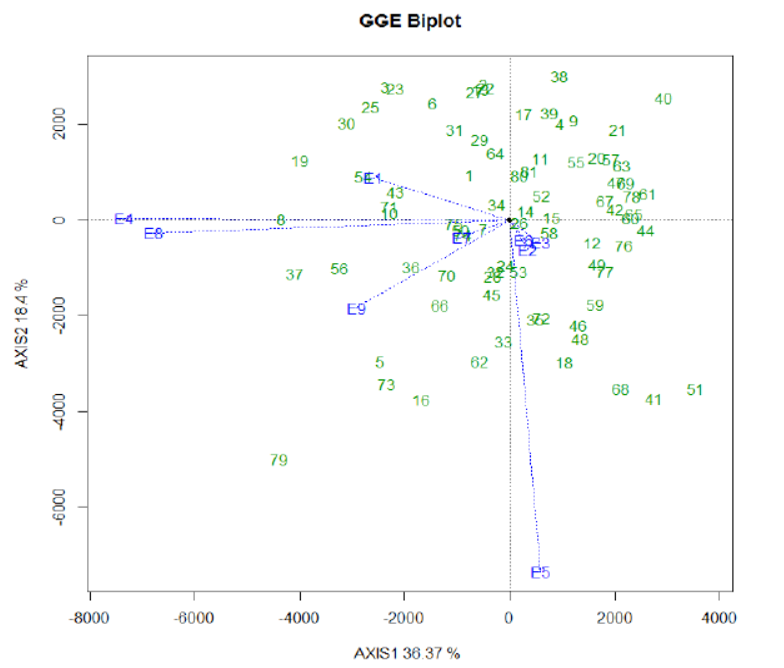
Figure 2
GGE biplot for grain yield.
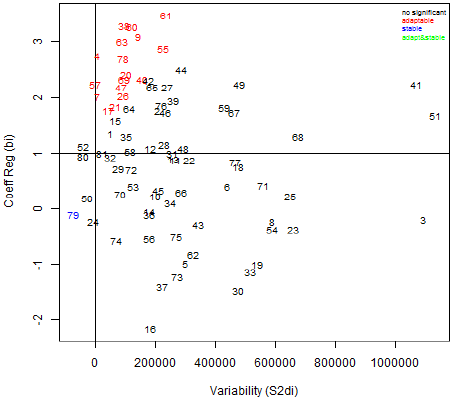
Figure 3
Eberhart and Russel (bi, S2di) biplot for grain yield.
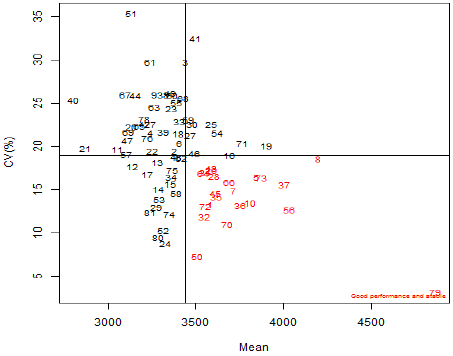
Figure 4
Francis (CV) vs. Mean biplot for grain yield.

March 2020
Vol. 36, Iss. 1, Pages 1-374


