

Comparing Predictive Performances of some Nonlinear Functions and Multivariate Adaptive Regression Splines (MARS) for Describing the Growth of Daera Dın Panah (DDP) Goat in Pakistan


Comparing Predictive Performances of some Nonlinear Functions and Multivariate Adaptive Regression Splines (MARS) for Describing the Growth of Daera Dın Panah (DDP) Goat in Pakistan
Senol Celik1,*, Ecevit Eyduran2, Adile Tatliyer3, Koksal Karadas4, Mehmet Kazim Kara2 and Abdul Waheed5
1Bingol University, Agricultural Faculty, Department of Animal Science, Bingol, Turkey
2Igdir University, Agricultural Faculty, Department of Animal Science, Igdir, Turkey
3Sutcu Imam University, Faculty of Agriculture, Department of Animal Science, Kahramanmaras, Turkey
4Igdir University, Agricultural Faculty, Department of Agricultural Economics, Igdir, Turkey
5Bahauddin Zakariya University, Faculty of Veterinary Sciences, Department of Livestock and Poultry Production, Multan, Pakistan
ABSTRACT
This study was conducted to evaluate the most suitable nonlinear functions amongst Morgan-Mercer-Flodin (MMF), Logistic, Von-Bertalanffy and Janosheck models, based on monthly records of body weight from birth to 1 year in Daera Din Panah (DDP) goat. Based on coefficient of determination (R2), adjusted coefficient of determination (R2ADJUSTED) and root mean square error (RMSE) were used. Janosheck model was chosen as the most appropriate model for its highest R2 (0.999) and smallest RMSE (0.124). Growth related parameters (A, B, k, and d) of the Janoscheck non-linear model were estimated as 43.000, 0.905, 0.124 and 0.950, respectively. To conclude, it could be suggested that the Janoscheck non-linear model might help breeders who aim to make precise decisions on optimum slaughtering time and to ensure suitable managerial conditions in DDP goat.
Article Information
Received 18 February 2017
Revised 01 May 2017
Accepted 18 May 2017
Available online 12 April 2018
Authors’ Contribution
SC, EE and AW conceived and designed the study and wrote the article, AT and MKK analyzed the data. KK helped in acquisition of data.
Key words
Growth models, Body weight, Non-linear function, DDP goat.
DOI: http://dx.doi.org/10.17582/journal.pjz/2018.50.3.sc2
* Corresponding author: senolcelik@bingol.edu.tr;
celsan969@gmail.com
0030-9923/2018/0003-1187 $ 9.00/0
Copyright 2018 Zoological Society of Pakistan
Growth, one of the most essential characteristics, is defined by the increase in size, number, or mass across certain period. It does not only include the etiology and phenomenology but also growth rates that change during the lifetime, from the first embryonic stages up to adult weight (Bahreini-Behzadi et al., 2014). The growth is the sigmoidal relationship between age and body size or weight. The shape of the growth is depicted with growth curves drawn by non-linear functions whose biological parameters were evaluated as indirect selection criteria for goat breeding program. In this context, Bathaei and Leroy (1998) estimated genetic correlations between biological parameters of the non-linear functions, which provides baseline information for future selection programs to be conducted for Mehraban Iranian fat-tailed sheep.
The shape of the growth curves, which is assumed to be generally asymptotic, is affected by the combined effect of genetic and environmental factors in farm animals, like sheep, goat, and cattle. Growth curves drawn to describe the sigmoidal shape by non-linear functions aid goat breeders to apply the best possible feeding programs and to find optimum slaughtering age in goat breeds (Kor et al., 2006; Eyduran et al., 2008).
For these previous studies, carefully recording live weights is required such as monthly, fortnightly etc. In order to describe the biological system of the growth, numerous nonlinear functions have been developed and used by earlier scientists (Kor et al., 2006; Kucuk et al., 2009; Ozdemir and Dellal, 2009; Waheed et al., 2011; Nouman and Abrar, 2013; Cak et al., 2017); however, there is no research on analysis of data mining algorithms on describing the growth of different goat breeds. Besides, the growth of Daera Din Panah (DDP) goat under investigation has been not yet described by some non-linear functions and especially MARS among the algorithms. Hence, the aim of this study was to determine the best nonlinear function for obtaining precious information on the growth of DDP goat. This information may be useful for finding ideal slaughtering age, and applying the best possible feeding programs in the goat. As an alternative to the non-linear functions, MARS data mining algorithm has been employed for the first time to explain the body weight-age relationship of the DDP goat, of great importance for rural development in Pakistan.
Materials and methods
The study was conducted on 54 DDP goat. The body weight of each goat was recorded monthly from birth to 1 year age. The average body weight of these DDP goat for each time period was used in the study. The body weight averages by time periods are shown in Table I.
Table I.- Average body weights of the DDP goat by time periods.
| Age(time) | Weight(kg) | Age (time) | Weight(kg) |
| 0 | 3.99 | 210 | 25.60 |
| 30 | 8.95 | 240 | 27.10 |
| 60 | 12.33 | 270 | 28.52 |
| 90 | 15.57 | 300 | 29.96 |
| 120 | 17.94 | 330 | 31.39 |
| 150 | 21.12 | 360 | 32.78 |
| 180 | 24.00 |
In the study, four different non-linear functions describing growth-age relationship of the DDP goat are as follows:
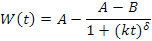
Janoschek:

Morgan-Mercer-Flodin:
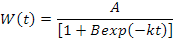
Logistic:
Von Bertalanffy:
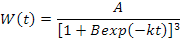
Where, W(t) is live body weight at age t (day), A is asymptotic weight, which is explained as mature weight, B is an integration constant related to initial live weight. The value of B is illustrated by the initial values for W(t) and k is the maturation rate interpreted as weight change in relation to mature weight to show how fast the animal reaches adult weight.
Goodness of fit criteria were utilized to make a decision on determining the best appropriate model among the nonlinear functions. Among those, Root Mean Square Error (RMSE) measures the error in the squared terms and the Coefficient of Determination (R) shows how well a model fits the data. The adjusted coefficient of determination (R2Adj) was also used for comparing the nonlinear functions having parameter number. The best model has the model with highest R2 and R2Adj but the lowest RMSE. Formulas of the criteria are:
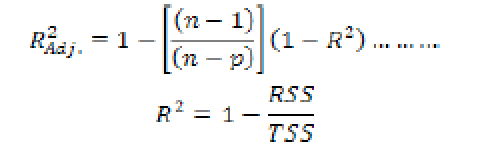
Where, TSS is the total sum of squares, RSS is the residual sum of squares, n is the number of observations (data points) and p is the number of parameters in the equation.
R2 is a number that indicates the proportion of the variance in the dependent variable that is predictable from the independent variable. It is a measure that allows us to determine how certain one can be in making predictions from a certain model. Also RMSE (root-mean-square error), which is calculated as the square root of the mean squared error (Grzesiak and Zaborski, 2012; Ali et al., 2015):
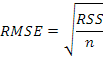
Where, RSS is the residual sum of squares and n is the number of training cases in a data set.
Prediction equation of the MARS model can be written as follows:
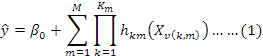
Where, Ῡ is the predicted value of the dependent (body weight) variable, βo is a constant, hkm (Xv(k,m)) is the basis function, in which v(k,m) is an index of the predictor employed in the mth component of the kth product and Km is the parameter limiting the order of interaction.
The maximum number of basis functions in the current analysis was 100 and no interaction effects were used. After building the most complex MARS model, the basis functions that did not contribute much to the quality of the model performance were eliminated in the process of the so-called pruning based on the following generalized cross-validation error (GCV) (Kornacki and Ćwik, 2005):
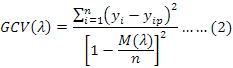
Where, n is the number of training cases, yi is the observed value of a response variable, yip is the predicted value of a dependent variable, M(λ) is a penalty function for the complexity of the model containing λ terms. In the MARS model, p is defined as number of terms. Numbers of terms and basis functions were set at 2 and 1 to best define here on the growth.
In order to describe the relationship between live body weight and age, NCSS 11 (trial version) package program was used to perform the statistical analysis. Analysis of MARS model was performed by Statistica 8.0 (trial version).
Results and discussion
The estimated parameters of the nonlinear functions are presented in Table II. All the nonlinear functions fitted to the relationship between body weight-age of DDP goat gave very fit; however, Janosheck non-linear function showed slightly better compared to others.
The growth curve graph is presented in Figure 1. The fitted curves of MMF, Janosheck and Logistic growth model showed the same trend, but Von Bertalanffy showed a little differ from others. As seen from Figure 1, the observation points overlapped the growth curves constructed by the nonlinear functions. This case implied that there were no outliers as also reported by Kor et al. (2006) and that managerial condition and feeding system for the kids included in our study were appropriate.
In the study, it was evidence that MARS specified for the first time in literature was a respectable alternative with 0.970 R2, 0.960 R2ADJUSTED, 1.202 RMSE and 1.445 MSE with the simple and understandable prediction equation W=11.26833 + 0.07073*max(0; t - 30) without only 0th time point where t is time period (day). Body weight predicted by MARS was somewhat too high for t lower than or equal to 30 days. For example, W prediction at t=60 of a DDP goat was W=11.26833 + 0.07073*max(0; 60 - 30) = 13.39 kg where max(0; 60-30)=30.
There is growing interest on describing the growth of various sheep, goat and cattle breeds at different places of the world. Kor et al. (2006) reported that Weibull (99.32 %R2) was the best nonlinear function model for Akkeci (White goat) female kids. The present estimates of all the nonlinear functions were observed to be higher than Weibull estimate of Kor et al. (2006). Kucuk et al. (2009) determined Gompertz nonlinear model as an ideal growth model for colored Mohair kids (99.94 and 99.98 %R2) and Angora goat x colored Mohair crossbred F1 kids (99.99 and 99.97 %R2) for male and female kids, respectively, which was in almost agreement with R2 estimates of the nonlinear functions used in our study. Ozdemir and Dellal (2009) recorded for young Angora goats that the best describing nonlinear functions were Logistic (95.7 %R2) and Gompertz (95.6 %R2).
Table II.- Estimated parameters ± SE of various growth models fitted to body weight.
| Model |
Parameters |
|||||||
|
A |
B |
k |
d |
R2 |
Adj. R2 |
MSE |
RMSE |
|
| Janoschek |
43.000± 3.250 |
0.905± 0.012 |
0.124± 0.008 |
0.950± 0.56 |
0.999 |
0.997 |
0.124 |
0.352 |
| Morgan-Mercer-Flodin |
59.448± 7.014 |
4.092± 0.359 |
0.089± 0.021 |
1.004± 0.075 |
0.999 |
0.997 |
0.133 |
0.365 |
| Logistic |
35.527± 0.945 |
4.138± 0.425 |
0.404± 0.035 |
- |
0.989 |
0.988 |
1.099 |
1.048 |
| Von Bertalanffy |
35.630± 0.920 |
0.478± 0.011 |
0.220± 0.014 |
- |
0.997 |
0.996 |
0.327 |
0.572 |
W(t), live body weight at age t (day); A, asymptotic weight; B, integration constant related to initial live weight; k, maturation; d, curve correction parameter
Studying the growth of Colored Mohair kids, Cak et al. (2017) reported that Gompertz and Richards models (99.70%) for single and Richards model (99.57%) for twin kids were the most suitable in describing the growth. Nouman and Abrar (2013) suggested Gompertz model to obtain the highest predictive accuracy for Beetal goats. Waheed et al. (2011) informed that Brody and Gompertz nonlinear functions accounted for the growth of the Beetal kids at the highest predictive accuracy.
The variability in the literature may be ascribed to differentness in breed, gender, birth type, dam age, managerial conditions, rearing systems, and nonlinear functions or alternative statistical approaches (MARS etc.) used. With the MARS algorithm, the complex relationship between predictors i.e., nominal, ordinal and scale may be evaluated simultaneously.
Conclusion
As a result of this study, four different growth functions (Janosheck, Logistic, Von Bertalanffy and Morgan-Mercer-Flodin) were investigated to describe the growth in the body live weight of DDP goat breed from birth to 1 year of age. The Janoscheck non-linear model gave more reliable results for the body weight–age relationship with a high coefficient of determination and the lowest mean square error. The Janoscheck growth model might help goat breeders to plan effective breeding programs, to set the best possible feeding and management systems and to decide the best slaughtering age. Also, the prediction equation constructed by MARS data mining algorithm may be recommended in defining the body weight-age relationship in DDP goat.
Statement of conflict of interest
Authors have declared no conflict of interest.
References
Ali, M., Eyduran, E., Tariq, M.M., Tirink, C., Abbas, F., Bajwa, M.A., Baloch, M.H., Nizamani, A.H., Waheed, A., Awan, M.A., Shah, S.H., Ahmad, Z. and Jan, S., 2015. Pakistan J. Zool., 47: 1579-1585.
Bahreini-Behzadi, M.R., Aslaminejad, A.A., Sharifi, A.R. and Simianer, H., 2014. J. agric. Sci. Technol., 16: 57-68.
Bathaei, S.S. and Leroy, P.L., 1998. Small Rumin. Res., 29: 261-269. https://doi.org/10.1016/S0921-4488(97)00142-9
Cak, B., Yilmaz, O., Keskin, S., Bayril, T. and Tariq, M.M., 2017. Pakistan J. Zool., 49: 505-509. https://doi.org/10.17582/journal.pjz/2017.49.2.543.547
Eyduran, E., Kucuk, M., Karakus, K. and Ozdemir, T., 2008. J. Anim. Vet. Adv., 7: 799-804.
Grzesiak, W. and Zaborski, D., 2012. Examples of the use of data mining methods in animal breeding. In: Data mining applications in engineering and medicine (ed. A. Karahoca). InTech, Rijeka, ISBN 978-953-51-0720-0. https://doi.org/10.5772/50893
Kor, A., Baspinar, E., Karaca, S. and Keskin, S., 2006. Czech J. Anim. Sci., 51: 110-116.
Kornacki, J. and Ćwik, J., 2005. Statistical learning systems (in Polish). WNT, Warsaw.
Kucuk, M., Eyduran, E., Bolacali, M. and Ozdemir, T., 2009. Indian Vet. J., 86: 46-49.
Nouman, S. and Abrar, Y., 2013. Int. J. Livest. Prod., 4: 78-81. https://doi.org/10.5897/IJLP12.030
Ozdemir, H. and Dellal, G., 2009. Tarim Bilimleri Dergisi, 15: 358-362. https://doi.org/10.1501/Tarimbil_0000001111
Waheed, A., Khan, M.S., Ali, S. and Sarwar, M., 2011. . Arch. Tierz, 54: 287-296.
To share on other social networks, click on any share button. What are these?


