Cloning and Tissue Expression of the TTR Gene During the Initiation of Puberty in Dolang Sheep
Cloning and Tissue Expression of the TTR Gene During the Initiation of Puberty in Dolang Sheep
Zhishuai Zhang, Zhiyuan Sui, Jihu Zhang, Qingjin Li, Yongjie Zhang, Chenguang Wang, Xiaojun Li and Feng Xing*
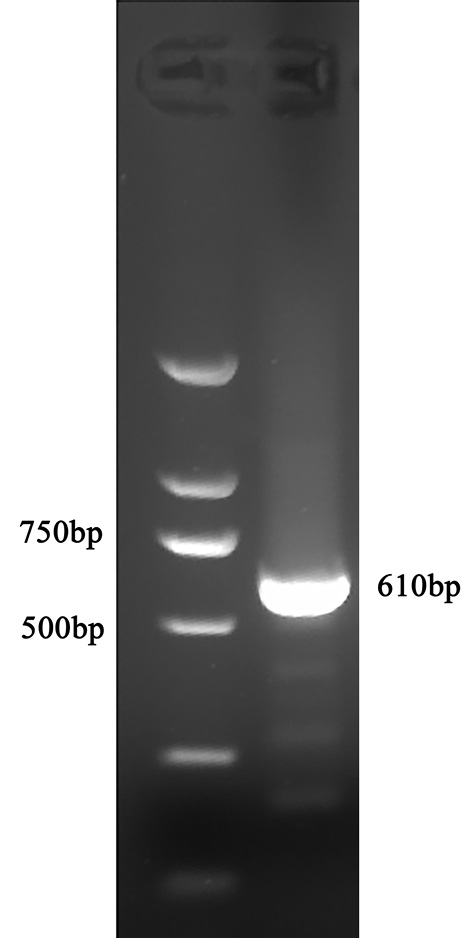
PCR product of TTR gene.
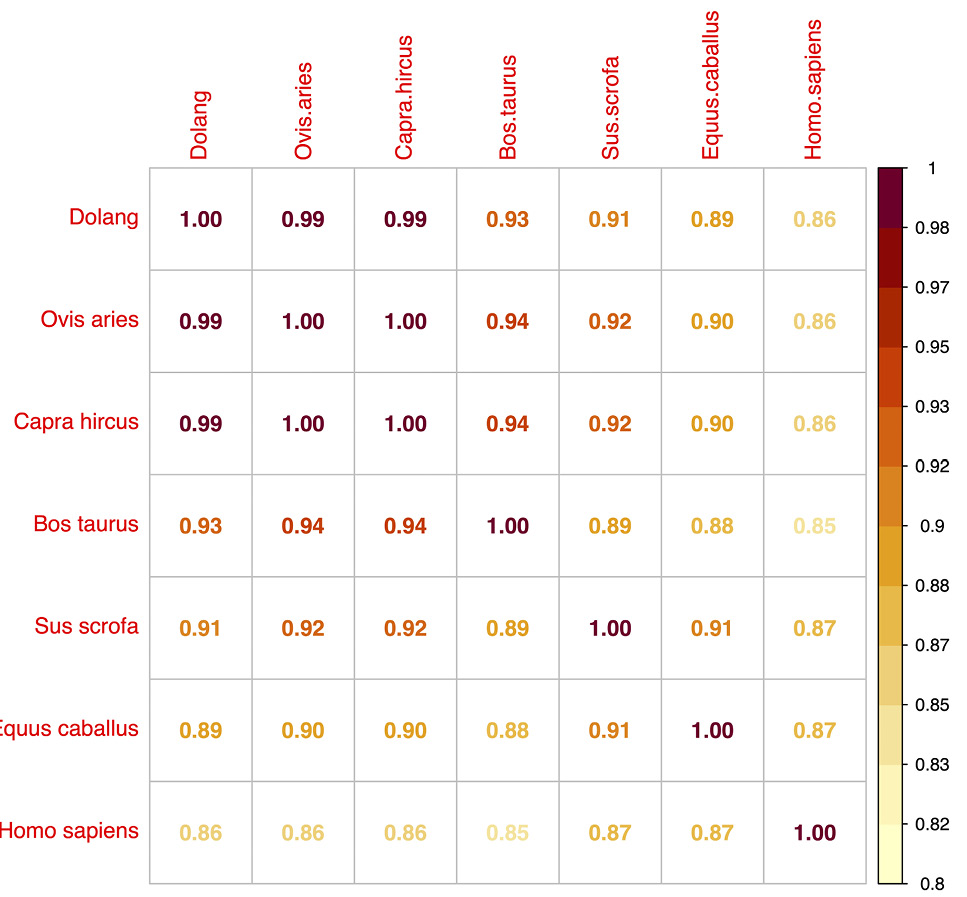
Amino acid similarity alignment of TTR protein in Dolang sheep
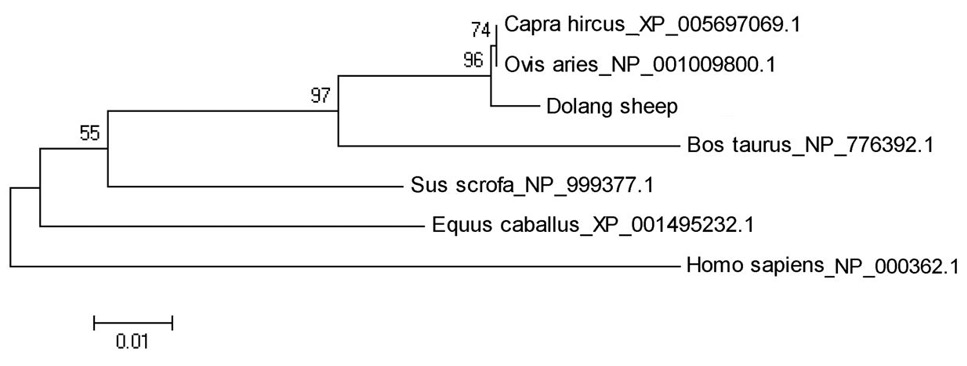
Phylogenetic tree of TTR gene.
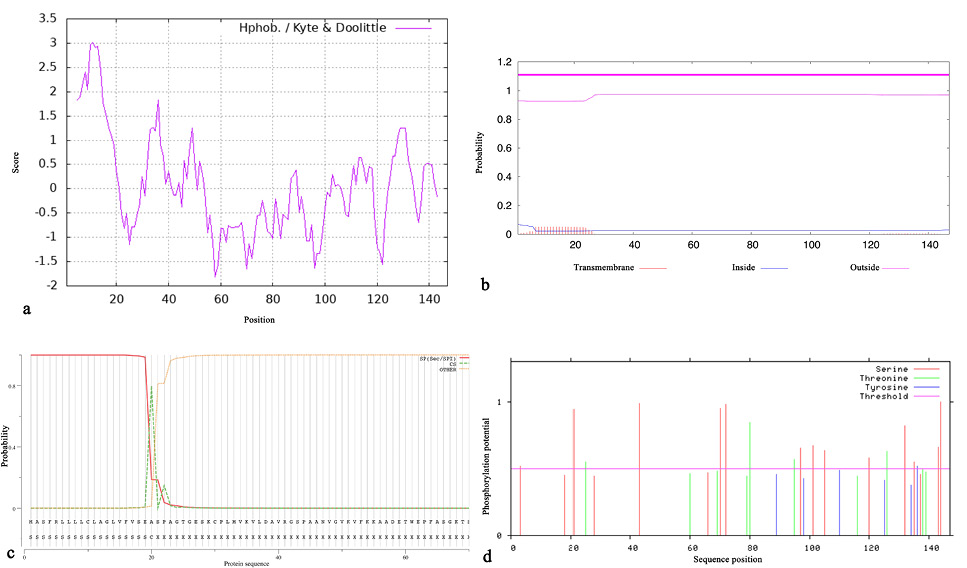
a: Hydrophobicity analysis of TTR protein in Dolang sheep. b: Prediction of TTR protein transmembrane domain in Dolang sheep. c: Prediction of signal peptide of TTR protein in Dolang sheep. d: Prediction of TTR protein phosphorylation sites in Dolang sheep.
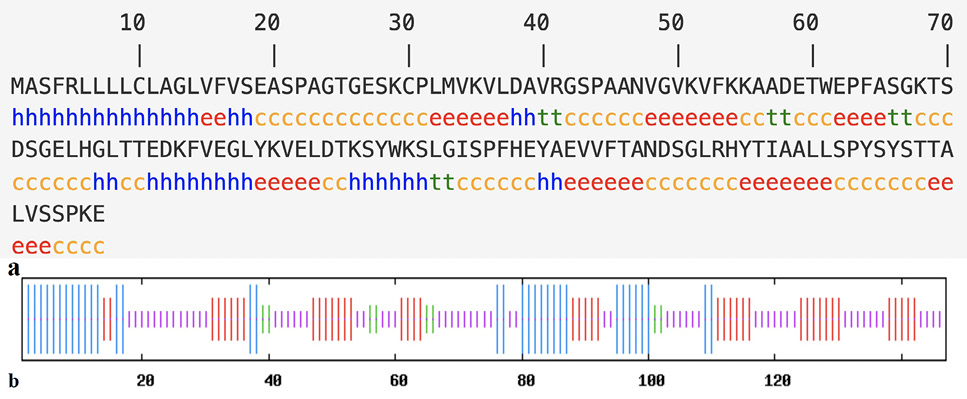
a: h, Alpha helix; t, Beta turn; c, Random coil; e, Extended strand. b: The lines represent alpha helix, extended strand, beta turn and random coil by the length.
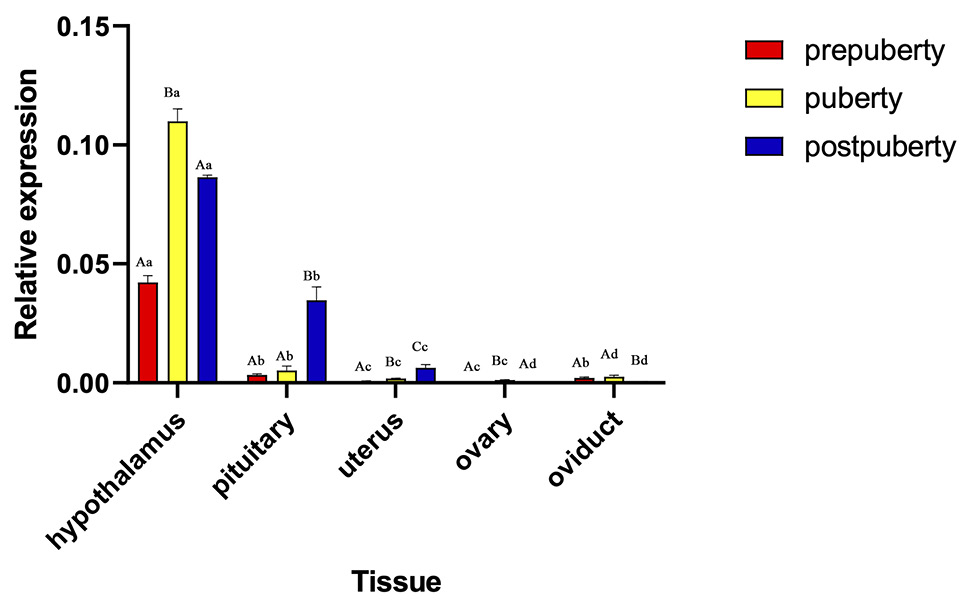
The relative expression levels of TTR gene in different tissues at different puberty stages of Dolang sheep. (1): Values of the same tissues, different periods with different capital letter superscripts indicate significant differences (P < 0.05), whereas with the same capital letter or no letter superscripts, there was no significant difference (P > 0.05). (2): Values of the same period, different tissues with different small letter superscripts indicate significant difference (P < 0.05 ), while with the same small letter superscripts, there was no significant difference (P > 0.05 ).
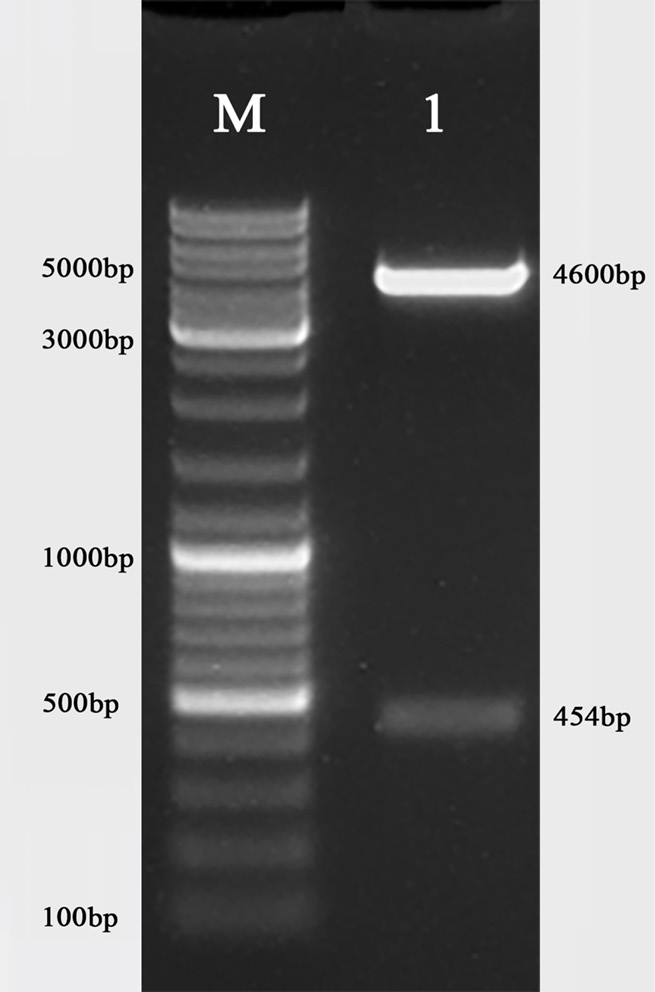
Identification of recombinant plasmid pEGFP-N1-TTR by double digestion. M:DM10000 DNA maker; 1: Target band.
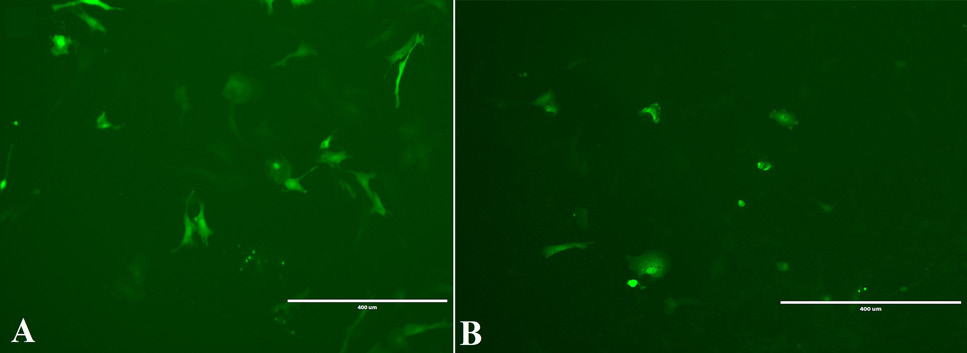
a: Fluorescence detection graph of control group 24 h after transfection. b: Fluorescence detection graph of 24 test groups after transfection.
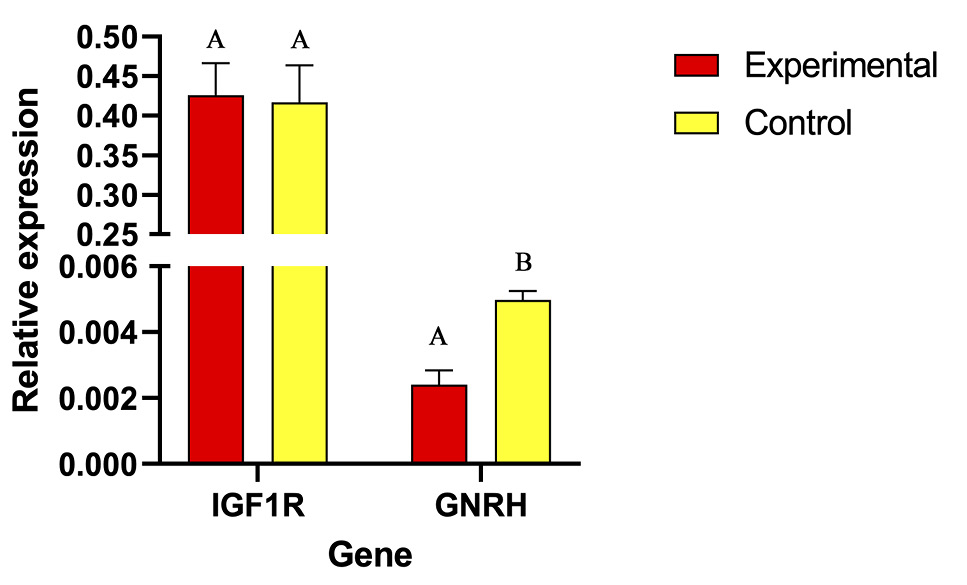
Effect of TTR gene overexpression on the expression of IGF1R and GnRH genes. Different capital letters indicate significant differences in the experimental and control groups.
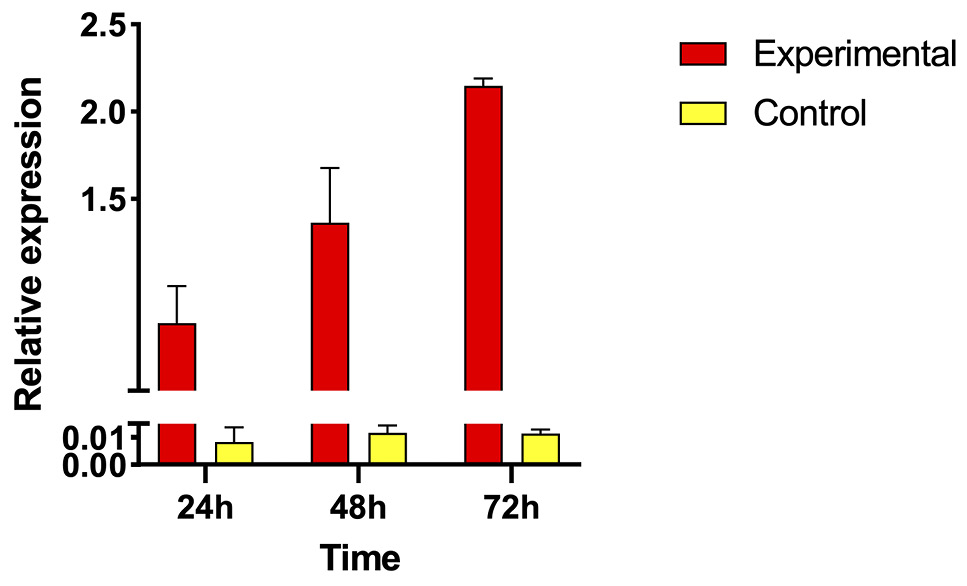
Changes in TTR gene expression at 24 h, 48 h, and 72 h after transfection.


