Cloning, Sequence Analysis, and Tissue Expression of the KITL Gene in Goat (Capra hircus)
Cloning, Sequence Analysis, and Tissue Expression of the KITL Gene in Goat (Capra hircus)
Jie Li, Gaofu Wang, Xiaoyan Sun, Lin Fu, Peng Zhou* and Hangxing Ren*
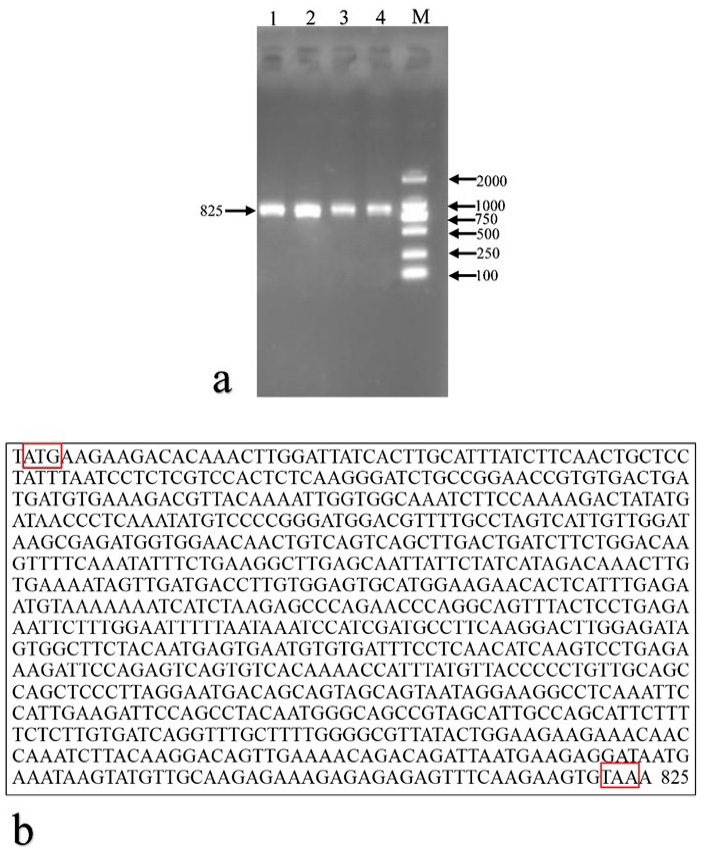
Amplification products and sequence of the Youzhou dark goat KITL gene. a, goat KITL gene products were detected by agarose gel electrophoresis. 1–4: PCR products. M: DL2000 marker. b, goat KITL gene sequencing results. The start and stop codons were indicated in red boxes.
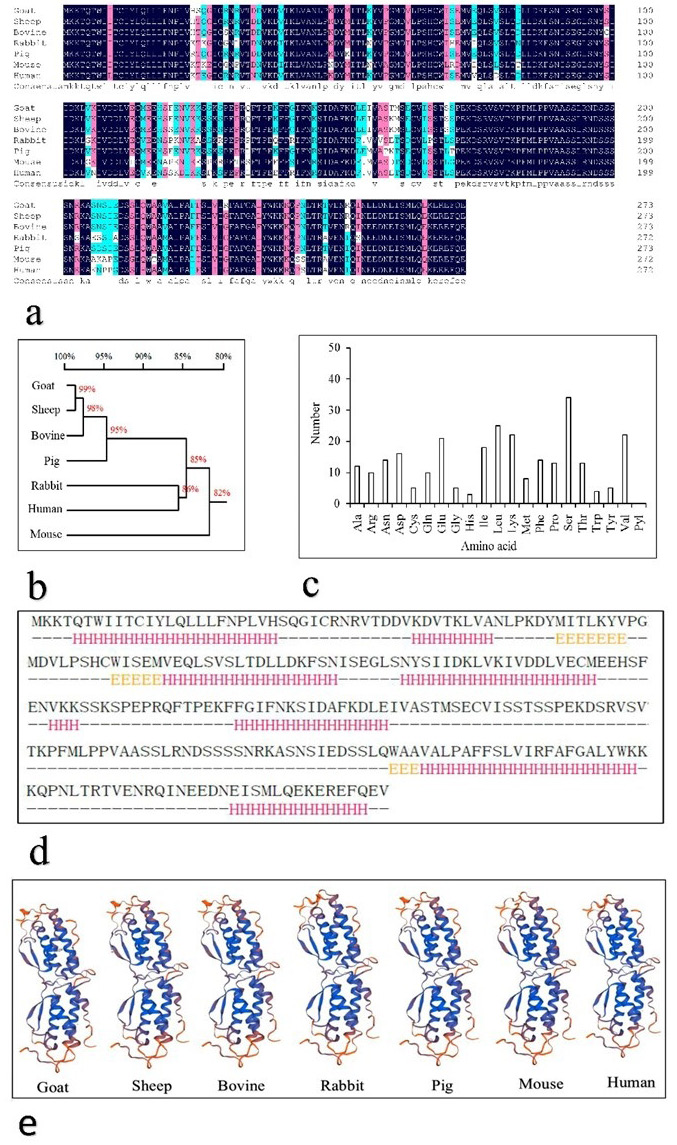
Amino acid sequence analysis of the Youzhou dark goat KITL gene. a, homology of goat, sheep, bovine, rabbit, pig, mouse, and human KITL amino acid sequence. Sequence was aligned in DNAMAN. Amino acid sequence homology is shown by black shading (100%), pink shading (≥75%), and blue shading (≥50%). b, phylogenetic tree of KITL amino acid sequences. c, amino acid composition of goat KITL as determined in EXpASy. d, secondary structure prediction analysis of KITL conducted by Jpred. -: Random coil predicted by Jpred; H (red): α-helix; E (yellow): β-sheet. e, tertiary structure of the KITL protein in goat, sheep, bovine, rabbit, pig, mouse, and human.
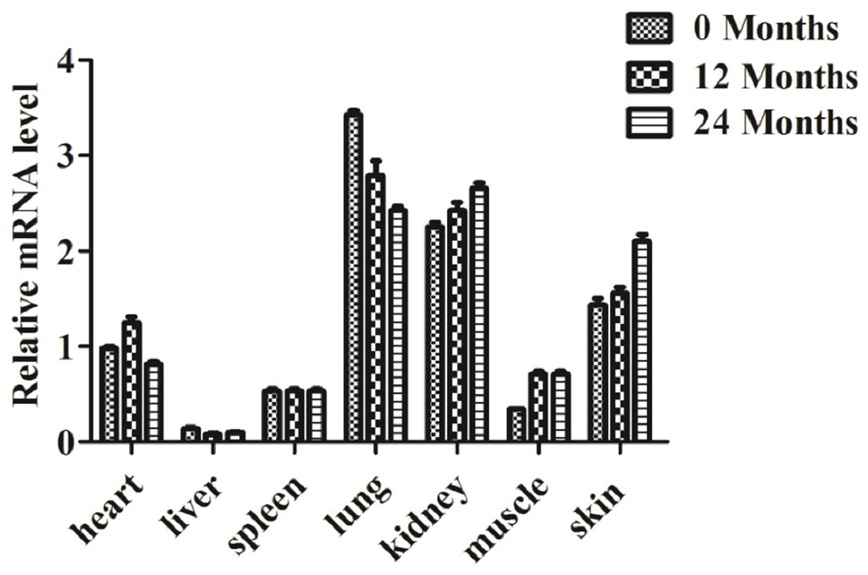
Relative mRNA expression profile of the KITL gene in different tissues of Youzhou dark goat. Quantitative data were represented as mean ± SD (n = 3).
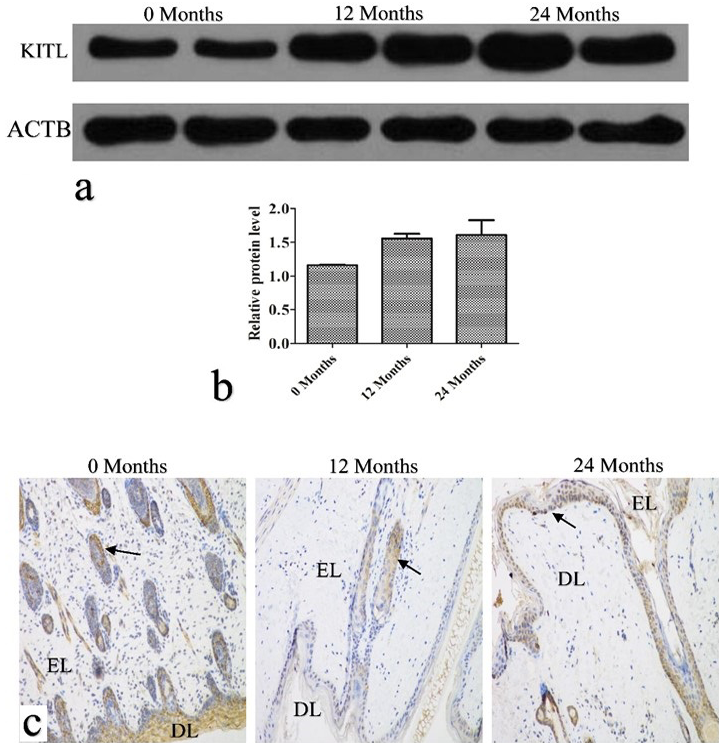
KITL protein expression and localization. a, the KITL protein was detected by western blotting. ATCB was used as a loading control. b, relative protein band intensity was determined and quantified by Image J. Data are presented as mean ± SD (n=3). c, immunohistochemical analysis of the KITL protein. EL, epidermal layers; DL, dermal layers. Bar = 50 μm.


