

Cloning, Expression and Molecular Characterization of Glutathione Transferase P1-1 Gene from the Camel, Camelus dromedarius


Cloning, Expression and Molecular Characterization of Glutathione Transferase P1-1 Gene from the Camel, Camelus dromedarius
Farid S. Ataya,1,2,* Dalia Fouad,3,4 Ajamaluddin Malik,1 Nikolaos E. Labrou,5 Mohamed S. Daoud1,6 and Hesham M. Saeed7

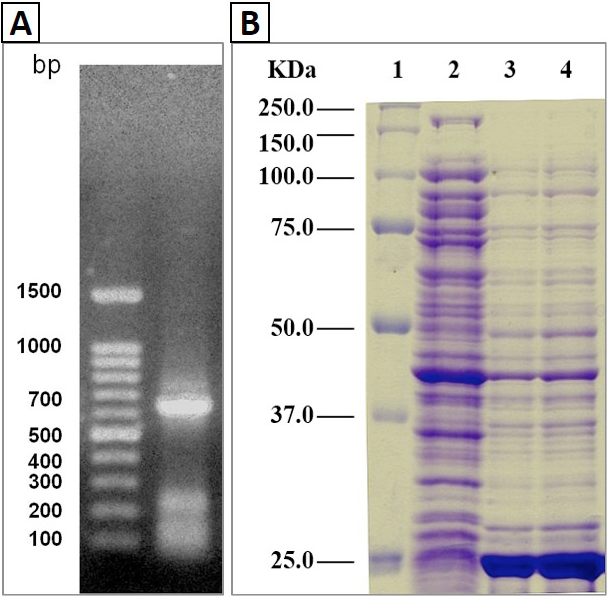
A, Agarose gel (1.2% w/v) electrophoresis for RT–PCR products of CdGSTP1-1 using the specified primers and camel liver cDNA. Left, DNA ladder; Right, RT–PCR products; B, SDS-PAGE analysis of purified CdGSTP1-1 enzyme. Lane 1, molecular weight markers; Lane 2, crude extract of E. coli BL21(DE3) uninduced; Lane 3 and 4, crude extract of E. coli BL21(DE3) induced with 1 mM IPTG after 2 and 4 h.

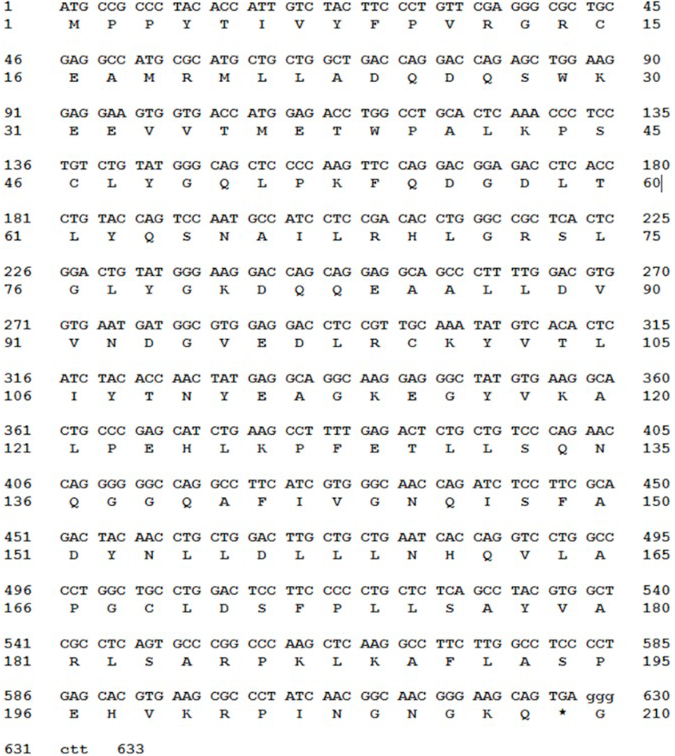
The nucleotide and deduced amino acid sequences of the cloned CdGSTP1-1 (GenBank accession number HM132060 and ADJ57597, respectively.

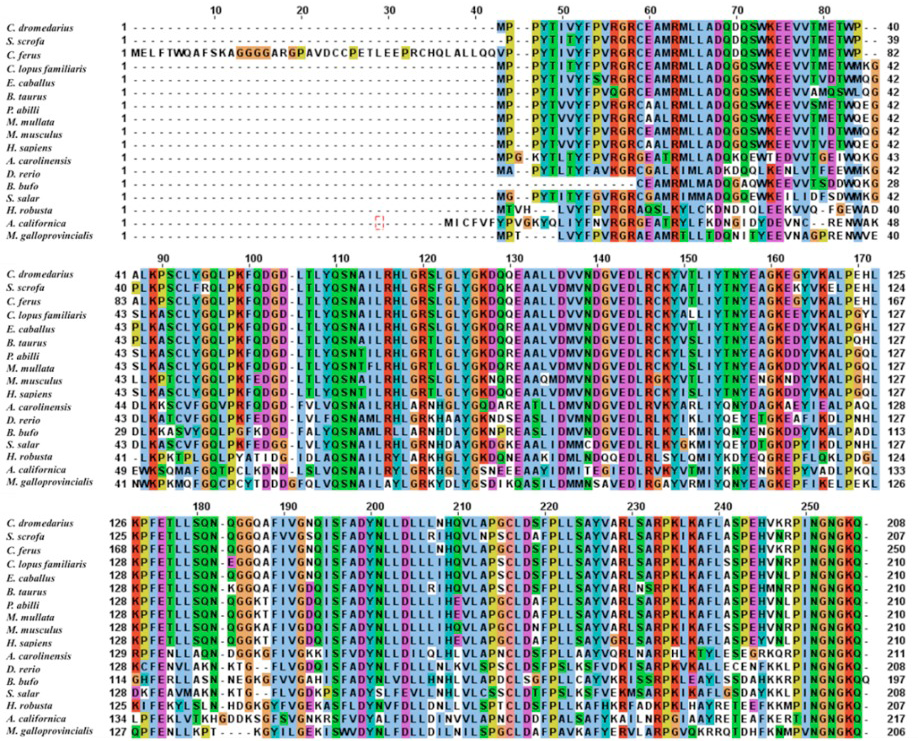
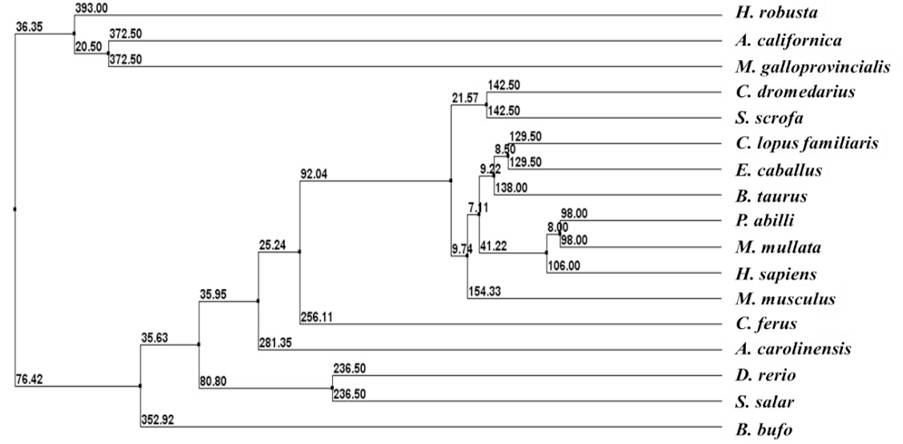
Amino acid sequence alignment of CdGSTP1-1 with homologues enzymes. The alignment was generated with the JalView program. The sequences that were used and their accession numbers are: Sus scrofa, 2GSR_A; Camelus ferus, EPY87515.1; Canis lupus familiaris, NP_001239096; Equus caballus, XP_001498156; Bos taurus, NP_803482.1; Pongo abilli, NP_001127471.1; Macaca mullata, NP_001036141.1; Mus musculus, NP_038569.1; Homo sapiens, NP_000843.1; Anolis carolinensis, XP_003215129.1; Cyprinus carpio, ABD67510.1; Danio rerio, NP_571809.1; Bufo bufo, AAN04480.1; Salmo salar, ACI70112.1; Helobdella robusta, ESO09543.1; Aplysia californica, XP_005099401.1; Mytilus galloprovincialis, AAM91994.1.

The phylogenetic tree of CdGSTP1-1 with homologues enzymes shown in Figure 3.

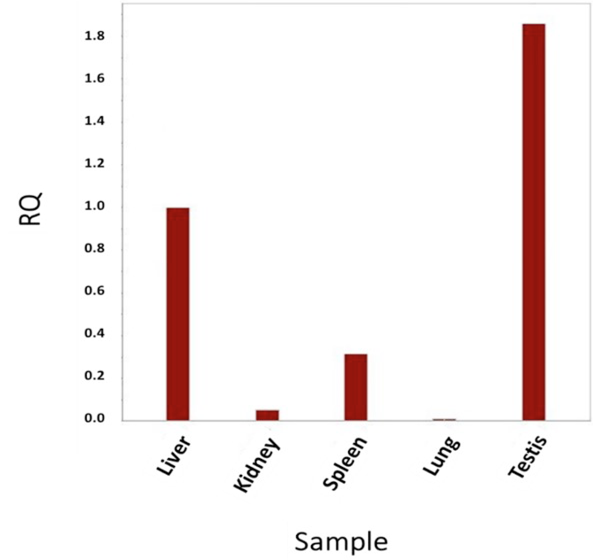
Relative mRNA expression levels of CdGSTP1-1 transcript in different camel tissues using the 18S ribosomal subunit as the housekeeping gene.

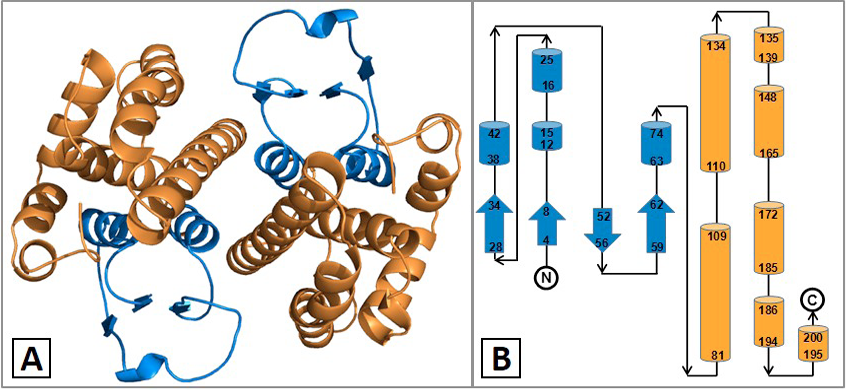
Homology model of CdGSTP1-1. A, N-terminal domain (blue) and the C-terminal domain (orange); B, topology diagram for CdGSTP1-1. The N-terminal domain is colored blue and the c-terminal colored orange.
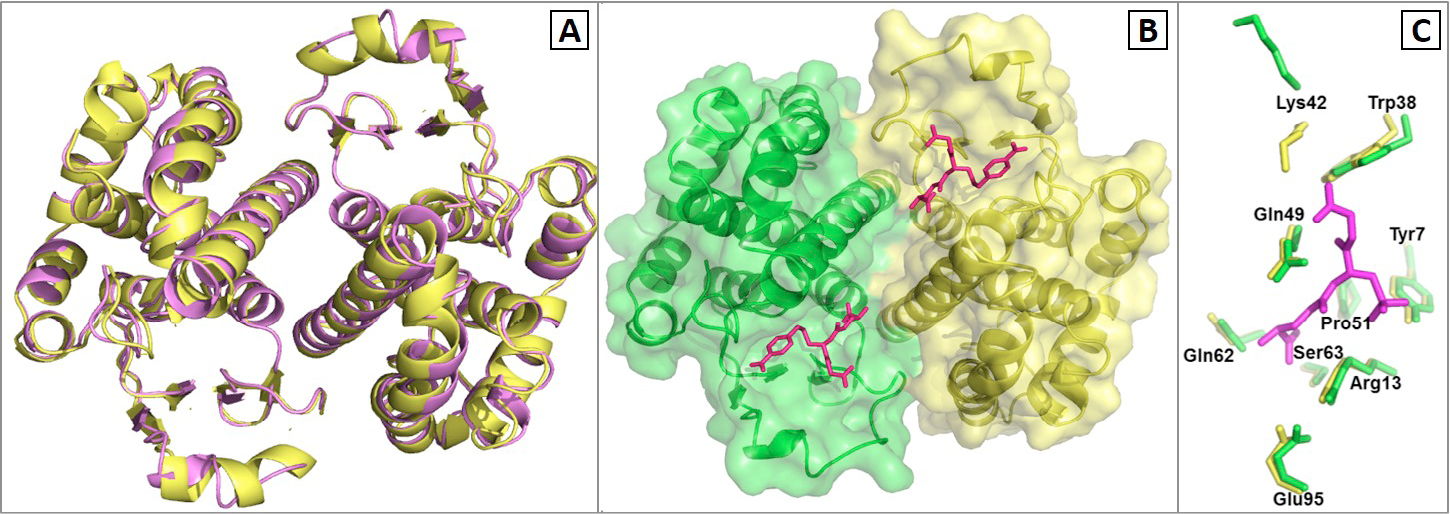
A, Superimposed modeled CdGSTP1-1 (violet) on template porcine GSTpi (yellow). The modeled CdGSTP1-1 indicated very high similarity in folding pattern with porcine GSTpi; B, surface view of the G- and H-site of CdGSTP1-1. The two subunits are shown in green and yellow. The bound inhibitor, glutathione sulfonate, is shown with magenta color; C, Comparison of the G-site binding residues and other important residues in camel (green) and porcine GSTpi (yellow).


