
Climate Change Impact Assessment on Net Revenue of Rice Crop in Khyber Pakhtunkhwa: A Cross-Sectional Ricardian Rent Analysis


Climate Change Impact Assessment on Net Revenue of Rice Crop in Khyber Pakhtunkhwa: A Cross-Sectional Ricardian Rent Analysis
Md. Asadujjaman1, Md. Yeamin Hossain2*, Most. Farida Parvin3, Most. Shakila Sarmin2, Fairuz Nawer2, Wasim Sabbir4, Md. Ashekur Rahman2, Nur-E-Farjana Ilah2, Md. Joynal Abedin5, Md. Abdus Samad6 and Gitartha Kaushik7

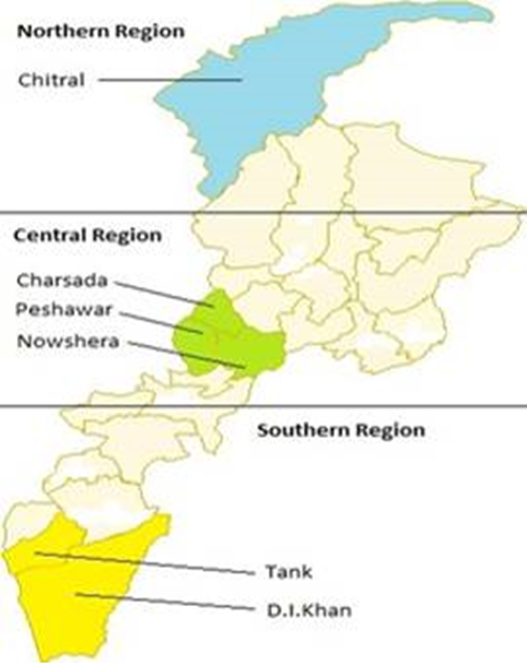
Figure 1:
Climatic Zones of Khyber Pakhtunkhwa.
Sources: Reproduced from (Samreen and Amin, 2012).

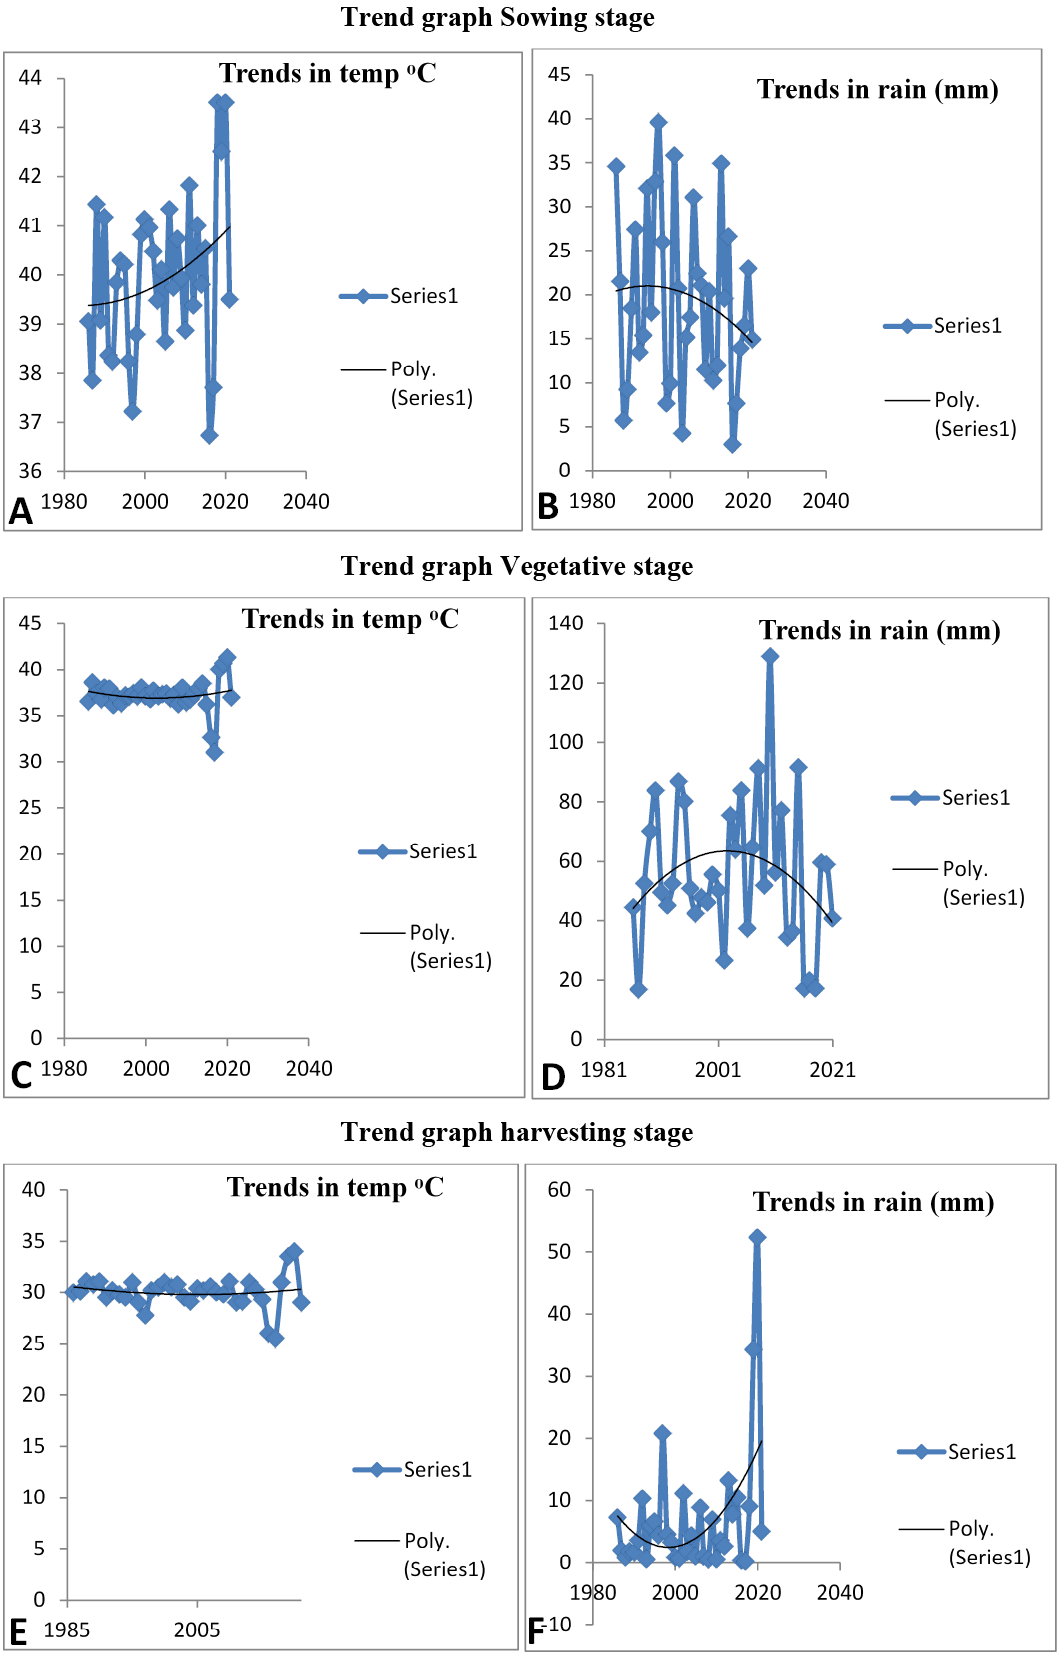
Figure 2:
Trend graph in Southern zone at sowing stage (A, B), vegetative stage (C, D), harvesting stage (E, F).
Source: Government of Khyber Pakhtunkhwa, various relevant Directorates and Department.

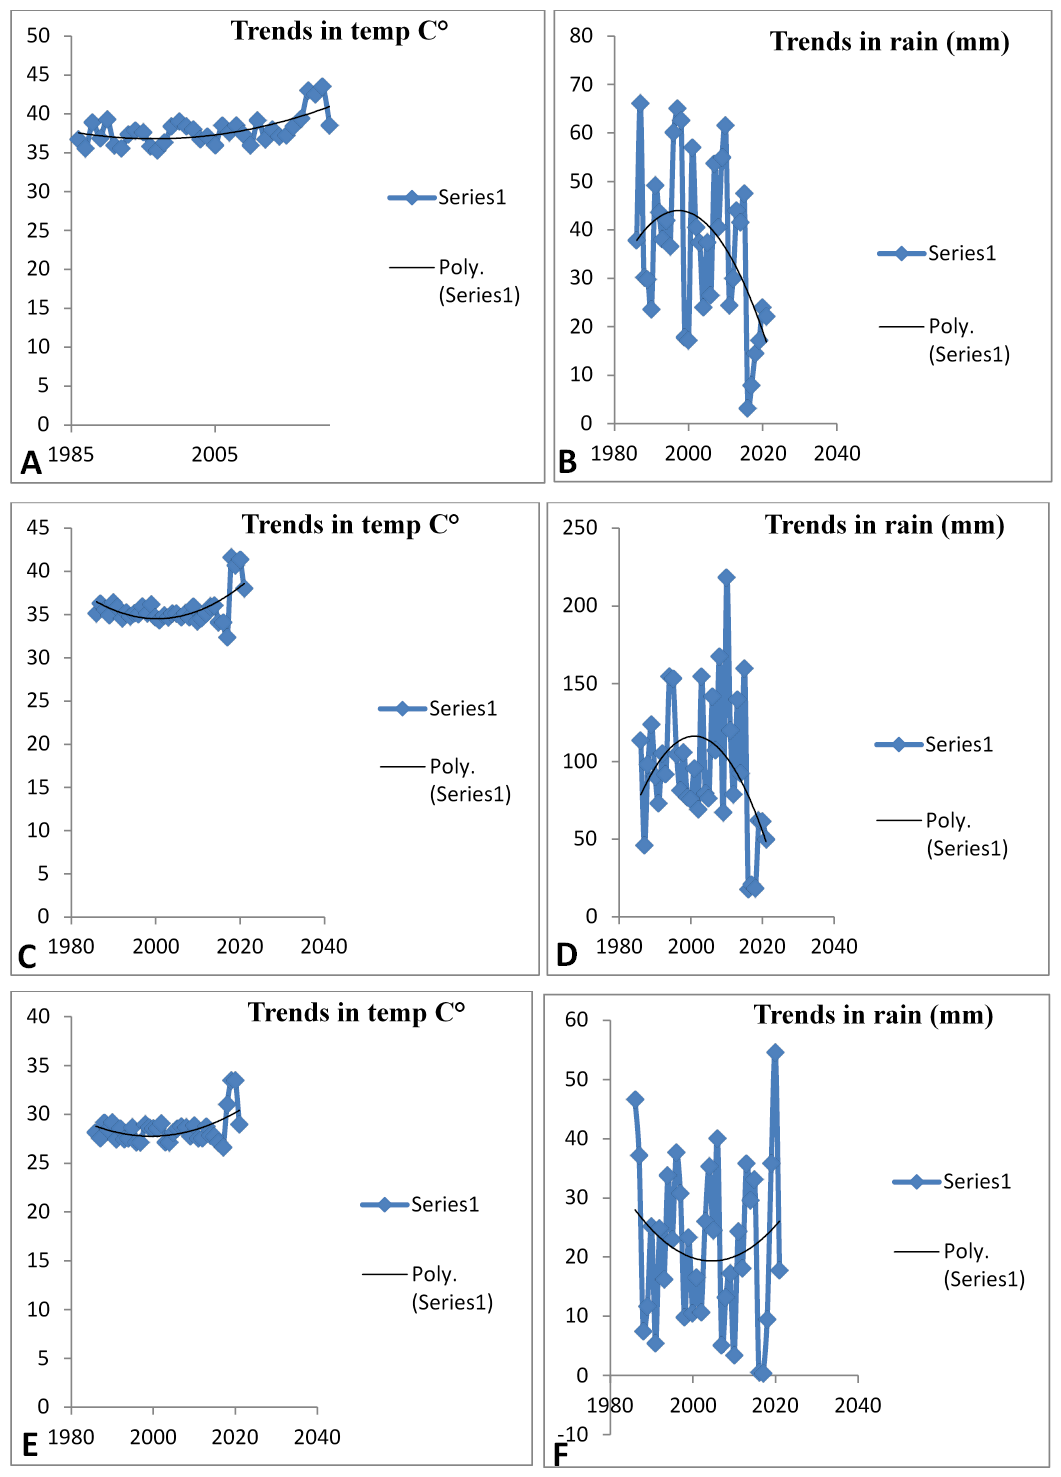
Figure 3:
Trend graph in central zone at sowing stage (A, B), vegetative stage (C, D), harvesting stage (E, F).
Source: Government of Khyber Pakhtunkhwa year wise data.

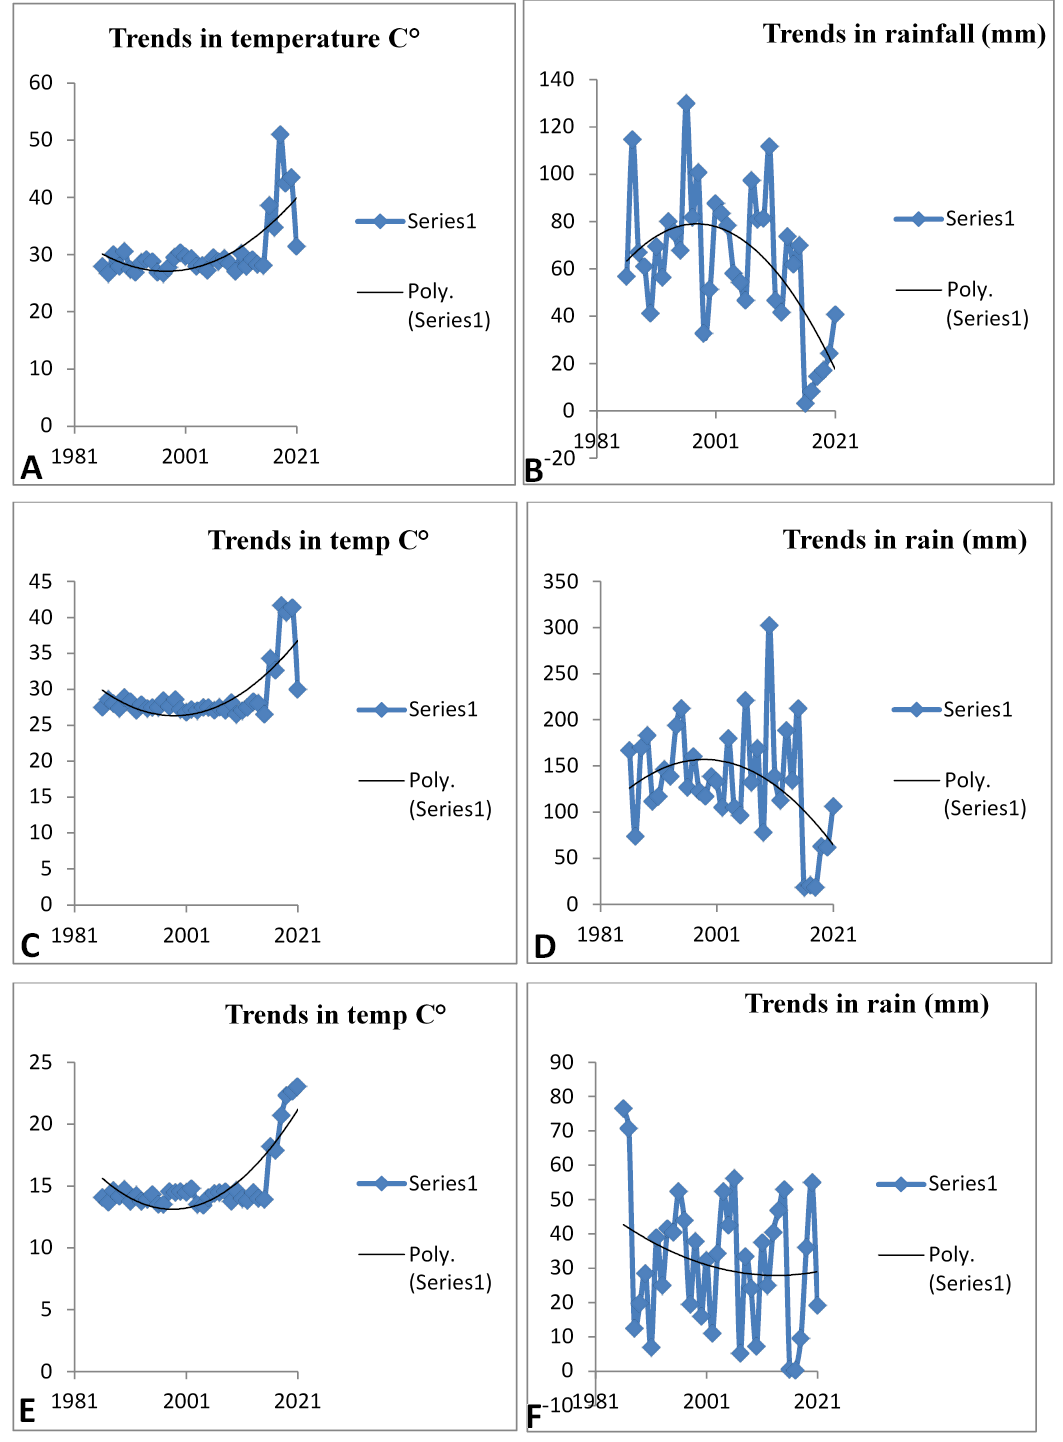
Figure 4:
Trend graph in northern zone at sowing stage (A, B), vegetative stage (C, D), harvesting stage (E, F).
Source: Government of Khyber Pakhtunkhwa, year wise metrological data.
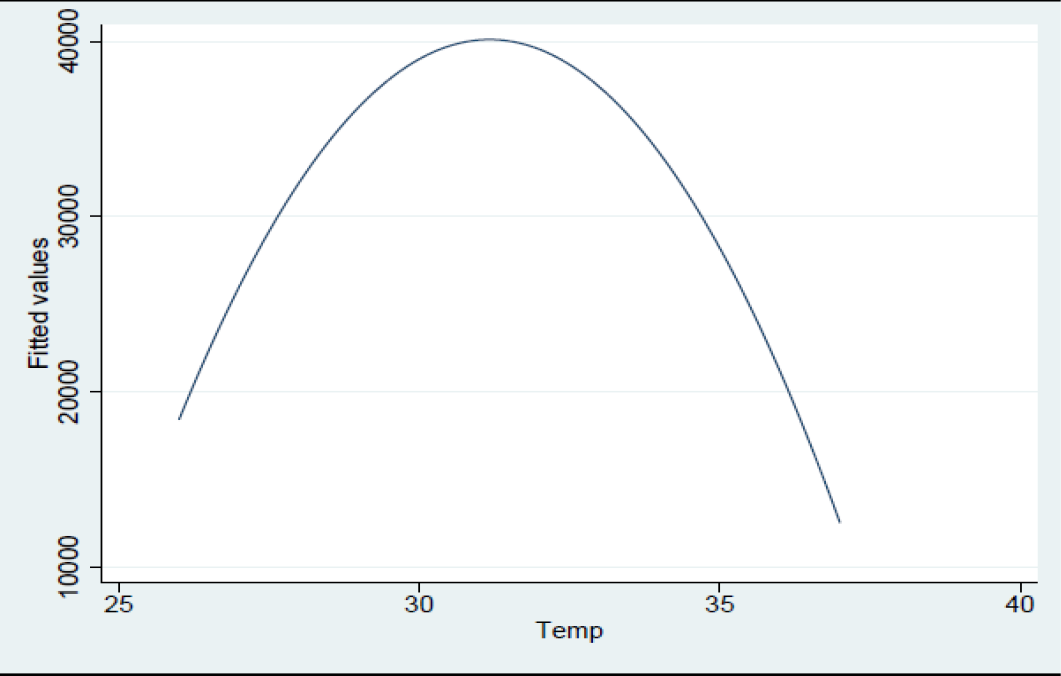
Figure 5:
Rice growers net return response curve to temperature.
Source: Authors’ estimates from data, 2021 and estimated model.
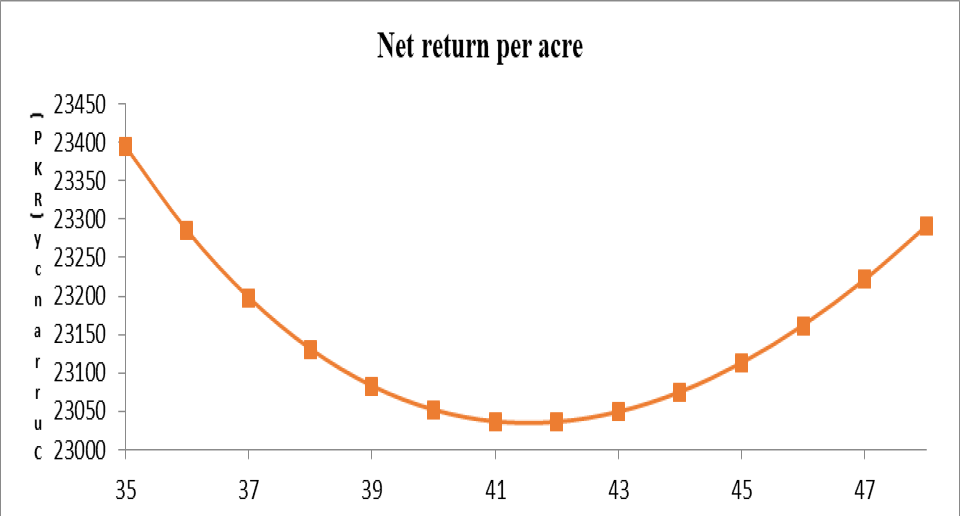
Figure 6:
Rice growers net return response curve to rainfall.
Source: Authors’ estimates from data, 2021 and estimated model.
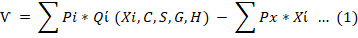
Equation 1

June 2024
Sarhad Journal of Agriculture, Vol.40, Iss. 2, Pages 263-679


