

Characterization of Recombinant Thermostable Phytase from Thermotoga naphthophila: A Step for the Fulfilment of Domestic Requirement of Phytase in Pakistan


Characterization of Recombinant Thermostable Phytase from Thermotoga naphthophila: A Step for the Fulfilment of Domestic Requirement of Phytase in Pakistan
Furqan Sabir1, Muhammad Tayyab1,*, Bushra Muneer2, Abu Saeed Hashmi1, Ali Raza Awan1, Naeem Rashid3, Muhammad Wasim1 and Sehrish Firyal1
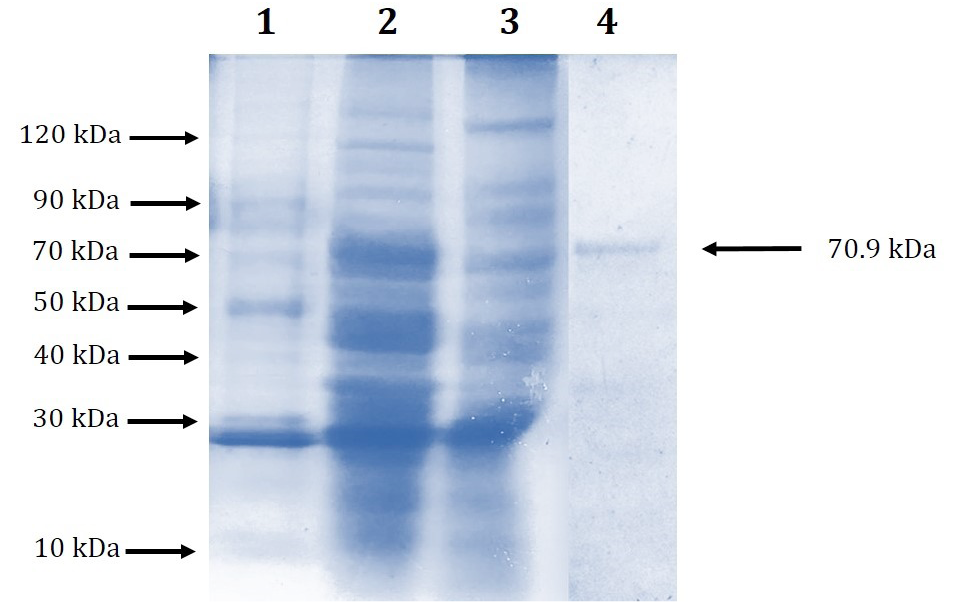
Fig 1
Comassie brilliant blue stained acrylamide gel showing purification of phytase. Lane 1, molecular weight protein ladder (NOVEX, Life Technolgies); Lane 2, soluble portion after lysis of cells having PHY-pET; Lane 3, negative control (soluble portion after lysis of cells containing pET21a without insert); Lane 4, purified PHYTN.

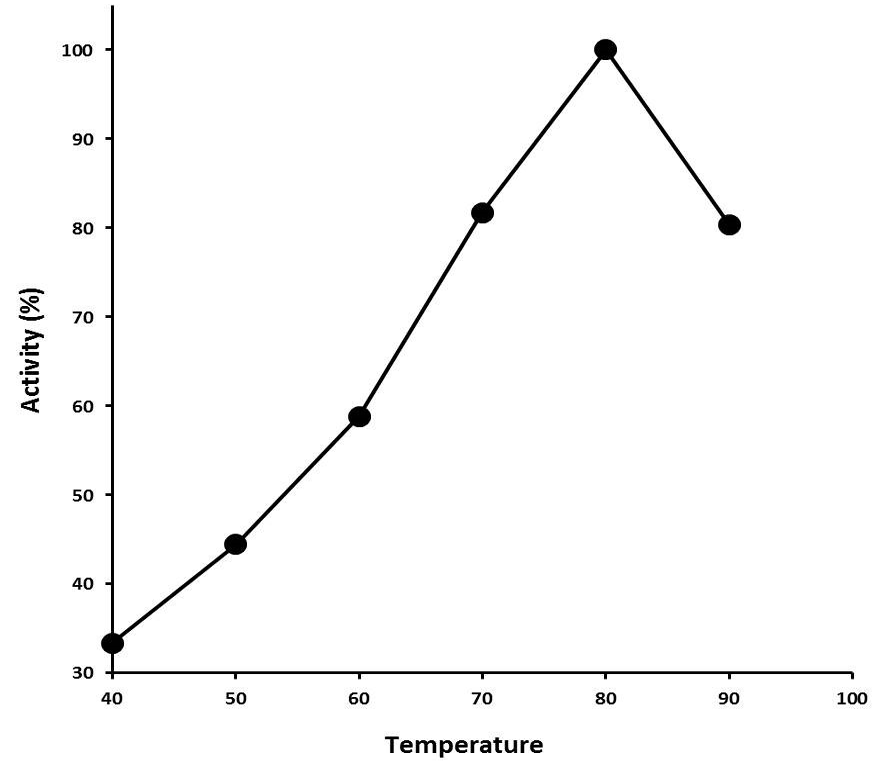
Fig 2
Effect of temperature on PHYTN activity. Activity assay was performed at various temperature ranging 40 to 80 °C using 50 mM acetate buffer (pH 6) using 5 mM sodium phytate as substrate. X axis shows the temperature while Y axis shows the activity (%).

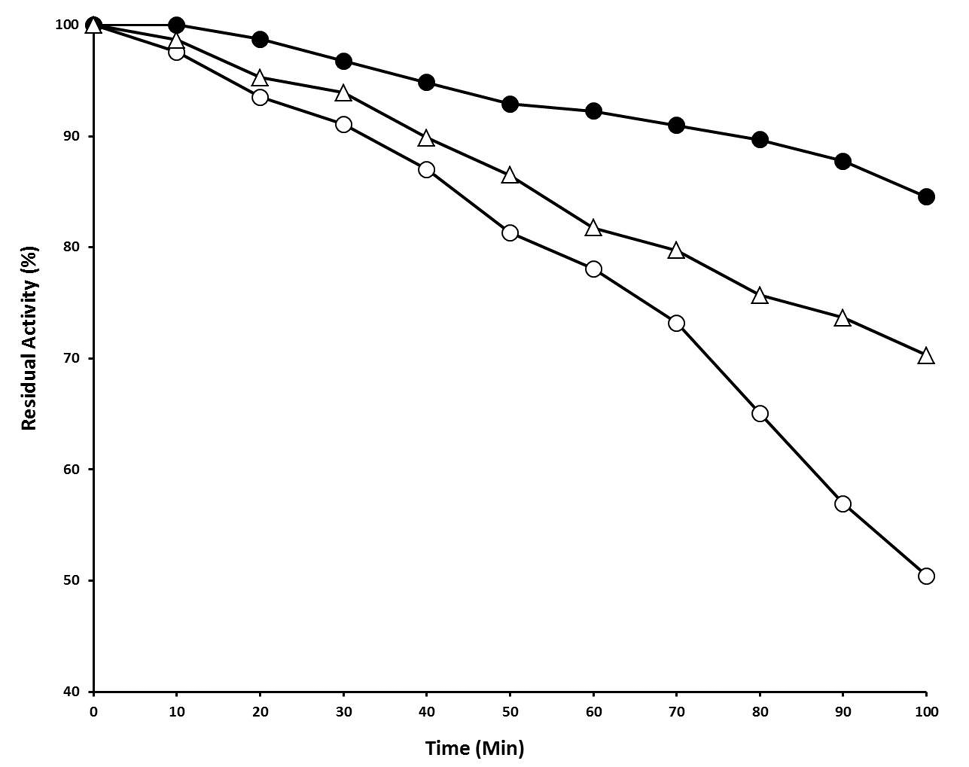
Fig 3
Thermostability studies of phytase. The protein was incubated at 80 °C in the absence or presence of metal ions (Cu2+ or Fe3+) separately in 50 mM acetate buffer at pH 6. Unfilled circles shows the stability in the absence of any metal ion, while filled circles and unfilled triangles shows the stability in the presence of Fe3+ and Cu2+, respectively.
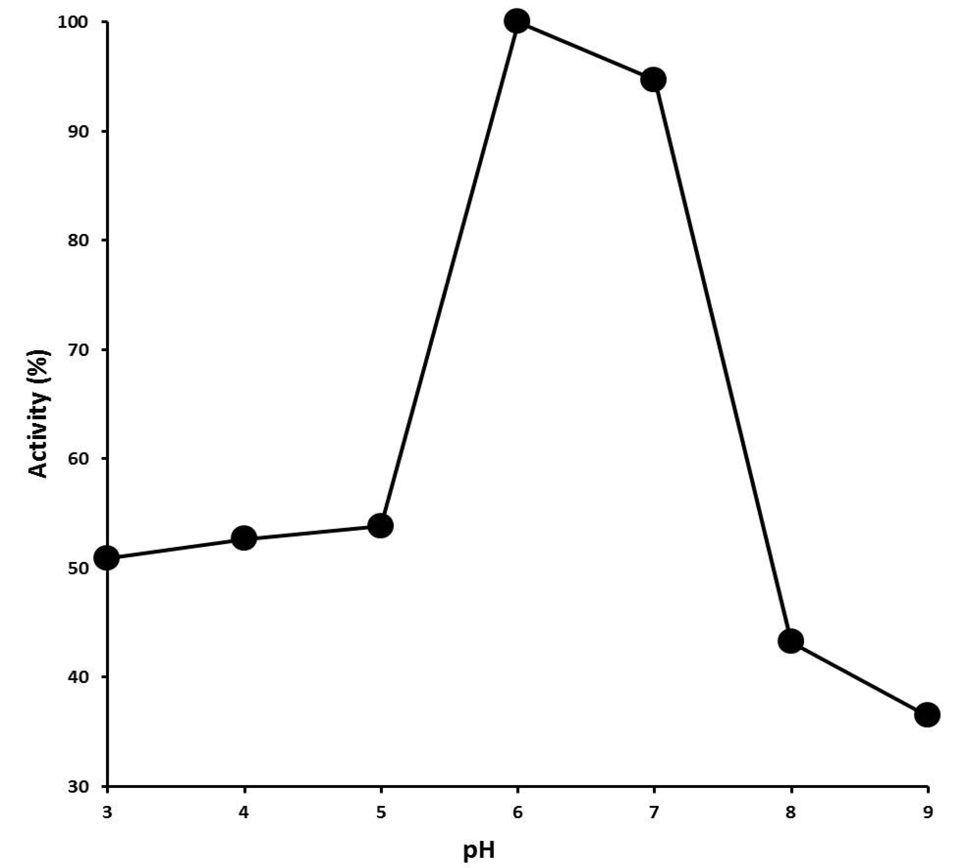
Fig 4
Effect of pH on PHYTN activity. Activity assay was performed as various pH using 50 mM of each, Glycine-HCl buffer (3-5), acetate buffer (5-6) and Tris-HCl Buffer (6-9) at 80°C using 5 mM substrate. X axis in figure shows pH whereas Y axis shows PHYTN activity (%).

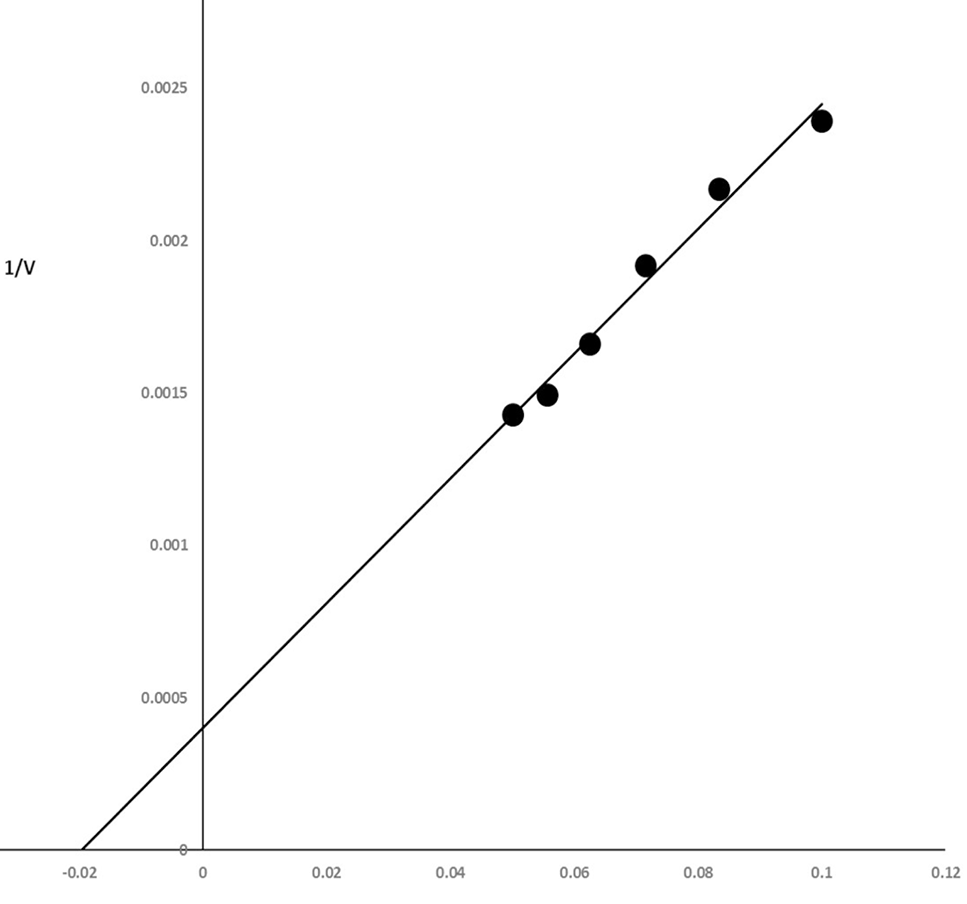
Fig 5
Lineweaver-Burk plot. X axis shows the values for 1/substrate while Y axis shows the values for 1/V0. The plot was utilized to calculate the kinetic parameters.

December 2017
Vol. 49, Iss. 6, Pages 1937-2341


