

Characterization of the Complete Mitochondrial Genome of Sea Duck Mergus serrator and Comparison with other Anseriformes Species


Characterization of the Complete Mitochondrial Genome of Sea Duck Mergus serrator and Comparison with other Anseriformes Species
Peng Chen1, Jiaqi Li1, Hongbo Li2, Qin Lu3, Wei Liu1,4,5* and Jianliang Zhang1*
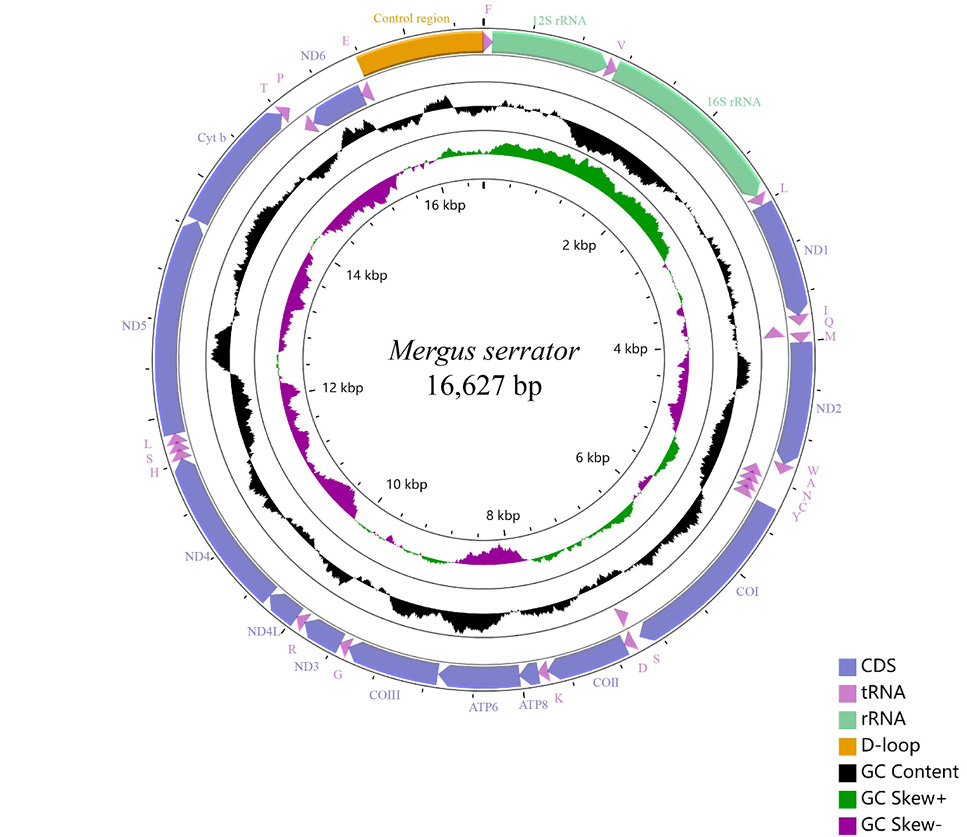
Mitochondrial genomes of M. serrator. Arrows indicate the orientation of gene transcription. PCGs are shown as blue arrows, rRNA as light green arrows, control region as orange arrows, and tRNA genes as purple arrows. tRNA genes are designated by single-letter amino acid abbreviations. Labeling from the outside to the inside circle: genes encoded on the heavy strand, genes encoded on the light strand. The black circle demonstrates the GC content (the peaks outside/inside the circle indicate values higher or lower than average GC content). The purple-green circle demonstrates GC skew, purple (between 0 and 1), and green (between -1 and 0).
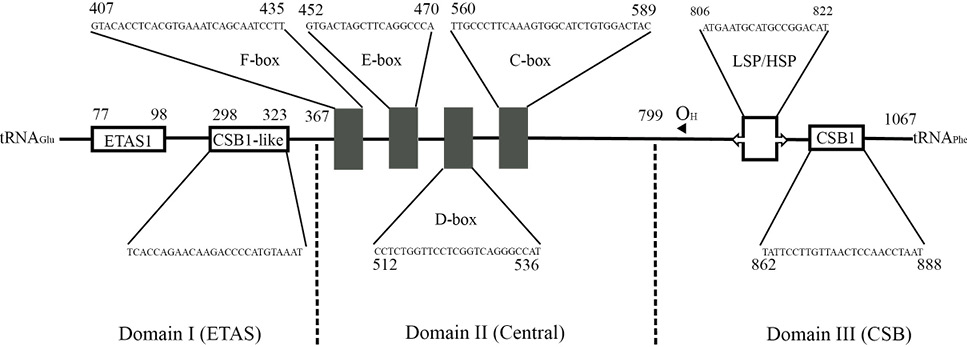
General structure of the mtDNA control region of M serrator.

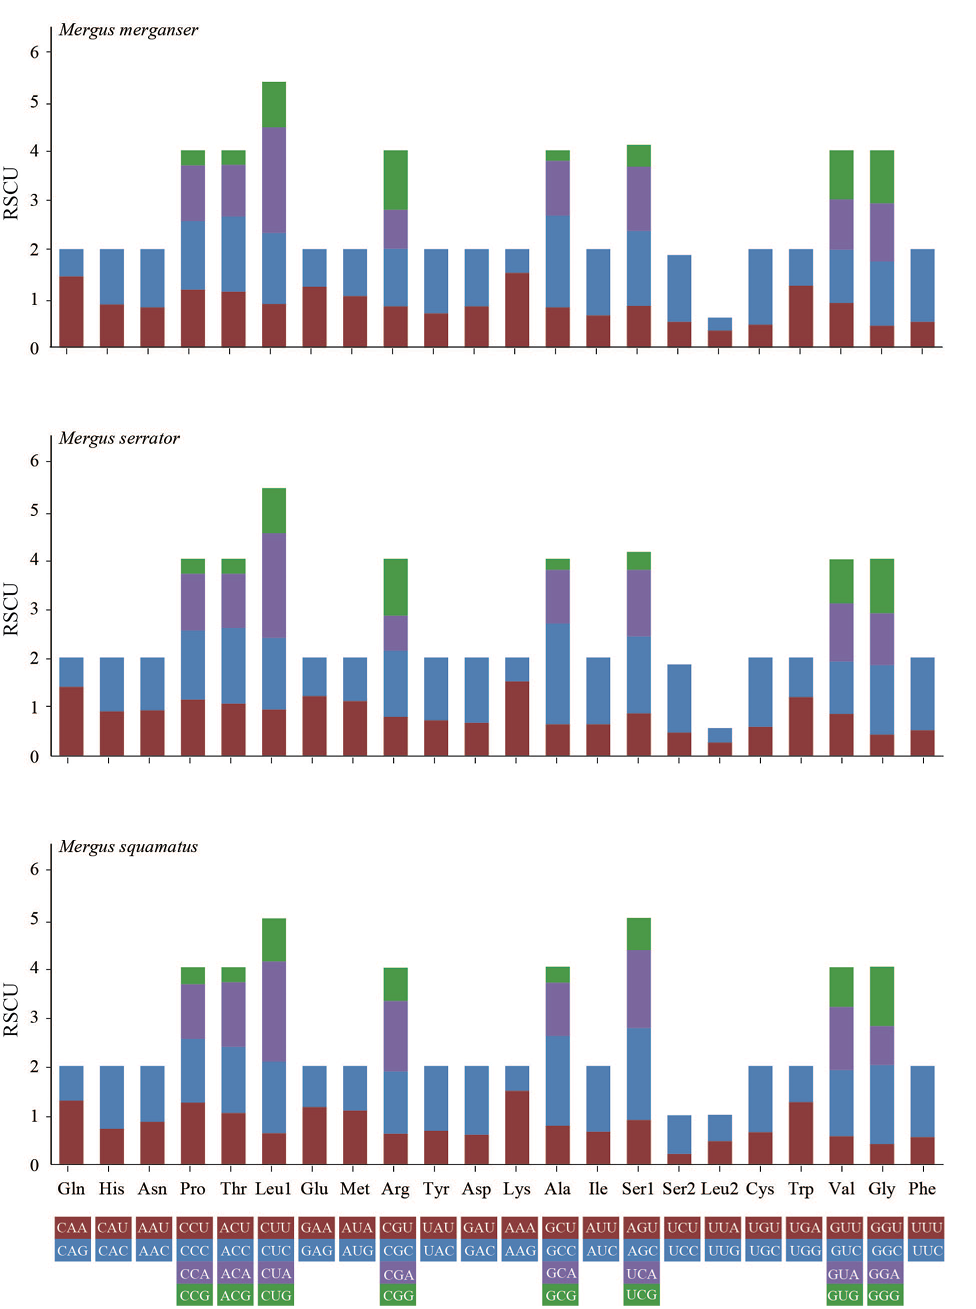
Codon number and relative synonymous codon usage (RSCU) of mitochondrial PCGs of three species of Mergus.

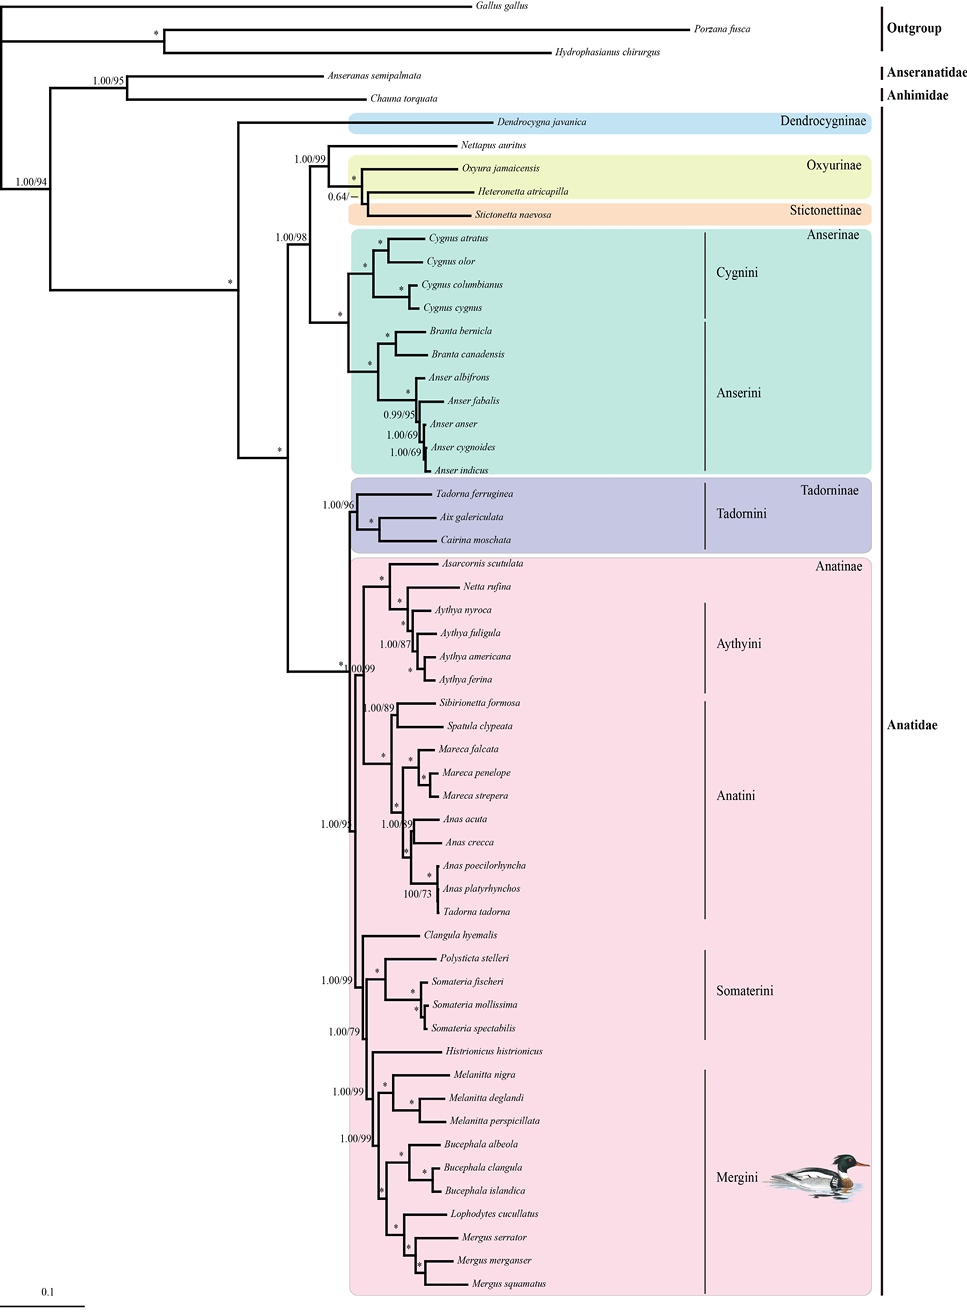
BI and ML trees constructed based on complete mtDNA sequences of Anseriformes. Numbers represent bootstrap values (MP/ML) and only those >60% are shown. Asterisks indicate posterior probabilities of 100%.
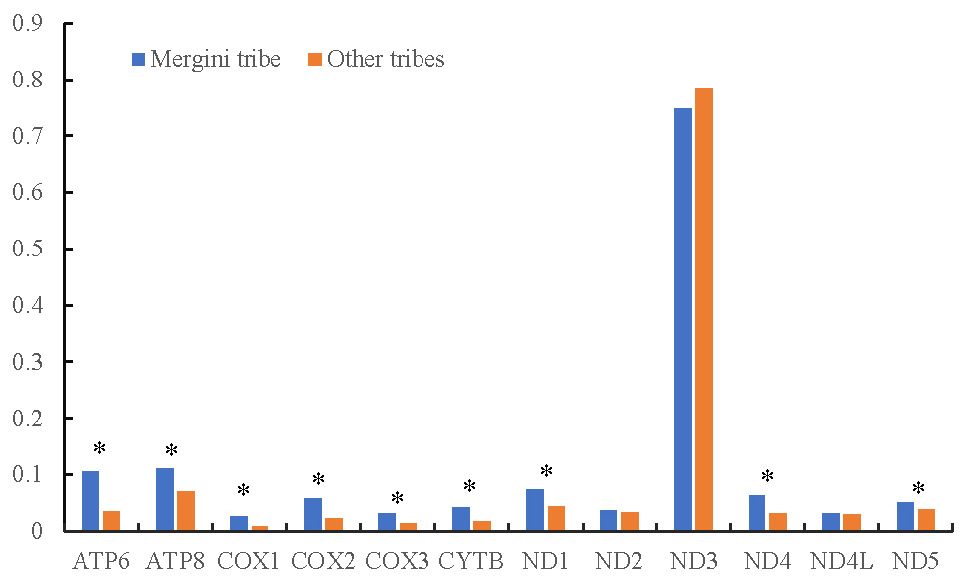
Natural selection strength and the ratio of non-synonymous to synonymous substitutions (ω) calculated using the two-ratio model for 12 purifying selective protein-coding genes between the Mergini tribe and other tribes. Genes in which the two-ratio model fits better to the data (LRT p<0.05) are marked with an asterisk.


