Changes in Subsoil Compaction and Salinity Caused by Tractor Wheels Passes During Tillage Practices Under Different Soil Types


Research Article
Changes in Subsoil Compaction and Salinity Caused by Tractor Wheels Passes During Tillage Practices Under Different Soil Types
Rahim Bux Vistro1*, Mashooque Ali Talpur1, Irfan Ahmed Sheikh1, Muneer Ahmed Mangrio2, Rajish Kumar Soothar1, Mian Noor Hussain Asghar Ali3,4, Imran Ali Dhamach4, Muhammd Urs Mirjat1 and Abdul Saboor Soomro2
1Department of Irrigation and Drainage, Faculty of Agricultural Engineering, Sindh Agriculture University, Tandojam, Sindh, Pakistan, 70060; 2Department of Land and Water Management, Faculty of Agricultural Engineering, Sindh Agriculture University, Tandojam, Sindh, Pakistan, 70060; 3Institute of Food Science and Technology, Chinese Academy of Agricultural Science (CAAS)/Key Laboratory of Agro-Products Processing, Ministry of Agriculture and Rural Affairs, Beijing, China, 100193; 4Department of Farm Structures, Faculty of Agricultural Engineering, Sindh Agriculture University, Tandojam, Sindh, Pakistan, 70060; 5Soil Salinity and Reclamation Research Institute, Agriculture Research Center, Tandojam, Sindh, Pakistan, 70060.
Abstract | The most important soil parameters for compressed surfaces are aeration, bulk density, and permeability. The experiment was managed in a split-plot design with a randomized complete block design with three replications. Results indicated that cone-penetrometer was used to measure the soil compaction of furrow bottom under without-compaction/control (C1), compaction with three passes of tractor wheel (C2), and compaction with six passes of tractor wheel (C3) treatments for the years 2017-18 and 2018-19. In the case of clay loam (S1) soil compacted under treatment C3, the compaction was maximum with mean values of 1.23 MPa followed by treatment C2 with 1.09 MPa and C1 with compaction of 0.55 MPa during the 2017-18 Rabi crop season. While, for silty clay loam (S2) soil compacted under treatment C3, the compaction was maximum with mean values of 1.12 MPa followed by treatment C2 with 0.80 MPa and C1 with compaction of 0.42 MPa during the 2017-18 Rabi crop season. Similarly, during the year 2018-19, for different dry densities under soil compaction treatments C1, C2, and C3, the soil penetration resistance values were 1.10 MPa, 0.81 MPa, and 0.40 MPa, respectively. The reduction in soil EC1:5 was determined in the without-compaction/control (C1) plots under both cropping years. However, substantial change in the soil EC1:5 was observed in compact treatment three tractor wheel passes (C2) and six tractor wheel passes (C3) plots. Generally, a slight rise in soil EC1:5 was noticed in both C2 and C3 plots over C1 treatment plots for both cropping seasons. Furthermore, a slight change in the soil pH was observed in compact treatment, three tractor wheel passes (C2) and six tractor wheel passes (C3) plots during both the years. Mostly, a slight rise in soil pH was noticed in both C2 and C3 plots over C1 treatment plots. It is also noticeable from the data that compacting the soil with a tractor using three-wheel and six-wheel passes displayed no difference in pH in bed furrow treatment plots. Our findings concluded that the effect of soil compactions on soil EC and pH values were formed slightly increased during both years as compared to without-compaction treatment. Nevertheless, soil EC values were increased with increasing soil depths under C2 and C3 over C1 treatment, while maximum EC values were recorded under furrow plots among all soil depths and soil different soil textures. Even though the soil pH was not affected by soil compaction treatments under all soil depths and soil textures during both years.
Received | April 16, 2022; Accepted | December 12, 2022; Published | December 28, 2022
*Correspondence | Rahim Bux Vistro, Department of Irrigation and Drainage, Faculty of Agricultural Engineering, Sindh Agriculture University, Tandojam, Sindh, Pakistan, 70060; Email: rbvistro@gmail.com
Citation | Vistro, R.B., M.A. Talpur, I.A. Sheikh, M.A. Mangrio, R.K. Soothar, M.N.H.A. Ali, I.A. Dhamach, M.U. Mirjat and A.S. Soomro. 2022. Changes in subsoil compaction and salinity caused by tractor wheels passes during tillage practices under different soil types. Pakistan Journal of Agricultural Research, 35(4): 644-655.
DOI | https://dx.doi.org/10.17582/journal.pjar/2022/35.4.644.655
Keywords | Soil compaction, Soil texture, Soil porosity, Tillage practices, Infiltration rate, Penetrometer
Copyright: 2022 by the authors. Licensee ResearchersLinks Ltd, England, UK.
This article is an open access article distributed under the terms and conditions of the Creative Commons Attribution (CC BY) license (https://creativecommons.org/licenses/by/4.0/).
Introduction
The most important soil parameters for compressed surfaces are aeration, bulk density, and permeability (Andrade et al., 1993). Nawaz et al. (2013) stated that resistance to soil penetration should not reach 1.000 kPa in fine-textured soil, as higher values could damage root development. Botta et al. (2008) observed that soil compacted to cone index levels of >1.200 kPa decreased wheat emerged by 26% on heavy clay soils of Argentina.
The impact of wheel loads (11, 15, and 33 kN, respectively) at inflation pressures of 50, 70, and 150 kPa on soil stress was studied by (Arvidsson and Keller, 2007) reported that tyre inflation pressure has a strong impact on soil stresses calculated at 10 cm depth but has very little influence in the subsoil (30 cm and deeper). The impact of wheel load on subsoil stresses, on the other hand, is important. Botta et al. (2002) observed that soil compaction might be divided into two types: Topsoil compaction, which occurs inside the depth range corresponding to the cultivated horizon, and subsoil compaction, which occurs at depths below the depth limit. Furthermore, subsoil compaction would result in a long-term reduction in crop yields. Botta et al. (2004) working on clayey land, discovered that after 7 years with no-tillage, crop yields could still be reduced by freshly applied wheel compaction.
Furrow irrigation is a method of laying out the water channels in such a way where gravity plays the role of providing just enough water for suitable plants to grow (Khan et al., 2015). It is generally prepared by the calculated application of ridge and furrow; later, it becomes a kind of surface irrigation system. A ridge is the elevated part of the layout, while a furrow is the part of the field that lets the water flow through it (Sun et al., 2017). It is usually believed that furrow irrigation has poor water use efficiency in comparison with high-tech micro-irrigation methods (Burt et al., 1997; Sial et al., 2011). While monitoring the interactive effect of irrigation techniques and mulching in flat sowing using 100, 80, and 60% field capacity (FC) levels (Khan et al., 2021) in saline soils. The furrow irrigation under varied nutritional supplies for maize production was tested for certain agronomic traits (Nasri et al., 2010).
But this may be the case while irrigating or cultivating land through border or flood irrigation method. It may not be in the case of furrow irrigation method, where moisture is necessary on ridges by lateral water movement from furrow channels and the water through vertical movement from the bed of furrow channels in required to be impeded. Similarly, Botta et al. (2008) observed that the soil compacted to cone index levels of >1.200 kPa decreased the wheat emerged by 26% on heavy clay soils of Argentina region. However, Arvidsson and Keller (2007) studied the impact different tractor wheel loads (11, 15, and 33 kN, respectively) and three different inflation pressures (50, 70, and 150 kPa, respectively) on soil stress. They reported that the tyre inflation pressure had a strong impact on the soil stresses calculated at 10 cm depth but has very little influence in the subsoil (30 cm and deeper).
Soil bulk density and porosity are the key indicators to present soil compaction. Although these indicators can easily appraise soil compaction, they do not assess changes in the pore size and continuity resulted from soil compaction. It is hard to guess the effect of soil compaction on soil water movement only by soil bulk density and porosity. But in furrow irrigation systems where furrows are supposed to be the carriers of water to provide moisture to ridges where plants grow, should be made able to provide water laterally to ridges or beds with minimum vertical intake within the area of furrows. To restrict the vertical entry of water in the furrow bed, its compaction is necessary.
Soil compaction has long been a source of considerable concern for farmers because it reduces agricultural production significantly (Tolon-Becerra et al., 2011). The function of intensive agriculture in causing compaction appears to be more significant. As a result, crop production suffers due to stunted aboveground growth and decreased root development (Tolon-Becerra et al., 2011; Shah et al., 2017). But this may be the case while irrigating/cultivating land through the border or flood irrigation method. It may not be in the case of the furrow irrigation method, where moisture is necessary on ridges by lateral water movement from furrow channels and the water through vertical movement from the bed of furrow channels is required to be impeded.
Materials and Methods
The present study was conducted on three (3) different texture of soils in the Tandojam, Sindh. The experiment was managed in split-plot design with randomized complete block design with three replications. Three sites were selected in accordance with required soil texture (i.e., Clay loam (25°25’27.47” N; 68°32’38.44” E), Silty Clay loam (25°25’3.44” N; 68°32’40.99” E) and silty loam (25°24’58.25” N; 68°32’31.85” E)) and 26 m above mean sea level in the vicinity of Tandojam (Figure 1). The experimental area of each site was 500 m2 (27.78 m x 18 m). The experimental layout is shown in Figure 2. The experiment was carried out during 2017-18 and 2018-19. In these months, there is no or nominal rainfall and temperature ranges from 9 to 25 oC.
Field and furrow preparation
At first, the field was cleaned by uprooting the residues of the previously cultivated crop then ploughing was done with disk plough. A soaking doze of 100 mm was applied and after few days field was ploughed with cultivator and leveled. Furrows were prepared manually with the 40 cm furrow and 60 cm ridge under all treatments (Figure 3). Furrows were prepared without compaction, with three (3) passes of tractor (Massey Ferguson MF375, 2wd, 75hp) tire wheel compaction and with six (6) passes of tractor wheel for compaction. The weight of tractor on furrow was 1.22 ton. The total weight of tractor was 2.44 tons. The soil was at field capacity at the time soil compaction. Thus, the compaction of furrows was carried out under favorable moisture condition.
Soil physical properties
The soil physical properties, i.e., infiltration rate was determined as proposed by (Klute, 1986), field capacity (Veihmeyer and Hendrickson, 1931), bulk density (Blake and Hartge, 1986), and soil porosity (Kanwar and Chopra, 1959).
Table 1: The individual soil particles percentage at different soil depths.
|
Soil depth (cm) |
Sand % |
Silt % |
Clay % |
|
S1 |
|||
|
0-20 |
26.76 |
34.80 |
38.44 |
|
20-40 |
29.72 |
31.92 |
38.36 |
|
40-60 |
28.32 |
34.92 |
36.76 |
|
60-80 |
27.84 |
38.02 |
34.14 |
|
80-100 |
32.00 |
32.52 |
35.48 |
|
S2 |
|||
|
0-20 |
14.56 |
53.04 |
32.40 |
|
20-40 |
14.22 |
54.58 |
31.20 |
|
40-60 |
13.22 |
54.38 |
32.40 |
|
60-80 |
13.42 |
53.22 |
33.36 |
|
80-100 |
12.62 |
53.38 |
34.00 |
|
S3 |
|||
|
0-20 |
28.70 |
60.70 |
10.60 |
|
20-40 |
30.72 |
58.04 |
11.24 |
|
40-60 |
28.90 |
57.78 |
13.32 |
|
60-80 |
25.30 |
64.76 |
10.00 |
|
80-100 |
26.58 |
60.96 |
12.46 |
Note: S1= Clay loam soil; S2= Silty clay loam soil; S3= Silty loam soil.
Soil texture
Following physical properties were assessed to evaluate the effect of a number of tractor wheel compaction on the vertical movement of water. The five soils samples from each experimental unit were collected at random up to the depth of 0-20, 20-40, 40-60 cm. The soil texture obviously influences the water holding capacity and infiltration rate of the soil. For determination of soil textural class, Bouyoucos hydrometer was used applying USDA textural triangle method (Ryan and Estefan, 2001), and detailed present in Table 1.
Dry bulk density
By using a core sampler, the samples from different soil depths were obtained and dried in the oven at 105oC for 24 hours. The inner dimensions of core sampler were measured for analysing the soil volume as suggested by (Blake and Hartge, 1986).

Field capacity
For the determination of field capacity, the soil samples were collected before and after irrigation by means of core samples from all plots at the experimental site by using the following equation (Veihmeyer and Hendrickson, 1931).

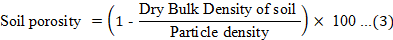
Soil porosity
Soil porosity was determined using the equation given by (Kanwar and Chopra, 1959).
Cone-penetrometer
Soil compaction was measured with a cone-penetrometer in soil compaction of furrow bottom under control (C1), compaction with three passes of tractor wheel (C2), and compaction with six passes of tractor wheel (C3) treatments for the years 2017-18 and 2018-19 as proposed by (Arriagaet al., 2008).
Soil chemical properties
For the determination of soil chemical properties in the experimental plots, holes were made by boring up to the desired soil depths, and soil samples where five samples in each plot were collected at 0-20, 20-40, 40-60, 60-80 and 80-100cm soil depths. The sampling of the soil was made before sowing as well as after the harvest of test crop to determine EC, and pH, as suggested by (Weir, 1930).
Statistical analysis
The collected data was analyzed statistically through Statistic version 8.1. To compare the superiority of treatments, LSD test was applied for the study at the significance level of 0.05.
Results and Discussion
Soil compaction
Clay loam (S1) soil: In agriculture, soil compaction, strength, and cohesiveness are usually measured using penetrometers. In the present study, a cone-penetrometer was used to measure the soil compaction of furrow bottom under without-compaction/control (C1), compaction with three passes of tractor wheel (C2), and compaction with six passes of tractor wheel (C3) treatments for the years 2017-18 and 2018-19. The results of the study revealed that for clay loam (S1) soil compacted under treatment C3, the compaction was maximum with mean values of 1.23 MPa followed by treatment C2 with 1.09 MPa and C1 with compaction of 0.55 MPa during the 2017-18 Rabi crop season. The compaction of each treatment was plotted against the respective soil dry density, as shown in Figure 3a, b. It depicts that with increasing soil dry density/compaction, soil resistance to penetration increases.
Similarly, during the year 2018-19, for different dry densities under soil compaction treatments C1, C2 and C3, the soil penetration resistance values were C3 (1.20 MPa), C2 (1.08 MPa), and C1 (0.56 MPa), respectively, as shown in Table 2.
Table 2: Dry bulk density under different compactions and soil penetration resistancefor clay loam (S1) soil during the croping years 2017-18 and 2018-19.
|
Treatment |
S1 |
|||
|
Bulk density (g cm-3) |
Penetrometer (MPa) |
Bulk density (gcm-3) |
Penetrometer (MPa) |
|
|
2017-18 |
2018-19 |
|||
|
C1 |
1.34 |
0.55 |
1.269 |
0.56 |
|
C2 |
1.45 |
1.09 |
1.376 |
1.08 |
|
C3 |
1.52 |
1.23 |
1.446 |
1.20 |
Note: S1= Clay loam soil; C1= Control without compaction; C2= Compaction with 03 rounds of tractor wheels passes; C3= Compaction with 06 rounds of tractor wheels passes.
It was observed that the dry bulk density of clay loam (S1) soil was increasing significantly with increasing compaction as well as soil depth. With increasing soil compaction, the infiltration was highly impeded by the subsurface soil as compared to the surface soils. It certainly decreased the water infiltration from the furrow bottom and increased the lateral water flow toward the furrow bed where the crop was sown, as was also reported by (Siyal et al., 2012) for the furrow irrigation system.
Silty clay loam (S2) soil: In agriculture, soil compaction, strength, and cohesiveness are usually measured using penetrometers (Bogunovic et al., 2018). In the present study, a cone-penetrometer was used to measure the soil compaction of furrow bottom under without-compaction/control (C1), compaction with three (03) passes of tractor wheel (C2), and compaction with six (06) passes of tractor wheel (C3) treatments for the croping years 2017-18 and 2018-19. The results of the study revealed that for silty clay loam (S2) soil compacted under treatment C3, the compaction was maximum with mean values of 1.12 MPa followed by treatment C2 with 0.80 MPa and C1 with compaction of 0.42 MPa during the 2017-18 Rabi crop season. The compaction of each treatment was plotted against the respective soil dry density, as shown in (Figure 4a, b). It depicts that with increasing soil dry density/compaction, soil resistance to penetration increases.
Similarly, during the year 2018-19, for different dry densities under soil compaction treatments C1, C2, and C3, the soil penetration resistance values were C3 (1.10 MPa), C2 (0.81 MPa), and C1 (0.40 MPa), respectively, as shown in Table 3.
Table 3: Dry bulk density under different compactions and soil penetration resistance for silty clay loam (S2) soil during the years 2017-18 and 2018-19.
|
Treatment |
S2 |
|||
|
Bulk density (g cm-3) |
Penetrometer (MPa) |
Bulk density (g cm-3) |
Penetrometer (MPa) |
|
|
2017-18 |
2018-19 |
|||
|
C1 |
1.33 |
0.42 |
1.259 |
0.4 |
|
C2 |
1.42 |
0.80 |
1.346 |
0.81 |
|
C3 |
1.49 |
1.12 |
1.416 |
1.10 |
Note: S2= Silty clay loam soil; C1= Control without compaction; C2= Compaction with 03 rounds of tractor wheels passes; C3= Compaction with 06 rounds of tractor wheels passes.
It was observed that the dry bulk density of silty clay loam (S2) soil was increasing significantly with increasing compaction as well as soil depth. With increasing soil compaction, the infiltration was highly impeded by the subsurface soil compared to the surface soils. It certainly decreased the water infiltration from the furrow bottom and increased the lateral water flow toward the furrow bed where the crop was sown.
Silty loam (S3) soil: In agriculture, soil compaction, strength, and cohesiveness are usually measured using penetrometers (Augustin et al., 2020). In the present study, a cone-penetrometer was used to measure the soil compaction of furrow bottom under without-compaction/control (C1), compaction with three passes of tractor wheel (C2), and compaction with six passes of tractor wheel (C3) treatments for the years 2017-18 and 2018-19. The results of the study revealed that for silty loam (S3) soil compacted under treatment C3, the compaction was maximum with mean values of 0.92 MPa followed by treatment C2 with 0.72 MPa and C1 with compaction of 0.35 MPa during the 2017-18 Rabi crop season. The compaction of each treatment was plotted against the respective soil dry density, as shown in (Figure 5a, b). It depicts that with increasing soil dry density/compaction, soil resistance to penetration increases.
Similarly, during the year 2018-19, for different dry densities under soil compaction treatments C1, C2, and C3, the soil penetration resistance values were 0.90 MPa, 0.70 MPa, and 0.37 MPa, respectively, as shown in Table 4.
It was observed that the dry bulk density of silty loam (S3) soil was increasing significantly with increasing compaction as well as soil depth. With increasing soil compaction, the infiltration was highly impeded by the subsurface soil as compared to the surface soils. It certainly decreased the water infiltration from the furrow bottom and increased the lateral water flow toward the furrow bed where the crop was sown, as was also reported by (Vaz et al., 2001) for the furrow irrigation system.
Table 4: Dry Bulk density under different compactions and soil penetration resistance for silty loam (S3) soil during 2017-18 (a) and 2018-19 (b) cropping seasons.
|
Treatment |
S3 |
|||
|
Bulk density (g cm-3) |
Penetrometer (MPa) |
Bulk density (g cm-3) |
Penetrometer (MPa) |
|
|
2017-18 |
2018-19 |
|||
|
C1 |
1.31 |
0.35 |
1.239 |
0.37 |
|
C2 |
1.38 |
0.72 |
1.306 |
0.70 |
|
C3 |
1.47 |
0.92 |
1.396 |
0.90 |
Note: S3= Silty loam soil; C1= Control without compaction; C2= Compaction with 03 rounds of tractor wheels passes; C3= Compaction with 06 rounds of tractor wheels passes.
Changes in soil salinity
Electrical conductivity (EC1:5) for clay loam (S1) soil: The data related to the effect of soil compactness created by C2and C3 tractor wheel passes in furrows irrigation system on the electrical conductivity of soil under Rabi wheat during 2017-18 and 2018-19 cropping season are given in Figure 6a, b.
It is apparent from the results that as compared to the before sowing there was decline in soil EC1:5 determined in the without compaction/control (C1) treatments plots. However, substantial change in the soil EC1:5 was detected in soil compaction treatments, three tractor wheel passes (C2) and six tractor wheel passes (C3) plots. Mostly, a minor rise in soil EC1:5 was noticed in both C2 and C3 as compacted to the C1 treatment plot. It is also apparent from the data that compacting the soil with a tractor using C2 and C3 raised the EC1:5 more in bed furrow treatment plots. Variation in soil EC1:5 determined at various depths in relation to compactness, bed furrows were observed under normal conditions (before sowing). A slight decrease in the EC1:5 with increasing depth was also observed. Generally, in the C3 treatment plots EC1:5 showed an opposite trend, i.e., there was an increase in the EC1:5 with increasing depth for the bed furrow situation. Though the slight variation for EC1:5 depth and compact treatment effects was also observed for the Year 2018-19, except a slight rise in EC1:5 was noticed in almost all bed furrow treatment plots.
Electrical conductivity (EC1:5) for silty clay loam (S2) soil
The data related to the effect of soil compactness created by three and six tractor wheel passes using bed furrows and ridges on electrical conductivity (salinity status) of soil that remained under wheat crop cultivation during 2017-18, and 2018-19 are given in Figure 7a, b.
It is evident from the results that as compared to the before sowing, there was a reduction in soil EC1:5 determined in the without compaction/ control (C1) plots. However, a considerable change in the soil EC1:5 was observed in soil compact treatment three tractor wheel passes (C2) and six tractor wheel passes (C3) treatment plots. Overall, a slight rise in soil EC1:5 was observed in both C2 and C3 plots over the C1 treatment plot. It is also clear from the data that compacting the soil with a tractor using C2 and six tractor wheel passes (C3) raised the EC1:5 further in bed furrow plots. The difference in soil EC1:5 determined at various depths in relation to compactness, bed furrows was observed under normal conditions (before sowing). A slight decrease in EC1:5 with increasing depth was also observed. Generally, in C3 treatment plots, EC1:5 showed an opposite trend, i.e., there was an increase in EC1:5 with increasing depth for bed furrow environment. Slight variation in EC1:5, depth, and compact treatment effects was also observed for the Year 2018-19, except a slight rise in EC1:5 noticed in approximately all bed furrow treatments plots of C1, C2, and C3.
Electrical conductivity (EC1:5) for silty loam (S3) soil
The data relating to the effect of soil compactness generated by three passes of tractor wheel (C2) and compaction with six passes of tractor wheel (C3) using bed furrows on electrical conductivity (salinity status) of soil remained under wheat crop cultivation during 2017-18 and 2018-19 are given in the Figure 8a, b.
It is apparent from the results that as compared to the before sowing there was a reduction in soil EC1:5 determined in without compaction/control (C1) plots; however, substantial change in the soil EC1:5 was observed in compact treatment C2and C3 plots. The slight rise in soil EC1:5 was noticed in both C2 and C3 plots over C1 treatment plot. It is also noticeable from the data that compacting the soil with the tractor using three- and six-wheel passes raised the EC1:5 further in bed furrow plots. Change in soil EC1:5 at several depths in relation to compactness, bed furrows were observed under standard conditions (before sowing). A slight decrease in EC1:5 with increasing depth was also observed. Generally, in C3 treatment plots, EC1:5 showed an opposite trend, i.e., there was an increase in EC1:5 with increasing depth for the bed furrow environment. Mostly, a slight variation for EC1:5 depth and compact treatment effects was also observed for the Year 2018-19, without a slight rise in EC1:5 was noticed in almost all bed furrow treatments plots of C1, C2, and C3.
pH of soil for clay loam (S1) soil
The data given in Figure 9a, b indicated the effect of soil compactness created by C2 and C3 tractor wheel passes using bed furrows on soil pH recorded at various depths remained under wheat crop cultivation during 2017-18 and 2018-19.
The results obtained from the study indicated that as compared to the before sowing, there was a slight decrease in soil pH determined in the without compaction/control (C1) bed furrows treatment plots, it shows a similar trend as before sowing. However, a slight change in the soil pH was observed in compact treatment, C2, and C3 treatment plots during both cropping seasons. Mostly, a slight rise in soil pH was noticed in both C2 and C3 plots over C1 treatment plots. It is also noticeable from the data that compacting the soil with a tractor using C2 and C3 displayed no difference for soil pH in bed furrow treatment plots. The difference in soil pH determined at various soil depths in relation to compactness, bed furrows was detected under normal conditions (before sowing). A very slight rise in soil pH with depth was also noticed in the 2018-19 cropping seasons. In C2 and C3 treatment, plots, rise in soil pH with increasing depth for the bed furrow plots were recorded. Soil pH marginally at the rise soil surface and compact treatment very little impact of years were observed. However, a slight rise in soil pH was also noticed in almost all bed furrow treatment plots of C1, C2, and C3 through passing the tractor wheels compaction.
pH of soil for silty clay loam (S2) soil
The data given in Figure 10a, b indicated the effect of soil compactness established by three and six tractor wheel passes using bed furrows on soil pH recorded at various depths stayed under wheat crop cultivation during 2017-18 and 2018-19.
The results achieved from the study showed that as compared to the before sowing, there was a slight reduction in soil pH examined in the without compaction/control (C1) bed furrow treatment plots, it shows a similar trend as before sowing. However, a slight change in the soil pH was observed in compact treatment, C2, and C3 plots during both years. Mostly, a slight rise in soil pH was observed in both C2 and C3 plots over C1 treatment plots. It is also investigated from the data that compacting the soil with C2 and C3 approved no difference for pH in bed furrow treatment plots. The difference in soil pH found at various soil depths in relation to compactness, bed furrows were identified under average conditions (before sowing). A very slight rise in soil pH with depth was also noticed in both years. In C2 and C3 treatment, plots rise in soil pH with increasing depth for the bed furrow plots were recorded. Soil pH marginally at the rise soil surface and compact treatment very minor influence of years was observed. A slight rise in soil pH was also noticed in almost all bed furrow treatment plots of C1, C2, and C3 over passing the tractor wheels compactions.
pH of soil for silty loam (S3) soil
The data given in Figure 11a, b showed the effect of soil compactness formed by three passes of tractor wheel (C2) and six passes of tractor wheel (C3) using bed furrows on soil pH recorded at several depths remained under wheat crop cultivation during 2017-18 and 2018-19.
The results achieved from the study specified that as compared to the before sowing, there was a slight decrease in soil pH determined under without compaction/control (C1) bed furrow treatment plots, it shows the comparable trend as before sowing. However, a slight change in the soil pH was observed in compact treatment, C2, and C3 plots during both years. Mostly, a slight rise in soil pH was noticed in both C2 and C3 plots over C1 treatment plots. It is also noticeable from the data that compacting the soil with a tractor using C2 and C3 revealed no difference for pH in bed furrow treatment plots. The difference in soil pH determined at various soil depths in relative to compactness bed furrows was discovered under normal conditions (before sowing). A very slight rise in soil pH with depth was also noticed in both years. In C2 and C3 treatment, plots rise in soil pH with increasing depth for the bed furrow plots were recorded. Soil pH marginally at the rise soil surface and compact treatment very little impact of years were observed. A slight rise in soil pH was also noticed in almost all bed furrow treatment plots of C1, C2, and C3 through passing the tractor wheels.
A study conducted by (Chan et al., 2006) compared soil between wheel tracks (1000 kPa and 1.25–1.29 Mg m3, and 0.187–0.226 m3) in 0.05–0.10m soil layer under wheel tracks and found significantly higher penetrometer resistance (>2000 kPa), bulk density (1.5–1.58 Mg m3), and lower air-filled porosity (0.07–0.09 m3) with similar wheat yields (5.3–5.5 t ha-1) on wheel track in clay soil.
In agriculture, soil compaction, strength, and cohesiveness are usually measured using penetrometers (Arriaga et al., 2008). In the present study, a cone-penetrometer was used to measure the soil compaction of furrow bottom under control (C1), compaction with three passes of tractor wheel (C2), and compaction with six passes of tractor wheel (C3) treatments for the years 2017-18 and 2018-19. It was observed that in both field experiments, the dry bulk density of clay loam soil was increased significantly with increasing the soil compaction with increasing the soil depth (Figures 3-5 and Tables 2-4). With increasing soil compaction, the infiltration rate was highly impeded by the subsurface soil as compared to the surface soils. It certainly decreased the water infiltration from the furrow bottom and increased the lateral water flow toward the furrow bed where the crop was sown. Similarly, the same findings were reported by (Siyal et al., 2012) for the furrow irrigation system.
Agricultural heavy machineries are the major causes of disturbance in soil properties especially, soil macro-porosity and quality. Therefore, the challenges are to achieve a suitable seedbed while minimizing wheel traffic-induced soil compaction, and negative impacts on the physical and chemical properties of soils. In the current study, the reduction in soil EC1:5 determined in the without-compaction/control (C1) plots under both cropping years, However, substantial change in the soil EC1:5 was observed in compact treatment three tractor wheel passes (C2) and six tractor wheels passes (C3) plots (Figures 6-8). Generally, a slight rise in soil EC1:5 was noticed in both C2 and C3 plots over C1 treatment plots for the 2017-18 and 2018-19 cropping seasons. In addition, reduction in EC1:5without compactions was possibly the suitable physical conditions of soil, generally infiltration permeability aggregations, and stable soil structure. However, in the compact treatment plots, there was a change in EC1:5 values, some where it was increased, whereas in some cases, it was decreased. This indicates that the compactness decreases aggregation blocks aeration, increases infiltrations, and accumulates salts. Ying et al. (2021) established that soil compaction increases salt concentrations due to dry bulk density of the low infiltration rates, and low porosity of the soil. Yang et al. (2014) evaluated that the optimum water content and dry bulk density remain high under compact conditions which encourage and rise EC1:5and sodium concentrations in soil. Soil salinity status, and movement of water and solutes along certain pathways such as pores and cracks and bypass a fraction of the porous matrix (Jarvis, 2007). In the current study, differences in soil EC1:5 values among three different soils may be due to the different soil textures and bulk densities. However: negligible differences between ridges and bed furrow plots. Previous literatures (Shariatmadari et al., 2011; Ying et al., 2021). However, soil texture had considered that number of soil processes, such as structure development, soil fertility and nutrients availability related to the soil texture (Fernandez-Illescas et al., 2001; Bronick and Lal, 2005).
Soil pH indicates the relationship between land use and attributed to the presence of above and belowground crop residuals as well as farmlands managements practices such as fertilizer application and organic amendments. Oxidation of nitrogen from fertilizers and accumulation of organic matter can decline soil pH (Brady and Weil, 1999). The results displayed that slight decrease in soil pH determined in the control/without-compaction (C1) bed furrow treatment plots it shows the similar trend as before sowing. However, slight change in the soil pH was observed in compact treatment, three tractor wheel passes (C2) and six tractor wheels passes (C3) plots during both the years. Mostly, slight rise in soil pH was noticed in both C2 and C3 plots over C1 treatment plots shown in Figures 9-11. It is also noticeable from the data that compacting the soil with tractor using three and six-wheel passes displayed no difference for pH in bed furrow treatment plots. Difference in soil pH determined at various soil depths in relation to compactness, bed furrows was detected under normal condition (before sowing). However, slight rise in soil pH with depth was also noticed in both the years. In C2 and C3 treatment plots rise in soil pH with increasing depth for the bed furrow plots was recorded. Soil pH marginally at rise soil surface and compact treatment very little impact of years was observed. Overall, there was no significant differences between all treatments and soil depths on soil pH before and after treatments applied, while negligible increase in pH with soil depths was noticed.
A recent study performed by (Nabiollahi et al., 2021) investigated that soil pH increases due to continually soil irrigated with tube well water as compared to canal water irrigated fields. The decomposition of plant residual also decreases soil pH due to the release acidic organic compounds from wheat plant residue, while slight increases in soil pH with soil depth. Similar, picture was observed by (Xiao et al., 2017) evaluated that soil pH increase with soil depth, due to low organic matter content. These findings support these results that positive correlation between soil pH among all treatments and soil depths. Agricultural practices adopted for conservative purposes have to be monitored to evaluate their long-term effects on soil quality and the practices reducing soil quality should be relinquished.
Conclusions and Recommendations
Generally, the effect on soil compactions on soil EC and pH values were formed slightly increasing during the 2 years of the experiments as compared to without compaction treatment. This could be due to the number of passes of the machinery, tractors, or vehicles for the cultivation of soils and other agronomical operations caused compaction of soil and cause negative impacts on soil quality. The infiltration was higher in silty loam soil as compared to silty clay loam and clay loam soils; regardless of soil texture, the soil compaction resulted in low infiltration rate in furrow bed and compelled water to move towards ridge side. However, soil EC values were increased with increasing soil depths under C2 and C3 over C1 treatment, while maximum EC values were recorded under furrow plots among all soil depths and soil different soil textures. While soil pH was not affected by soil compaction treatments under all soil depths and soil textures during both years.
Novelty Statement
This study evaluated the effect of furrow’s compaction through tractor wheel passes on physiochemical properties of three different soils.
Author’s Contribution
Rahim Bux Vistro: Conceived the idea and wrote the manuscript.
Mashooque Ali Talpur: Conceived the idea, technical input at every step, overall management of the article, result and discussion.
Irfan Ahmed Sheikh: Wrote abstract, methodology, conclusion, technical input at every step, introduction, references.
Muneer Ahmed Mangrio: Did SPSS analysis, technical input at every step, overall management of the article.
Rajish Kumar Soothar: Did data entry in SPSS, and analysis.
Mian Noor Hussain Asghar Ali: Technical input at every step, introduction, references.
Imran Ali Dhamach: Did overall management of the article and result.
Muhammd Urs Mirjat: Did result and discussion, introduction and references.
Abdul Saboor Soomro: Did overall management of the article and result.
Conflict of interest
The authors have declared no conflict of interest.
References
Andrade, A., D.W. Wolfe and E. Fereres. 1993. Leaf expansion, photosynthesis, and water relations of sunflower plants grown on compacted soil. Plant Soil, 149: 175–184. https://doi.org/10.1007/BF00016607
Arriaga, P., F. Esteves, P. Carneiro and M.B. Monteiro. 2008. Are theeffects of unreal violent videogames pronounced when playing with avirtual reality system? Aggress Behav., 34: 521–538. https://doi.org/10.1002/ab.20272
Arvidsson, J., and T. Keller. 2007. Soil stress as affected by wheel load and tyre inflation pressure. Soil Tillage Res., 96: 284–291. https://doi.org/10.1016/j.still.2007.06.012
Augustin, K., M. Kuhwald, J. Brunotte and R. Duttmann. 2020. Wheel load and wheel pass frequency as indicators for soil compaction risk: A four-year analysis of traffic intensity at field scale. Geosciences, 10: 292. https://doi.org/10.3390/geosciences10080292
Blake, G.R., and K.H. Hartge. 1986. Bulk density. In: (ed. A. Klute). Methods of soil analysis, Part 1 physical and mineralogical methods, 2nd Editio. American Society of Agronomy Soil Science Society of America, Madison
Bogunovic, I., Bogunovic, I., Pereira, P., Kisic, I., Sajko, K., and Sraka, M. 2018. Tillage management impacts on soil compaction, erosion and crop yield in Stagnosols (Croatia). Catena, 160: 376–384. https://doi.org/10.1016/j.catena.2017.10.009
Bottaab, G.F., Riverod, D., Tourna, M., Bellora, F., Melcona, Pozzoloc, O., Nardong, G., Balbuenae, R., Tolon Becerraf, A., Rosattoa, H., and S. Stadler. 2008. Soil compaction produced by tractor with radial and cross-ply tyres in two tillage regimes. Soil Tillage Res., 101: 44–51. https://doi.org/10.1016/j.still.2008.06.001
Botta, G., D. Jorajuria, R. Balbuena and H. Rosatto. 2004. Mechanical and cropping behavior of direct drilled soil under different traffic intensities: effect on soybean (Glycine max L.) yields. Soil Tillage Res., 78: 53–58. https://doi.org/10.1016/j.still.2004.01.004
Botta, G.F., D. Jorajuria, L.M. Draghi. 2002. Influence of the axle load, tyre size and configuration on the compaction of a freshly tilled clayey soil. J. Terramech., 39: 47–54. https://doi.org/10.1016/S0022-4898(02)00003-4
Brady, N.C. and R.R. Weil. 1999. The nature and properties of soils, 12th Ed. Prentice Hall Publishers, London
Bronick, C.J., and R. Lal. 2005. Soil structure and management: A review. Geoderma, 124: 3–22. https://doi.org/10.1016/j.geoderma.2004.03.005
Burt, C. M., Clemmens, A. J., Strelkoff, T. S., Solomon, K. H., Bliesner, R. D., Hardy, L. A., Howell, T. A., and D. E. Eisenhauer. 1997. Irrigation performance measures: Efficiency and uniformity. J. Irrig. Drain Eng., 123: 423–442. https://doi.org/10.1061/(ASCE)0733-9437(1997)123:6(423)
Chan, K.Y., A. Oates, A.D. Swan, R.C. Hayes, B.S. Dear and M.B. Peoples. 2006. Agronomic consequences of tractor wheel compaction on a clay soil. Soil Tillage Res., 89: 13–21. https://doi.org/10.1016/j.still.2005.06.007
Fernandez-Illescas, C.P., A. Porporato, F. Laio, and I. Rodriguez-Iturbe. 2001. The ecohydrological role of soil texture in a water-limited ecosystem. Water Resour. Res., 37: 2863–2872. https://doi.org/10.1029/2000WR000121
Jarvis, N.J., 2007. A review of non-equilibrium water flow and solute transport in soil macropores: principles, controlling factors and consequences for water quality. Eur. J. Soil Sci., 58: 523–546. https://doi.org/10.1111/j.1365-2389.2007.00915.x
Kanwar, J.S. and S.L. Chopra. 1959. Practical agriculture chemistry. S. Chand and Co., New Dehli
Khan, A.G., Anwar-ul-Hassan, M. Iqbal and E. Ullah. 2015. Assessing the performance of different irrigation techniques to enhance the water use efficiency and yield of maize under deficit water supply. Soil Environ., 34: 166–179.
Khan, A. G., Imran, M., Khan, A. U. H., Fares, A., Šimůnek, J., Ul-Haq, T., Alsahli, A. Z. A., Alyemeni, M. N., and S. Ali. 2021. Performance of spring and summer-sown maize under different irrigation strategies in Pakistan. Sustainability, 13: 2757. https://doi.org/10.3390/su13052757
Klute, 1986. Water retention: Laboratory methods, C.A. Black. ASA, Madison; SSSA
Nabiollahi, K., R. Taghizadeh-Mehrjardi, A. Shahabi, B. Heung, A. Amirian-Chakan, M. Davari and T. Scholten. 2021. Assessing agricultural salt-affected land using digital soil mapping and hybridized random forests. Geoderma, 385: 49–58. https://doi.org/10.1016/j.geoderma.2020.114858
Nasri, M., M. Khalatbari and H.A. Farahani. 2010. The effect of alternate furrow irrigation under different nutritional element supplies on some agronomic traits and seed qualitative parameters in corn (Zea mays L.). J. Cereal Oilseeds, 1: 17–23.
Nawaz, M.F., G. Bourrié and F. Trolard. 2013. Soil compaction impact and modelling. A review. Agron. Sustain. Dev., 33: 291–309. https://doi.org/10.1007/s13593-011-0071-8
Ryan, J.G., and G. Estefan. 2001. Soil plant analysis soil and plant analysis laboratory manual, 2nd edn. International Center for Agricultural Research in the Dry Areas (ICARDA), Aleppo, Syria
Shah, A. N., Tanveer, M., Shahzad, B., Yang, G., Fahad, S., Ali, S., Bukhari, M. A., Tung, S. A., Hafeez, A., and B. Souliyanonh. 2017. Soil compaction effects on soil health and cropproductivity: An overview. Environ. Sci. Pollut. Res., 24: 10056–10067. https://doi.org/10.1007/s11356-017-8421-y
Shariatmadari, N., M. Salami and M.K. Fard. 2011. Effect of inorganic salt solutions on some geotechnical properties of soil-bentonite mixtures as barriers. Int. J. Civil Eng. 9: 103–110.
Sial, M.H., M.S. Awan and M. Waqas. 2011. Role of institutional credit on agricultural production: A time series analysis of Pakistan. Int. J. Econ. Finance, 3: 126–132. https://doi.org/10.5539/ijef.v3n2p126
Siyal, A.A., K.L. Bristow and J. Šimůnek. 2012. Minimizing nitrogen leaching from furrow irrigation through novel fertilizer placement and soil surface management strategies. Agric. Water Manage., 115: 242–251. https://doi.org/10.1016/j.agwat.2012.09.008
Sun, C., Feng, D., Mi, Z., Li, C., Zhang, J., Gao, Y., and J. Sun. 2017. Impacts of ridge-furrow planting on salt stress and cotton yield under drip irrigation. Water, 9: 49. https://doi.org/10.3390/w9010049
Tolon-Becerra, A., Lastra-Bravo, X. B., Botta, G. F., Tourn, M., Linares, P., Ressia, M., and R. Balbuena. 2011. Traffic effect on soil compaction and yields of wheat in Spain. Spanish J. Agric. Res., 9: 395. https://doi.org/10.5424/sjar/20110902-235-10
Vaz, C.M., L.H. Bassoi and J. Hopmans. 2001. Contribution of water content and bulk density to field soil penetration resistance as measured by a combined cone penetrometer TDR probe. Soil Tillage Res., 60: 35–42. https://doi.org/10.1016/S0167-1987(01)00173-8
Veihmeyer, F.J., University of C, Hendrickson AH, University of C, 1931. The moisture equivalent as a measure of the field capacity of soils. XXXII: 181–193. https://doi.org/10.1097/00010694-193109000-00003
Weir, W.W., 1930. Soil science. Science, 71: 218–218. https://doi.org/10.1126/science.71.1834.218.a
Xiao, H., Z. Li, X. Chang, J. Huang, X. Nie, C. Liu and J. Jiang. 2017. Soil erosion-related dynamics of soil bacterial communities and microbial respiration. Appl. Soil Ecol., 119: 205–213. https://doi.org/10.1016/j.apsoil.2017.06.018
Yang, F., Zhang, G. L., Yang, J. L., Li, D. C., Zhao, Y. G., Liu, F., Yang, R. M., and F. Yang. 2014. Organic matter controls of soil water retention in an alpine grassland and its significance for hydrological processes. J. Hydrol., 519: 3086–3093. https://doi.org/10.1016/j.jhydrol.2014.10.054
Ying, Z., Y.J. Cui, N. Benahmed and M. Duc. 2021. Salinity effect on the compaction behaviour, matric suction, stiffness and microstructure of a silty soil. J. Rock Mech Geotech. Eng., 13: 855–863. https://doi.org/10.1016/j.jrmge.2021.01.002
To share on other social networks, click on any share button. What are these?