Assessment of Optimum Salinity Level for Maximum Growth and Survival of Nile Tilapia, Oreochromis niloticus (Linnaeus 1758)
Assessment of Optimum Salinity Level for Maximum Growth and Survival of Nile Tilapia, Oreochromis niloticus (Linnaeus 1758)
Abdul Malik1,2, Ghulam Abbas1,*, Abdul Ghaffar3, Ghulam Dastagir4, Sara Ferrando5, Lorenzo Gallus5, Asad Ali Muhammad1,6, Abdul Jabbar2 and Khalil-ur-Rehman2
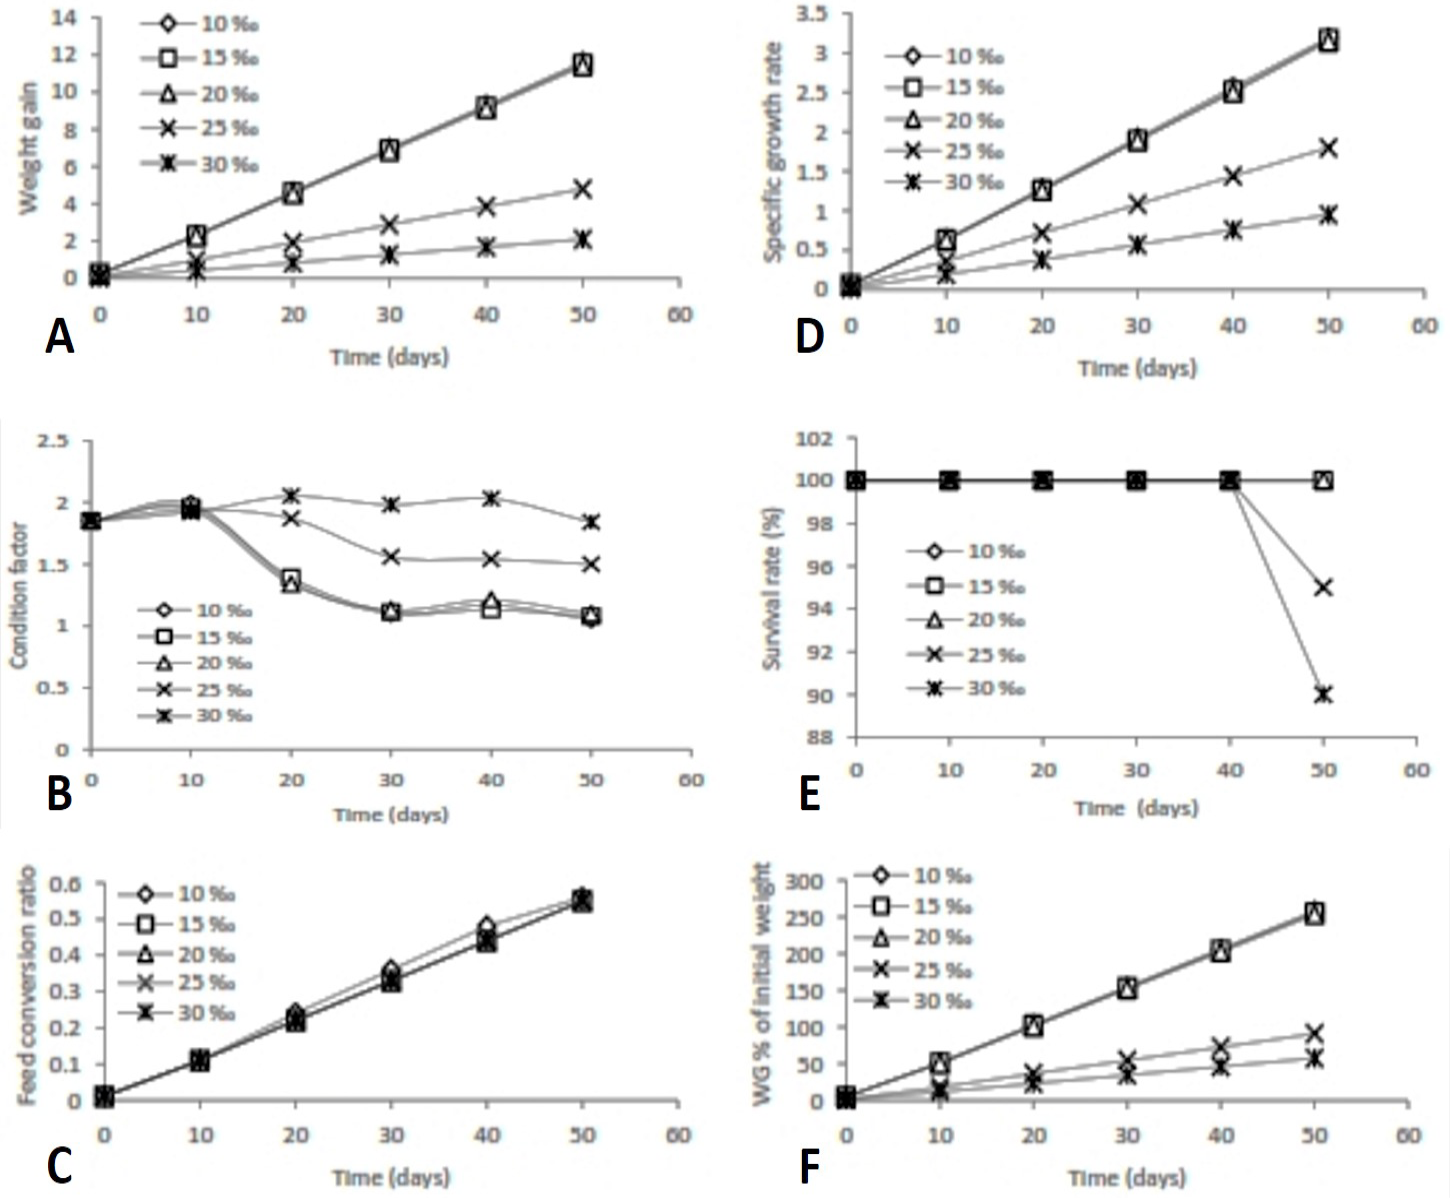
Growth performance of Nile tilapia in terms of weight gain (A), specific growth rate (B), condition factor (C), survival rate (D), feed conversion ratio (E) and weight gain, % of initial weight (F) at different salinity levels for 50 days.
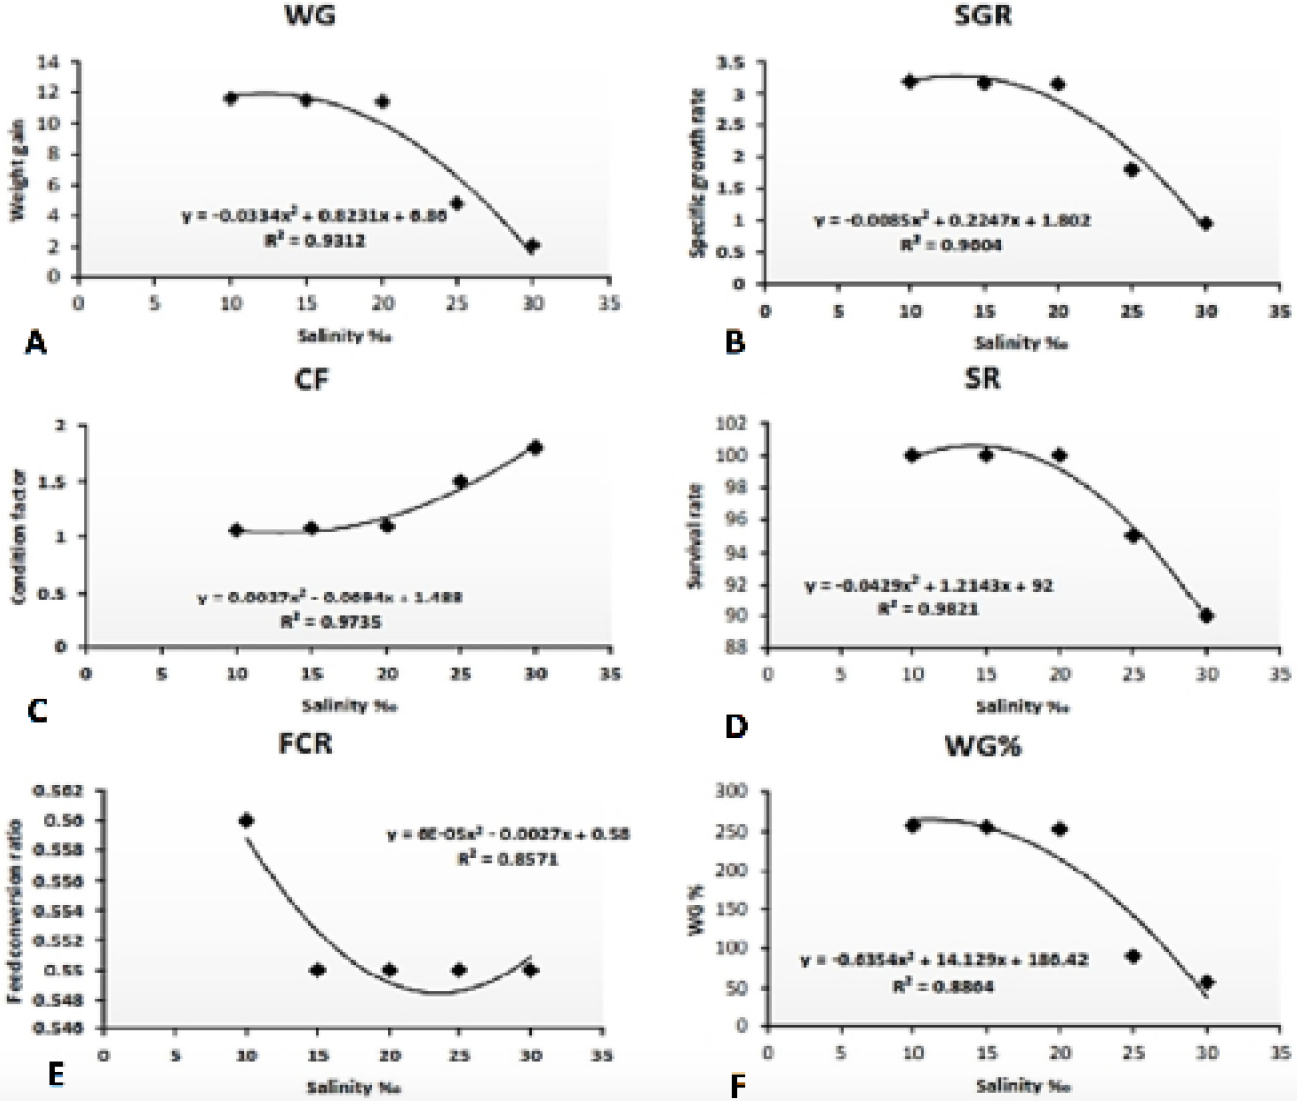
Regression among the growth parameters of Nile tilapia in terms of weight gain (A), specific growth rate (B), condition factor (C), survival rate (D), feed conversion ratio (E) and weight gain, % of initial weight at different salinity levels for 50 days.
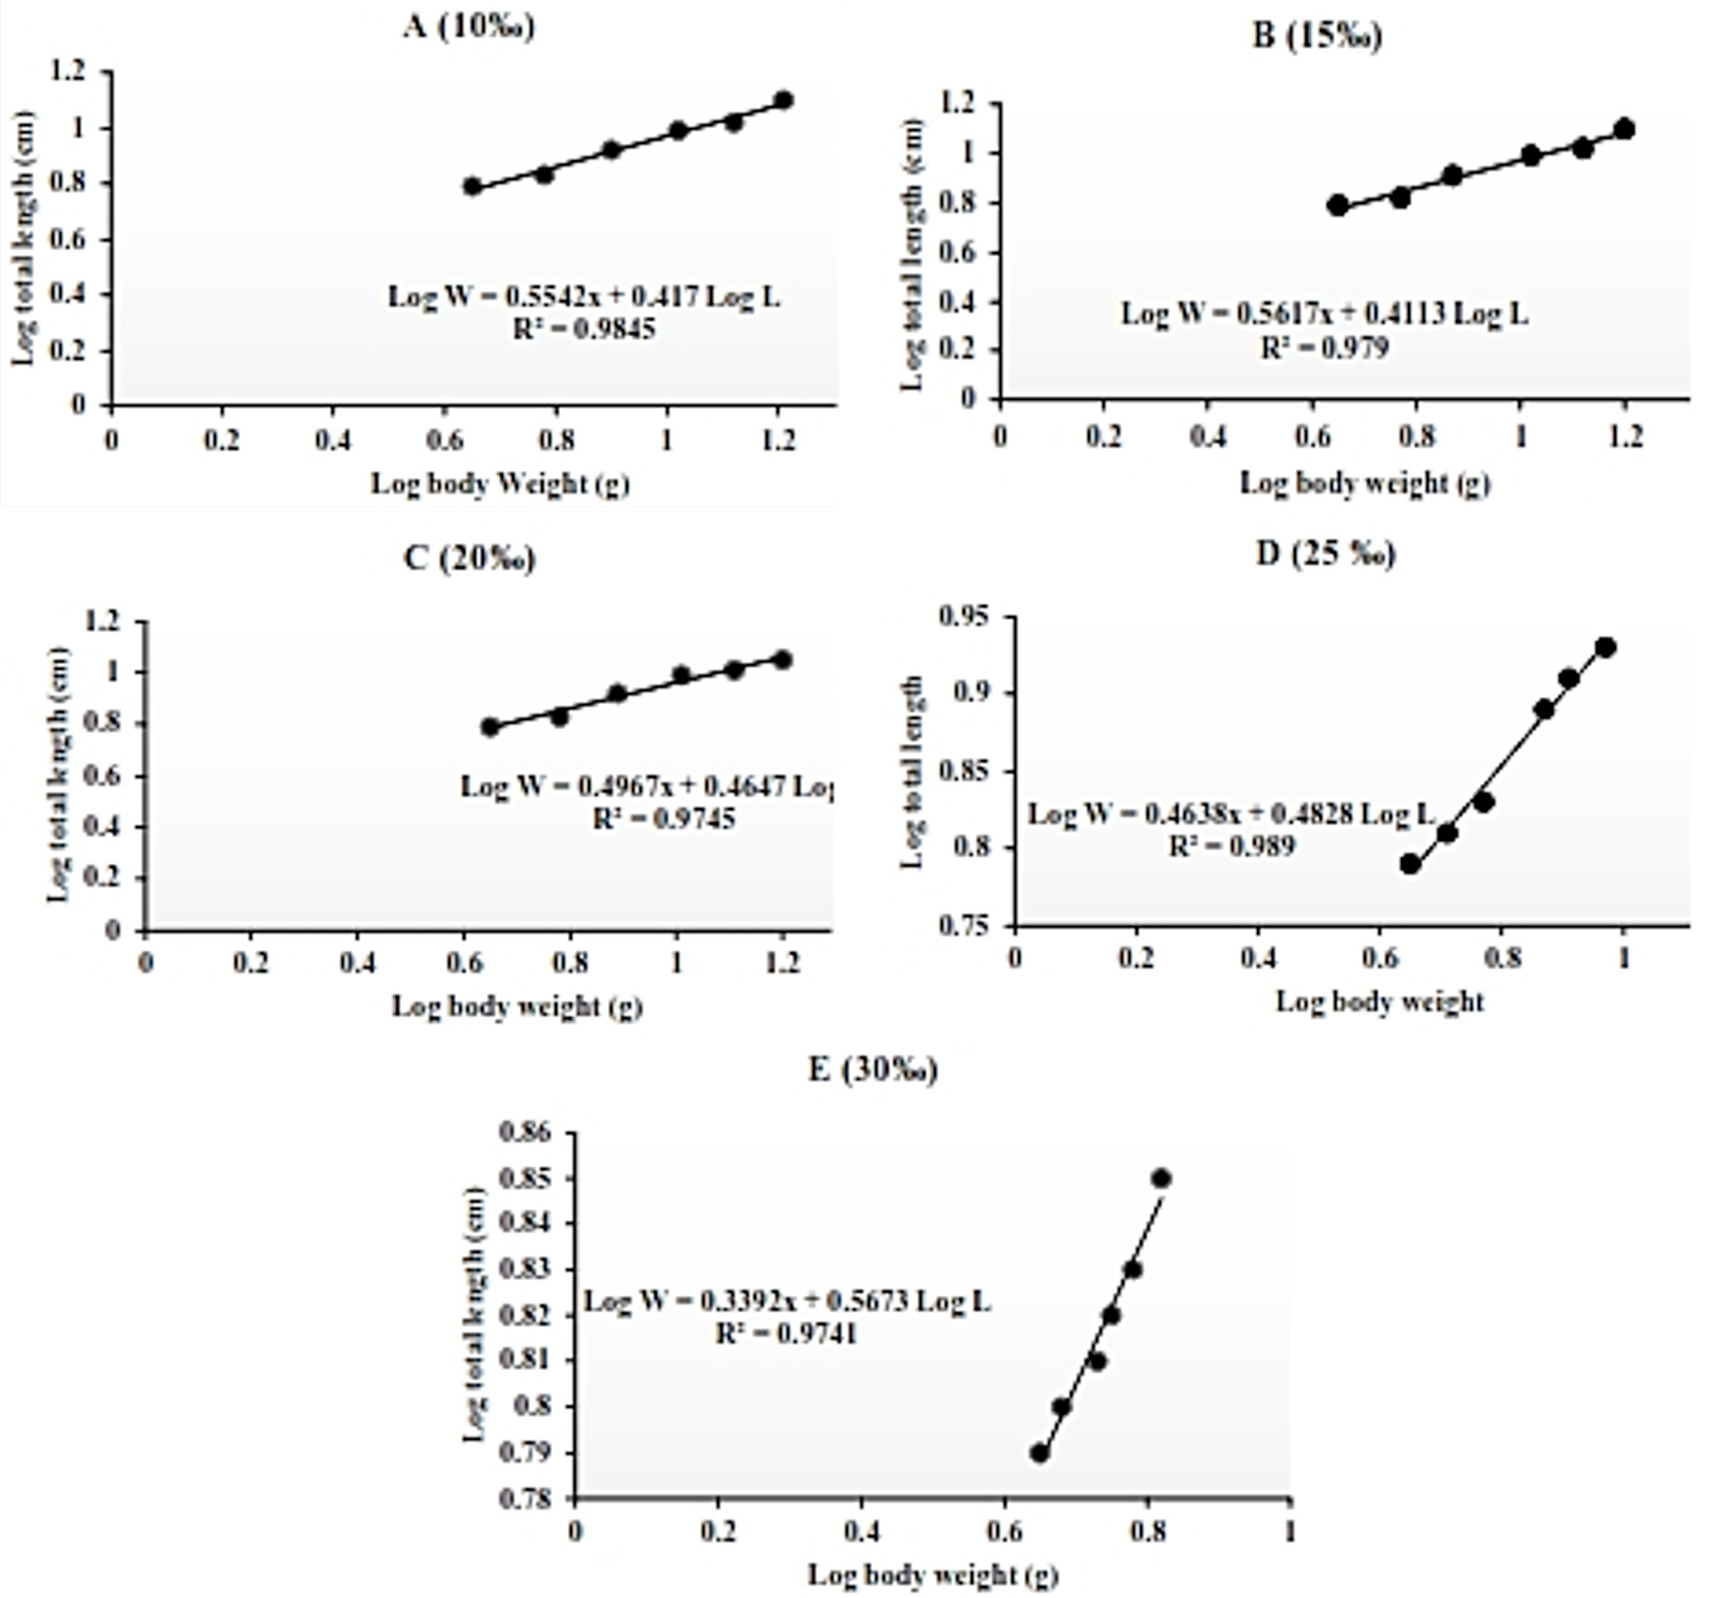
Log total length (cm) and log body weight (g) relationship of Nile tilapia (Oreochromis niloticus) fingerlings reared at different salinity levels (A-E) for 50 days.
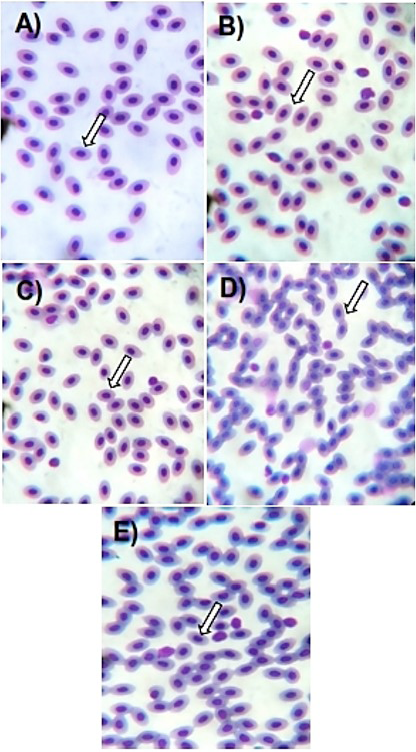
Blood smear of Nile tilapia fingerlings (Oreochromis niloticus) reared on different salinity levels (A=15‰, B=20‰, C=25‰, D=30‰, E=35‰). Arrow, micronucleus (Giemsa stained: 1000X).
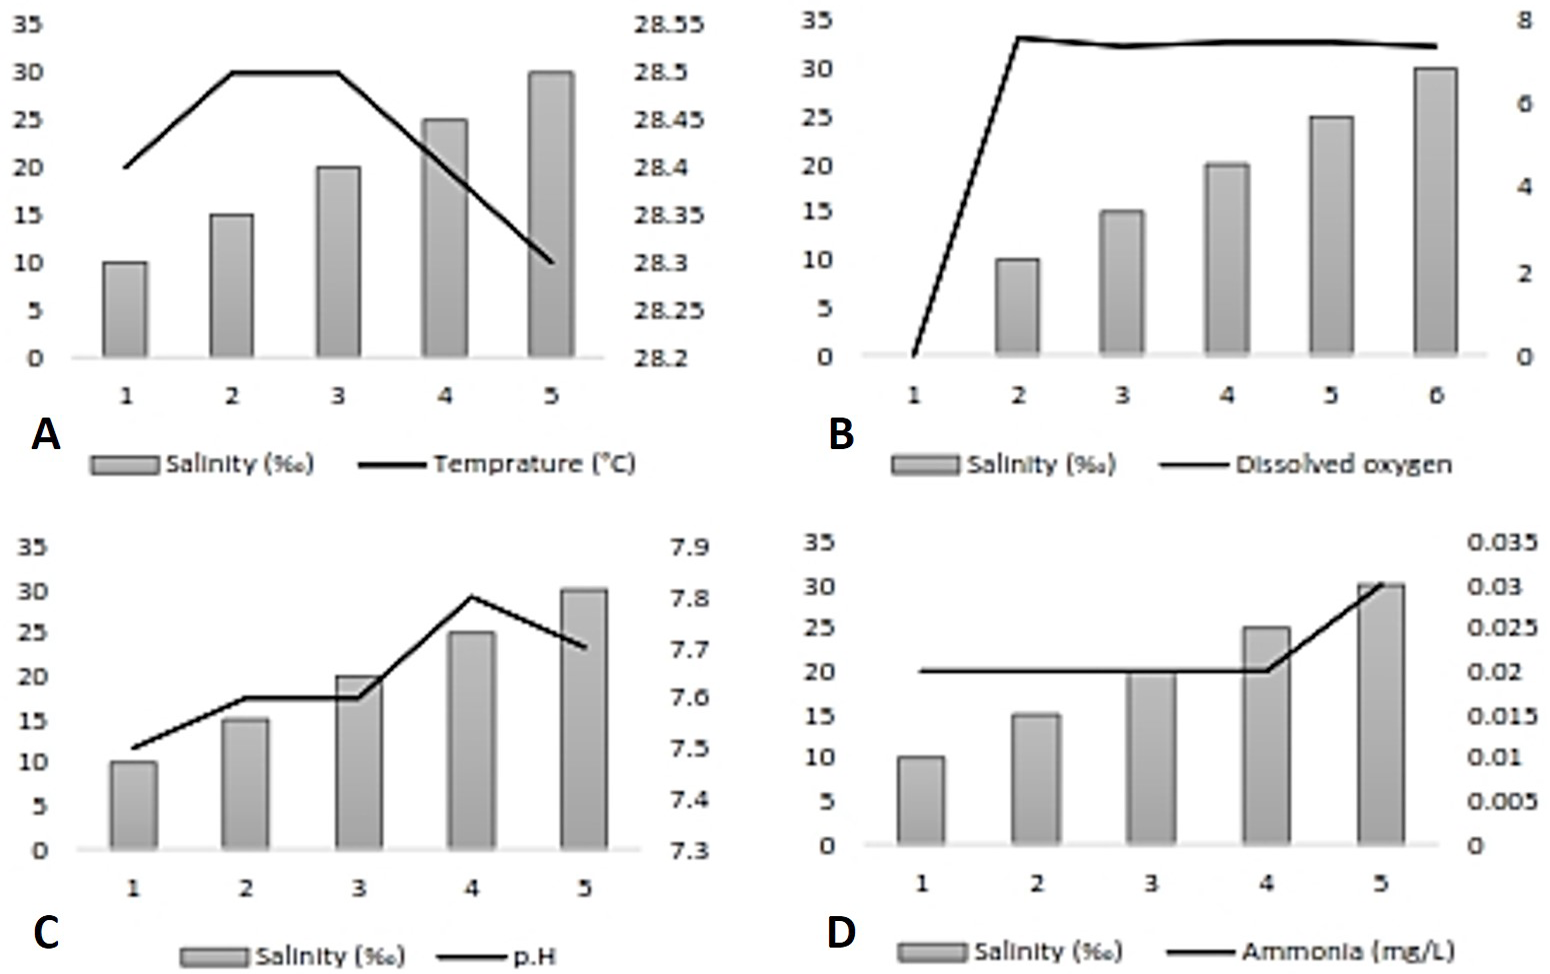
Water quality parameters: A) temperature (°C), B) dissolved oxygen, C) pH and D) ammonia of the experimental tanks.


