Assessment of Advanced Artificial Intelligence Techniques for Streamflow Forecasting in Jhelum River Basin
Assessment of Advanced Artificial Intelligence Techniques for Streamflow Forecasting in Jhelum River Basin
Muhammad Waqas1*, Muhammad Shoaib2, Muhammad Saifullah1, Adila Naseem4, Sarfraz Hashim1, Farrukh Ehsan1, Irfan Ali3 and Alamgir Khan1
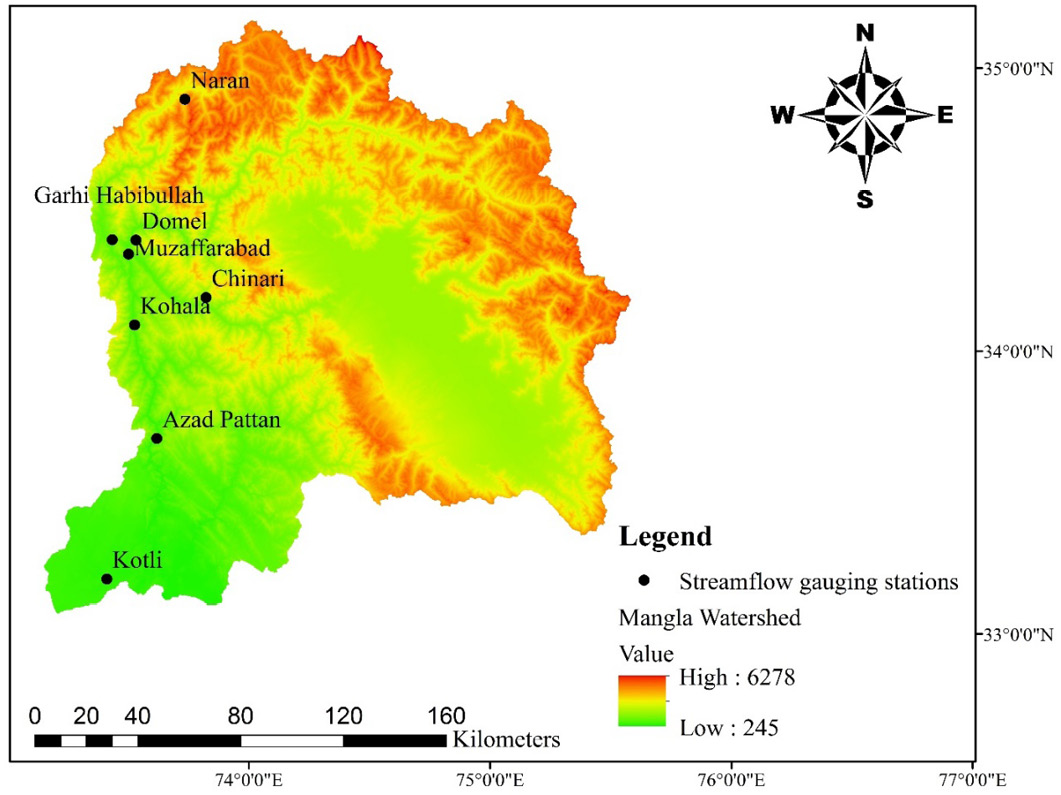
Map of Jhelum River basin, Western Himalayas.
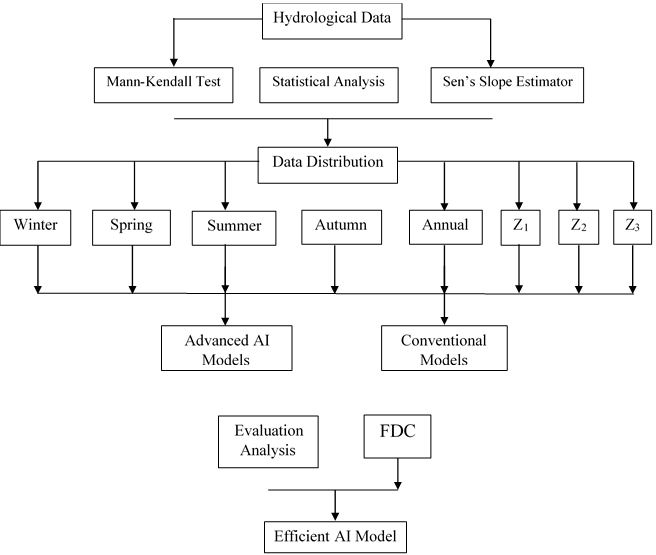
Flow chart of methodology.
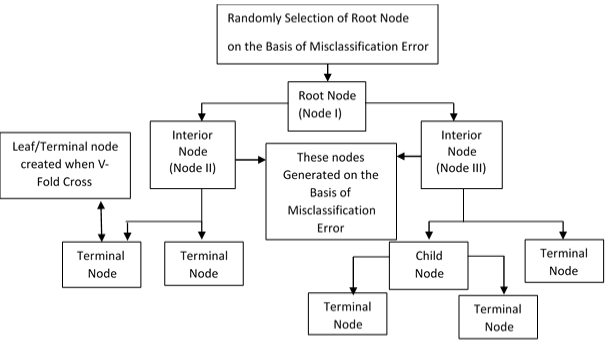
Single decision tree.
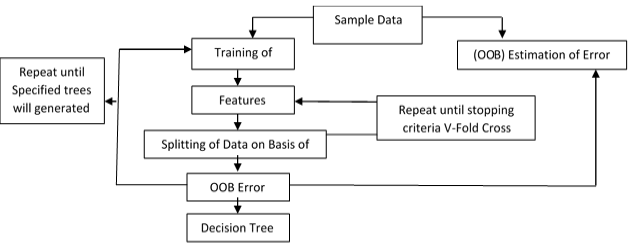
Flow chart of decision tree forest.
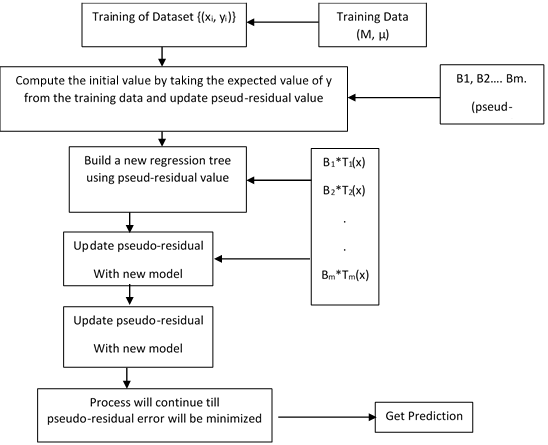
Flow chart of tree boost.
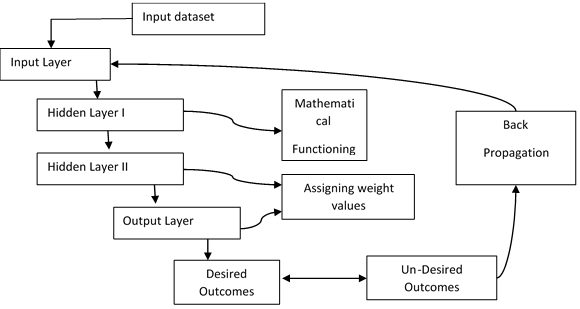
Multi-Layer Perceptron Neural Network (MLPNN).
Results of Co-efficient of determination (R2).
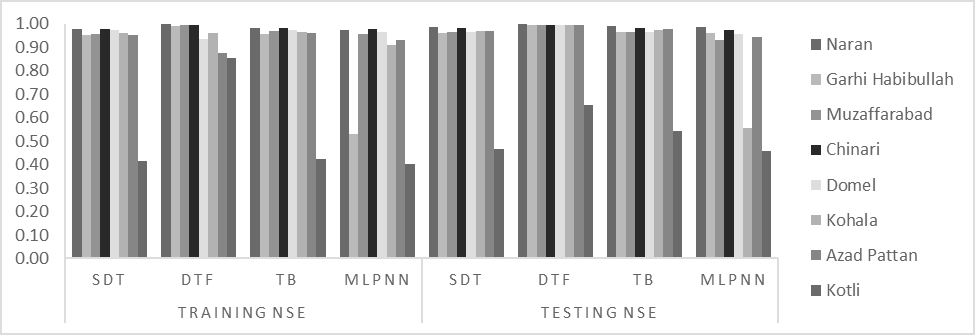
Annual Results of Nash- Sutcliff Efficiency (NSE).
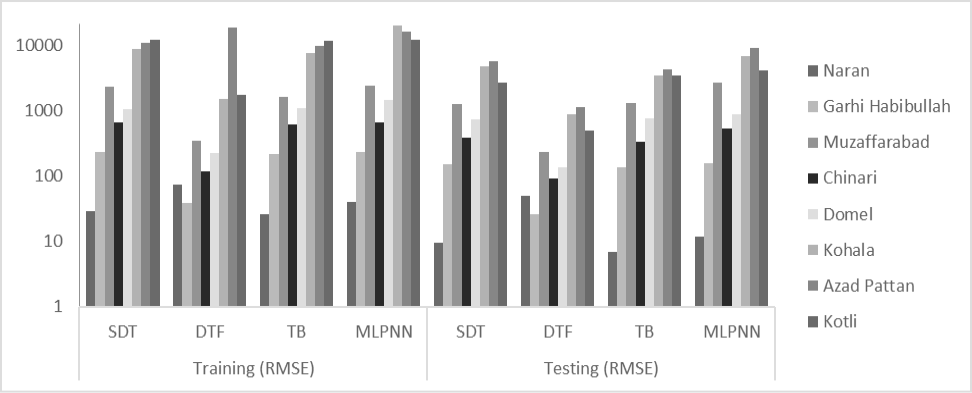
Annual Results of Root Mean Square Error (RMSE).
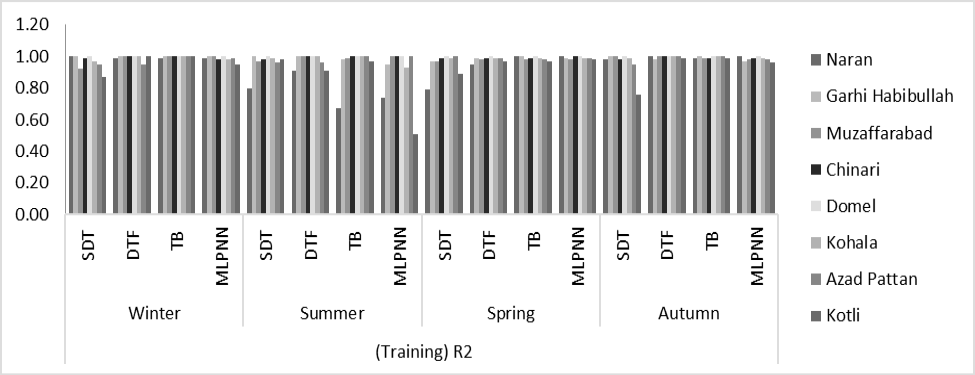
Seasonal results of coefficient of determination (R2) for training dataset.
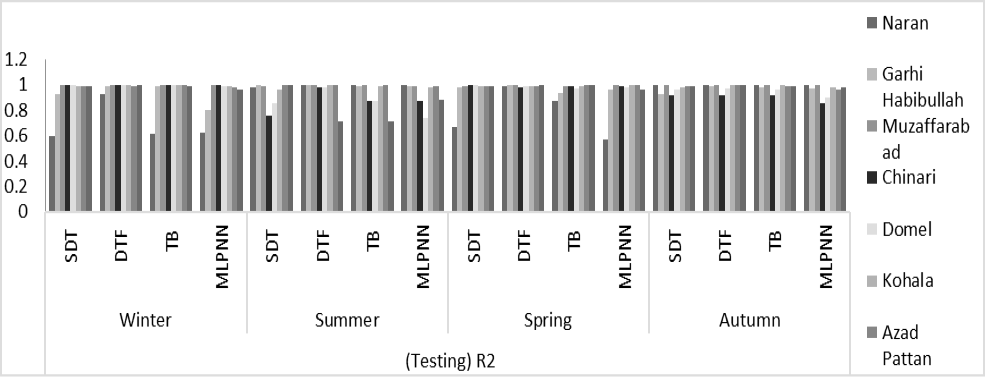
Seasonal results of coefficient of determination (R2) for testing dataset.
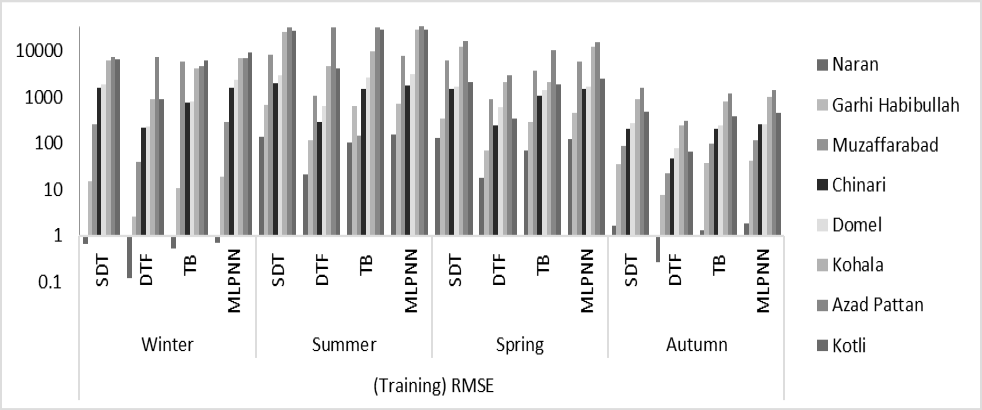
Seasonal results of root mean square error (RMSE) for training dataset.
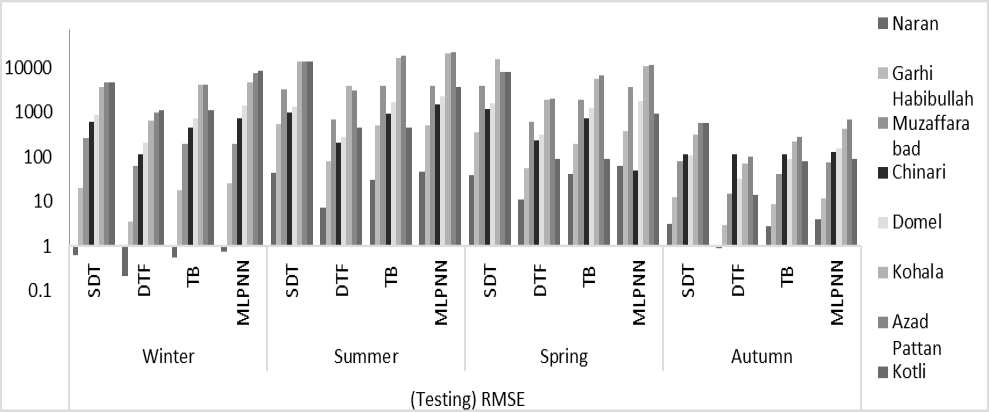
Seasonal Results of Root Mean Square Error (RMSE) for Testing dataset.
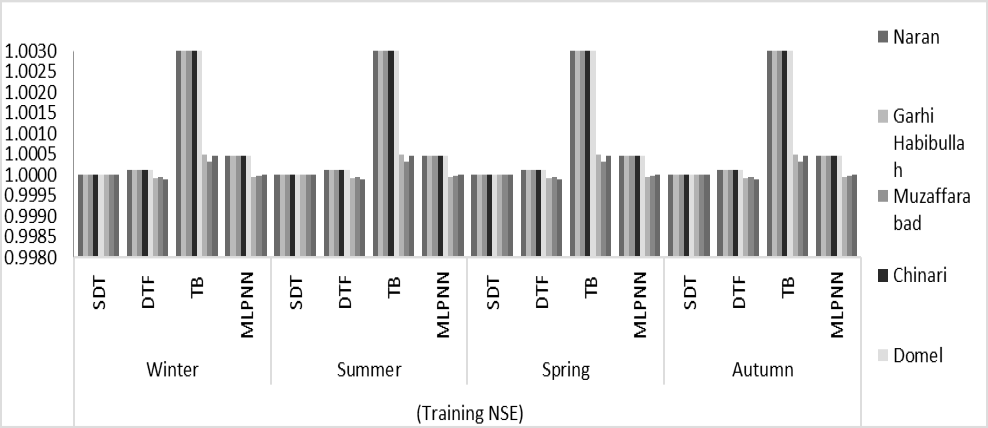
Seasonal Training Results of Nash- Sutcliff Efficiency (NSE).
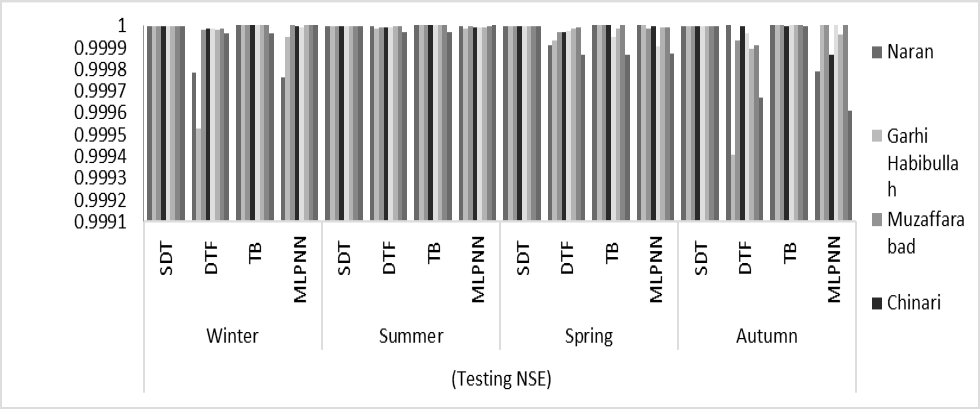
Seasonal Testing Results of Nash- Sutcliff Efficiency (NSE).
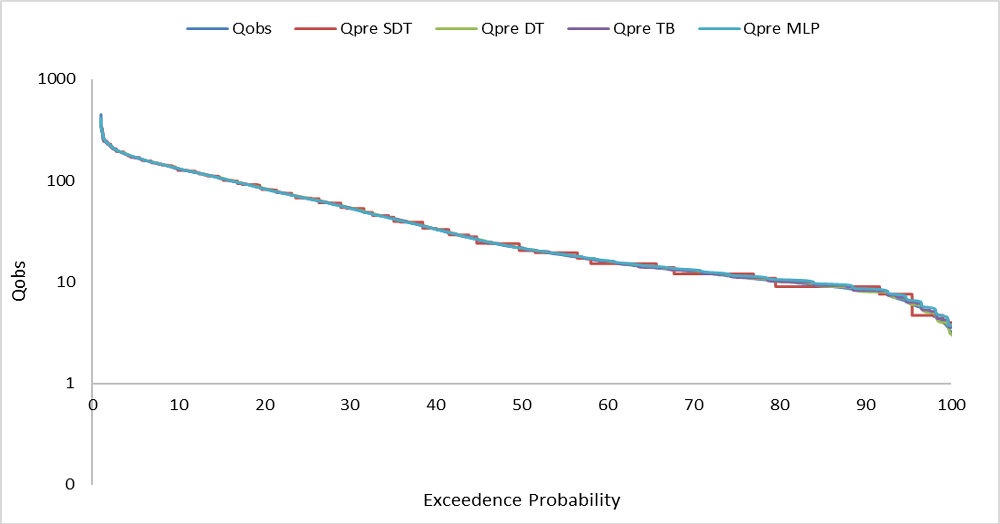
Naran Flow duration curve.


