


Research Article
Abid Khan*, Mukhtar Alam, Yousaf Jamal and Hidayat Ullah
Department of Agriculture, University of Swabi, Khyber Pakhtunkhwa, Pakistan.
Abstract | Integrated management of nitrogen sources is vital for sustaining crop productivity. Field experiments were conducted to evaluate the effect of integrated management of nitrogen sources on yield and yield components of wheat at Agricultural Research Station Buner, Khyber Pakhtunkhwa, Pakistan during 2015-16 and 2016-17. Experiments were laid out using RCBD with 3 replications. Winter wheat variety Pirsabak-2015, as a test crop, was sown on 12th November at same piece of land following same randomized layout each year. Farm Yard Manure (FYM) and Poultry Manure (PM) were used as organic while Urea as inorganic sources of nitrogen. Treatments were N1 (Control), N2 (all added N from Urea), N3 (all added N from FYM), N4 (all added N from PM), N5 (½ of added N from Urea + ½ from FYM), N6 (½ of added N from Urea + ½ from PM) and N7 (½ of added N from FYM + ½ from PM). Nitrogen @ 120 kg ha-1 was computed according to lab analysis from each combination except N1 and incorporated once after final seed bed preparation each year. Based on mean data over two consecutive years, N6 resulted significantly maximum spike length (9.8 cm), spikes m-2 (303), grains spike-1 (43.1), 1000 grain weight (34.71 g) and grain yield (3917 kg ha-1) showing an increase of 122.2% in grain yield over the control. Significant improvements in above-mentioned parameters were observed during 2016-17 as compared to 2015-16. It is concluded that integrated use of ½ of the added N from Urea and ½ from PM resulted higher performance of all investigated parameters, the efficiency of which further increased with passage of time and is recommended for improvement of wheat production.
Received | June 28, 2020; Accepted | September 4, 2020; Published | October 07, 2020
*Correspondence | Abid Khan, Department of Agriculture, UO Swabi, Khyber Pakhtunkhwa, Pakistan; Email: akbuneri@gmail.com
Citation | Khan, A., M. Alam, Y. Jamal and H. Ullah. 2020. Appraisal of yield and yield components of wheat with integrated management of nitrogen sources. Sarhad Journal of Agriculture, 36(4): 1033-1039.
DOI | http://dx.doi.org/10.17582/journal.sja/2020/36.4.1033.1039
Keywords | Integrated agriculture, Nitrogen sources, Organic manures, Wheat production, Poultry manure
Introduction
Utilization of soil resources for the purpose of agriculture and attaining sustainable agricultural system needs equal attention to physical, chemical as well as biological characteristics of soil fertility (Diacono and Montemurro, 2010). Total requirements of nutrients for sustainable crop production cannot be accomplished by a single source of crop nutrition (Korsaeth et al., 2002). Organic wastes and crop residues can be applied as soil amendments for increasing soil productivity. These organic materials are vital for growing crops and enhancing soil quality parameters (Davies and Lennartsson, 2005). Plant nutrients are removed from soil by harvesting, leaching, gaseous emissions and erosion. Poor plant nutrient replacement and continuous cropping further degrade soil quality in term of its physical, chemical and biological properties (Komatsuzaki and Ohta, 2007). Inorganic fertilizers are high-priced and poor farmers in developing countries cannot use it in recommended proportion due to their limited buying capability which resulting in meagre yield (Ahmad, 2000). Under such situations, integration of organic manures and wastes and inorganic fertilizers are vital for maintaining soil potential for crop productivity (Shafi et al., 2010). Management of organic wastes and crop residue are essential for increasing soil organic matter in case of intensive tillage and exhaustive crops cultivation (Bakht et al., 2009; Shah et al., 2010).
Recycling and returning of FYM, PM and crop residues to soil are important for increasing soil organic matter and sustainable crop production (Shafi et al., 2012). Soils applied with organic sources of plant nutrients have greater micro-fauna and high nitrogen and phosphorus contents than soils with inorganic fertilization (Herencia et al., 2007). Soil nutrients, organic matter and yield of succeeding crop were increased with carryover effects of plant nutrients from organic sources (Eghball et al., 2004). Interest in application of organic manures is increasing globally because of exhaustion of soil fertility. FYM (cow dung and feed wastes from cattle barn), PM, sheep manure and crop residues can be exploited for crop production as alternative source to chemical fertilizers which in various combination with each other had great beneficial effects on growth, development and yield (Abbas et al., 2012).
Wheat is grown in Pakistan as the main staple food item of its people. Wheat production is affected by different management strategies operated during a year (Wiatrak et al., 2006). To boost per hectare yield of wheat is utmost important as the average yield of Pakistan and especially Khyber Pakhtunkhwa is very low. Enhancement of wheat productivity depends on farm management and adoption of recent technology (Tariq et al., 2014). Use of organic manures (David et al., 2005), integrating different organic wastes and nitrogen fertilizers (Ouedraogo et al., 2006) and proper nitrogen management (Torbert et al., 2001) are attributed to increase agriculture productivity. Thus, appropriate nitrogen source (organic, inorganic or their combinations) are needed to test their effects on wheat productivity.
Objectives of the experiments
The aim of this research work was assessment of integrated utilization of various nitrogen sources for improvement of wheat productivity.
Materials and Methods
Experiments were carried out at Agricultural Research Station, Buner, Khyber Pakhtunkhwa, Pakistan during Rabi season of 2015-16 and 2016-17 consecutively for two years to appraise yield and yield components of wheat with integrated management of nitrogen sources. Figures 1, 2 and 3 respectively, displays climatic conditions like temperature and rainfall for the studies duration of the locality. Experiments were adjusted using randomized complete block design with three replications. Each experimental sub-unit was consisted of 9 m2 which accommodated 6 rows each of 5 m length with 0.30 m width between rows. Winter wheat variety Pirsabak-2015 was used in the trials. Each year sowing was done on 12th November using same piece of land following same randomized layout. Soil of the experimental site was of loam textural class. Farm Yard Manure (FYM) and Poultry Manure (PM) were used as organic while Urea as inorganic sources of nitrogen. FYM and PM were analyzed for their nutritional status using their representative samples. Phosphorus (90 kg ha-1) and potassium (60 kg ha-1) were utilized during final seed bed preparation and kept constant for each experimental sub-unit. N @ 120 kg ha-1 was computed from each of the following combinations based on their nutritional analysis except N1 and applied once after final seed bed preparation each year. All treatments were properly incorporated into the soil before sowing the seeds. Nitrogen sources were N1 (Control), N2 (all added N from Urea), N3 (all added N from FYM), N4 (all added N from PM), N5 (½ of added N from Urea + ½ from FYM), N6 (½ of added N from Urea + ½ from PM) and N7 (½ of added N from FYM + ½ from PM). All standard agronomic practices were performed throughout the crop growing period. Quantification of FYM and PM at the required rate was done according to lab analysis of the samples. Nutritional composition of FYM and PM for both years are given below.
|
Nutrients |
2015-16 |
2016-17 |
||
|
FYM |
PM |
FYM |
PM |
|
|
N |
0.64% |
2% |
0.68% |
1.9% |
|
P |
0.5% |
1.1% |
0.46% |
1.15% |
|
K |
1.5% |
3% |
1.45% |
2.8% |
Soil of the experimental site had loam texture possessing 50% sand, 40% silt and 10% clay having N (0.028%), P (8.75 mg kg-1), K (80 mg kg-1) and OM (0.4%) with pH and EC of 8.3 and 0.2 dSm-1 respectively.
Measurements and procedures of data recording
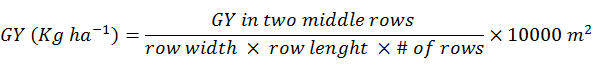
Ten spikes were randomly chosen at maturity in each sub plot, measured their lengths and afterward computed average spike length in cm. Spikes m-2 were noted at maturity stage by counting spikes in 1 m long row at two random sites in each subplot, averages were calculated and then changed to spikes m-2. For average grains spike-1, ten randomly chosen matured spikes were threshed, the grains obtained were counted and afterward converted to average grains spike-1 for each subplot. Data on 1000 grains weight were obtained at maturity by randomly taking 1000 grains from each sub unit and subsequently weighed using analytical weighing scale. To obtain data on grain yield, two middle rows were harvested, threshed and weighed and then adopted the following formula for converting to kg ha-1.
The data collected were analyzed statistically. LSD test (5% probability) was used for significant variations among treatments (Gomez and Gomez, 1983).
Results and Discussion
Spike length (cm)
Data obtained on spike length for two consecutive years as affected by integrated management of nitrogen sources are exhibited in Table 1. Utilization of different nitrogen sources had affected spike length significantly. During 2015-16, spike length fluctuated from 6.5 for N1 to 9.4 cm for N6 whereas during 2016-17, it was found in the range of 6.1 to 10.3 cm for the same treatments, respectively. Based on mean data over 2015-16 and 2016-17, lengthier spikes (9.8 cm) were achieved by integrating ½ of added N from Urea + ½ from PM (N6) as compared to other N-sources whereas shorter spikes (6.3 cm) were produced by the control treatment (N1).
Table 1: Spike length (cm) of wheat as affected by integrated management of nitrogen sources (N) over two consecutive years.
|
Nitrogen sources (N) |
2015-16 |
2016-17 |
Means |
|
Y × N |
|||
|
N1: Control |
6.5 j |
6.1 j |
6.3 e |
|
N2: 120 kg N ha-1 from Urea |
7.4 i |
8.4 fg |
7.9 d |
|
N3: 120 kg N ha-1 from FYM |
7.8 hi |
8.4 fg |
8.1 d |
|
N4: 120 kg N ha-1 from PM |
8.5 efg |
9.1 cd |
8.8 c |
|
N5: 60 kg N ha-1 from Urea + 60 kg N ha-1 from FYM |
9.0 cde |
9.8 ab |
9.4 b |
|
N6: 60 kg N ha-1 from Urea + 60 kg N ha-1 from PM |
9.4 bc |
10.3 a |
9.8 a |
|
N7: 60 kg N ha-1 from FYM + 60 kg N ha-1 from PM |
8.2 gh |
8.9 def |
8.5 c |
|
Means |
8.1 b |
8.7 a |
|
LSD Value at P≤0.05 for Years= 0.1939; N= 0.3628 and Interaction between Years and Nitrogen Sources (Y × N)= 0.5130. Means in each category having different letter(s) are significantly different using LSD test at P≤0.05.
Significant variation between years was noticed where lengthier spikes of 8.7 cm was observed during 2016-17 as compared to 8.1 cm during 2015-16. Interaction between years and nitrogen sources (Y × N) was found significant regarding spike length of wheat.
The relevant data obtained for two consecutive years as affected by integrated management of nitrogen sources are presented in Table 2. During 2015-16, spikes varied from 202 m-2 for N1 to 283 for N6 whereas during 2016-17, it was found in the range of 191 to 324 for the same treatments respectively. Based on mean data over 2015-16 and 2016-17, more wheat spikes (303 m-2) were obtained by integrating ½ of added N from Urea + ½ from PM (N6) as compared to all other N-sources used in the trial.
Table 2: Spike m-2 of wheat as affected by integrated management of nitrogen sources (N) over two consecutive years.
|
Nitrogen Sources (N) |
2015-16 |
2016-17 |
Means |
|
Y × N |
|||
|
N1: Control |
202 hi |
191 i |
196 e |
|
N2: 120 kg N ha-1 from Urea |
210 gh |
224 fg |
217 d |
|
N3: 120 kg N ha-1 from FYM |
216 fgh |
223 fg |
219 d |
|
N4: 120 kg N ha-1 from PM |
234 def |
262 c |
248 c |
|
N5: 60 kg N ha-1 from Urea + 60 kg N ha-1 from FYM |
249 cd |
284 b |
267 b |
|
N6: 60 kg N ha-1 from Urea + 60 kg N ha-1 from PM |
283 b |
324 a |
303 a |
|
N7: 60 kg N ha-1 from FYM + 60 kg N ha-1 from PM |
229 efg |
246 cde |
237 c |
|
Means |
232 b |
250 a |
|
LSD Value at P≤0.05 for Years= 7.4662; N= 13.968 and Interaction between Years and Nitrogen Sources (Y × N)= 19.954. Means in each category having different letter(s) are significantly different using LSD test at P≤0.05
Significant variation between years was noticed regarding number of wheat spikes m-2. Maximum spikes (250 m-2) was noticed during 2016-17 as compared to 232 m-2 during 2015-16. Interactive response between Y and N (Y × N) was found significant regarding spikes m-2.
Data recorded on this parameter for two consecutive years as affected by integrated management of nitrogen sources are shown in Table 3. Utilizing different nitrogen sources during 2015-16, grains spike-1 fluctuated from 19.3 for N1 to 40.7 for N6 whereas during 2016-17, it was in the range of 16.8 to 45.5 for the same treatments, respectively. Adding N6 for two consecutive year exhibited 11.79% proliferation in grains per spike over the previous year. Based on mean data over 2015-16 and 2016-17, higher grains spike-1 (43.1) were noted by integrating ½ of added N from urea + ½ from PM (N6) as compared to other N-sources used in the trial, while minimum (18) by the control treatment.
Table 3: Grains spike-1 of wheat as affected by integrated management of nitrogen sources (N) over two consecutive years.
|
Nitrogen sources (N) |
2015-16 |
2016-17 |
Means |
|
Y × N |
|||
|
N1: Control |
19.3 h |
16.8 h |
18.0 f |
|
N2: 120 kg N ha-1 from Urea |
25.5 g |
32.1 de |
28.8 e |
|
N3: 120 kg N ha-1 from FYM |
27.6 fg |
36.1 c |
31.8 d |
|
N4: 120 kg N ha-1 from PM |
32.7 d |
39.3 bc |
36.0 c |
|
N5: 60 kg N ha-1 from Urea + 60 kg N ha-1 from FYM |
37.3 c |
41.6 b |
39.5 b |
|
N6: 60 kg N ha-1 from Urea + 60 kg N ha-1 from PM |
40.7 b |
45.5 a |
43.1 a |
|
N7: 60 kg N ha-1 from FYM + 60 kg N ha-1 from PM |
29.0 ef |
37.2 c |
33.1 d |
|
Means |
30.3 b |
35.5 a |
|
LSD Value at P≤0.05 for years= 1.2421; N= 2.3238 and Interaction between Years and Nitrogen Sources (Y × N) = 3.2864. Means in each category having different letter(s) are significantly different using LSD test at P≤0.05
Significant variation between years was observed where 35.5 grains per spike was noted during 2016-17 and 30.3 during 2015-16. Interactive response between Y and N (Y × N) was also found significant.
Thousand grain weight (g)
Relevant data recorded for two consecutive years as affected by integrated management of nitrogen sources are displayed in Table 4. During 2015-16, thousand grain weight fluctuated from 17.33 g for N1 to 32.62 g for N6 while for the same treatments during 2016-17, it was in the range of 15.59 to 36.79 g, respectively. Based on mean data over two years, heavier (34.71 g) thousand grains were attained by integrating ½ of added N from Urea + ½ from PM (N6).
Significant variation between years was noted regarding thousand grain weight of wheat. It significantly increased from 24.75 g during 2015-16 to 29.09 g during 2016-17 showing an enhancement of 17.54% over 2015-16. Y × N was also found significant for it.
Table 4: Thousand grain weight (g) of wheat as affected by integrated management of nitrogen sources (N) over two consecutive years.
|
Nitrogen sources (N) |
2015-16 |
2016-17 |
Means |
|
Y × N |
|||
|
N1: Control |
17.33 i |
15.59 i |
16.46 f |
|
N2: 120 kg N ha-1 from Urea |
20.60 h |
26.35 ef |
23.47 e |
|
N3: 120 kg N ha-1 from FYM |
22.18 gh |
28.87 de |
25.52 d |
|
N4: 120 kg N ha-1 from PM |
26.32 ef |
31.68 bcd |
29.00 c |
|
N5: 60 kg N ha-1 from Urea + 60 kg N ha-1 from FYM |
30.02 cd |
33.76 b |
31.89 b |
|
N6: 60 kg N ha-1 from Urea + 60 kg N ha-1 from PM |
32.62 bc |
36.79 a |
34.71 a |
|
N7: 60 kg N ha-1 from FYM + 60 kg N ha-1 from PM |
24.18 fg |
30.60 cd |
27.39 cd |
|
Means |
24.75 b |
29.09 a |
|
LSD Value at P≤0.05 for Years= 1.0747; N= 2.0106 and Interaction between Years and Nitrogen Sources (Y × N)= 2.8435. Means in each category having different letter(s) are significantly different using LSD test at P≤0.05.
Table 5: Grain yield (kg ha-1) of wheat as affected by integrated management of nitrogen sources (N) over two consecutive years.
|
Nitrogen sources (N) |
2015-16 |
2016-17 |
Means |
|
Y × N |
|||
|
N1: Control |
1837 g |
1689 g |
1763 f |
|
N2: 120 kg N ha-1 from Urea |
2351 f |
2912 d |
2631 e |
|
N3: 120 kg N ha-1 from FYM |
2459 ef |
3240 c |
2849 d |
|
N4: 120 kg N ha-1 from PM |
2922 d |
3501 bc |
3212 c |
|
N5: 60 kg N ha-1 from Urea + 60 kg N ha-1 from FYM |
3338 c |
3726 b |
3532 b |
|
N6: 60 kg N ha-1 from Urea + 60 kg N ha-1 from PM |
3709 b |
4125 a |
3917 a |
|
N7: 60 kg N ha-1 from FYM + 60 kg N ha-1 from PM |
2689 de |
3370 c |
3030 cd |
|
Means |
2758 b |
3223 a |
|
LSD Value at P≤0.05 for Years= 110.94, N= 207.56 and Interaction between Years and Nitrogen Sources (Y × N)= 293.53. Means in each category having different letter(s) are significantly different using LSD test at P≤0.05.
Data recorded on grain yield for two consecutive years as affected by integrated management of nitrogen sources are displayed in Table 5. Using different nitrogen sources during 2015-16, it varied from 1837 for N1 to 3709 kg ha-1 for N6 while grain yield for the same treatments during 2016-17 varied from 1689 for N1 to 4125 kg ha-1 for N6. Based on pooled data over two consecutive years more grain yield of 3917 kg ha-1 was attained by integrating ½ of added N from Urea and ½ from PM (N6) when compared with other N-sources used during the trial.
Significant variation between years was noted as higher grain yield (3223 kg ha-1) was noted during 2016-17 and lower (2758 kg ha-1) during 2015-16. Interactive response of Y × N was also found significant.
Longer spike, more spike m-2, more grains per spike, heaver grains and ultimately higher grain yield were attained by treatments receiving half of added N from Urea and half from PM in comparison with other nitrogen sources and control which may be ascribed to better harmonization of nutrient release and uptake by crops because of integration of different sources of nitrogen (Mugwe et al., 2009). Our findings are in line with Abbasi and Tahir (2012) who stated that integration of N-fertilizer with organic manures such as PM is an effective management approach for crop production on sustained basis. Their results revealed that combined use of Urea with PM increased N uptake and nitrogen use efficiency when compared with Urea alone. These findings are consistent with Ahmad et al. (2007) who disclosed that different type of organic wastes had variable impact on various characteristics of soil and nutrient supply to crops. Better yield of wheat might be due to greater N-mineralization from combined treatments of Urea and PM than the individual application of PM and Urea (Abbasi and Khaliq, 2016). Better wheat yield and its components during 2016-17 would likely be due to the carry-over effect as organic manures application developed soil physical healthiness, nutrient availability and yield over time (Yaduvanshi, 2003).
Conclusions and Recommendations
Results obtained from current experiments revealed distinctive benefits of combined incorporation of organic and inorganic nitrogen sources in soil. It was concluded that half of added N from Urea and half from PM resulted higher yield of wheat where it further increased with passage of time. Therefore, it is recommended to apply the required nitrogen as half from Urea and half from PM (N6) continuously for increasing wheat production.
Novelty Statement
This research work has focused on integrated utilization of organic and inorganic nitrogen sources for increasing wheat productivity. Yield and yield components of wheat distinctively increased with incorporating the required nitrogen as half from urea and half from poultry manure. It will enable the farmers to efficiently utilize their organic sources of plant nutrients for enhancing crop productivity and ensuring food security.
Author’s Contribution
Abid Khan conducted the experiment for his Ph. D. thesis and worked on data collection, analysis, tabulation and compilation with draft preparation of the manuscript. Mukhtar Alam, Yousaf Jamal and Hidayat Ullah proposed the idea, designed and supervised the research work as well as made correction in the manuscript.
Conflict of interest
The authors have declared no conflict of interest.
References
Abbas, G., J.Z.K. Khattak, A. Mir, M. Ishaque, M. Hussain, H.M. Wahedi, M.S. Ahmed and A. Ullah. 2012. Effect of organic manures with recommended dose of NPK on the performance of wheat (Triticum aestivum L.). J. Anim. Plant Sci., 22(3): 683-687.
Abbasi, M.K. and A. Khaliq. 2016. Nitrogen mineralization of a loam soil supplemented with organic–inorganic amendments under laboratory incubation. Front. Plant Sci., 7: 10-38. https://doi.org/10.3389/fpls.2016.01038
Abbasi, M.K. and M.M. Tahir. 2012. Economizing nitrogen fertilizer in wheat through combinations with organic manures in Kashmir, Pakistan. Agron. J., 104(1): 169-177. https://doi.org/10.2134/agronj2011.0264
Ahmad, N., 2000. Fertilizer scenario in Pakistan: Policies and development. In proceedings of conference on agricultural and fertilizer use. Islamabad: NFDC P and D Division, Government of Pakistan.
Ahmad, R., S.M. Shehzad, A. Khalid, M. Arshad and M.H. Mahmood. 2007. Growth and yield response of wheat (Triticum aestivum L.) and maize (Zea mays L.) to nitrogen and L-tryptophan enriched compost. Pak. J. Bot., 39: 541–549.
Bakht, J., M. Shafi, M.T. Jan and Z. Shah. 2009. Influence of crop residue management, cropping system, and N fertilizer on soil N and C dynamics and sustainable wheat production. Soil Tillage Res., 104: 233–240. https://doi.org/10.1016/j.still.2009.02.006
David, C., M.H. Jeuffroy, F. Laurent, M. Mangin and J.M. Meynard. 2005. The assessment of AZODYN-ORG model for managing nitrogen fertilization of organic winter wheat. Eur. J. Agron., 2: 225-242. https://doi.org/10.1016/j.eja.2004.08.002
Davies, G. and M. Lennartsson. 2005. Organic vegetable production. A complete guide, Henry Doubleday Research Association, The Crowood Press Ldt., ISBN 1 86126 788 6.
Diacono, M. and F. Montemurro. 2010. Long-term effects of organic amendments on soil fertility. A review. Agron. Sustain. Dev., 30: 401–422. https://doi.org/10.1051/agro/2009040
Eghball, B., D. Ginting and J.E. Gilley. 2004. Residual effects of manure and compost applications on corn production and soil properties. Agron. J., 9: 442–447. https://doi.org/10.2134/agronj2004.4420
Gomez, K.A. and A.A., Gomez. 1983. Statistical procedures for agricultural research. 2nd Ed. Int. Rice Res. Inst. Book. Inc., pp. 316-356.
Herencia, J.F., J.C. Ruiz-Porras, S. Melero, P.A. Garcia-Galavis, E. Morrillo and C. Maqueda. 2007. Comparison between organic and mineral fertilization for soil fertility levels, crop macronutrient concentrations, and yield. Agron. J., 99: 973–983. https://doi.org/10.2134/agronj2006.0168
Komatsuzaki, M. and H. Ohta. 2007. Soil management practices for sustainable agro-ecosystems. Sustain. Sci., 2: 103–120. https://doi.org/10.1007/s11625-006-0014-5
Korsaeth, A., T.M. Henriksen and L.R. Bakken. 2002. Temporal changes in mineralization and immobilization of N during degradation of plant material. Implications for the plant N supply and nitrogen losses. Soil Biol. Biochem., 34: 789-799. https://doi.org/10.1016/S0038-0717(02)00008-1
Mugwe, J.N., D. Mugendi, J. Kungu and M.M. Muna. 2009. Maize yields response to application of organic and inorganic input under on-station and on-farm experiments in central Kenya. Exp. Agric., 45: 47–59. https://doi.org/10.1017/S0014479708007084
Ouedraogo, E., A. Mando and L. Stroosnijder. 2006. Effects of tillage, organic resources and nitrogen fertilizer on soil carbon dynamics and crop nitrogen uptake in semi-arid West Africa. Soil Tillage Res., 91: 57-67. https://doi.org/10.1016/j.still.2005.11.004
Shafi, M., J. Bakht, Attaullah and M.A. Khan. 2010. Effect of crop sequence and crop residues on soil C, soil N, and yield of maize. Pak. J. Bot., 42(3): 1651–1664.
Shafi, M., S.S. Azam, J. Bakht, S.M. Mahmood, W. Mohammad, M. Sharif and M.A. Aman. 2012. Enhancing soil fertility and wheat productivity through integrated nitrogen management. Commun. Soil Sci. Plant Anal., 43(11): 1499-1511. https://doi.org/10.1080/00103624.2012.675386
Shah, S.A., M. Shafi, J. Bakht, M.T. Jan, M.J. Khan, M. Wisal, S.M. Shah, Raziuddin and Z. Shah. 2010. Effect of integrated use of nitrogen on yield and N uptake of maize crop. Pak. J. Bot., 42(5): 3633–3638.
Tariq, A., T. Nazia, B. Khuda, M. Ashfaq and H. Sarfraz. 2014. Food security in the context of climate change in Pakistan. Pak. J. Commer. Soc. Sci., 8(2): 540-550.
Torbert, H.A., K.N. Potter and J.E. Jr. Morrison. 2001. Tillage system, fertilizer nitrogen rate and timing effect on corn yields in the Texas Blackland Prairie. Agron. J., 93: 1119-1124. https://doi.org/10.2134/agronj2001.9351119x
Wiatrak, P.J., D.L. Wright and J.J. Marois. 2006. The impact of tillage and residual nitrogen on wheat. Soil Tillage Res., 91: 150-156. https://doi.org/10.1016/j.still.2005.11.015
Yaduvanshi, N.P.S., 2003. Substitution of inorganic fertilizers by organic manures and the effect on soil fertility in a rice wheat rotation on reclaimed sodic soil in India. J. Agric. Sci., 140(2): 161-168. https://doi.org/10.1017/S0021859603002934
To share on other social networks, click on any share button. What are these?


