

Application of Regression Tree Method for Different Data from Animal Science


Application of Regression Tree Method for Different Data from Animal Science
Yusuf Koc1, Ecevit Eyduran1* and Omer Akbulut2
1Department of Animal Science, Agricultural Faculty, Igdir University, Igdir, Turkey
2Department of Actuarial Science, Faculty of Science, Ataturk University, Erzurum, Turkey
ABSTRACT
The aim of this study was to evaluate predictive performances of CHAID, Exhaustive CHAID, and CART regression tree methods for different combinations of parent node: child node in the data set regarding animal science. To achieve the aim, 1884 Mengali lambs were provided for predicting weaning weight from sex (male and female), birth type (single and twin), birth year (2005, 2006, 2007, 2008 and 2009), farm (Research station, Mastung, Quetta, and Noshki), birth weight, dam age, and dam weight. To choice the best regression tree method, goodness of fit criteria such as coefficient of determination (R2%), adjusted coefficient of determination (Adj-R2%), coefficient of variation (%), SD ratio, relative approximation error (RAE), Root Mean Square Error (RMSE), Pearson correlation between actual and predicted weaning weights were estimated for each combination. It was determined that CHAID algorithm constructed more suitable tree structures, biologically in comparison to Exhaustive CHAID and CART data mining algorithms. Consequently, it is recommended that the biological suitability of the constructed tree structure should be taken account together with estimating model quality criteria.
Article Information
Received 27 July 2016
Revised 10 August 2016
Accepted 09 September 2016
Available online 25 March 2017
Authors’ Contributions
The article is summarized from the first author’s (YK) MSc Thesis. EE and OA interpreted the data, drafted and carefully revised the manuscript. All authors read and approved the final manuscript.
Key words
CART, CHAID, Exhaustive CHAID, Regression tree, Data Mining, Weaning weight
DOI: http://dx.doi.org/10.17582/journal.pjz/2017.49.2.599.607
* Corresponding author: ecevit.eyduran@gmail.com
0030-9923/2017/0002-0599 $ 9.00/0
Copyright 2017 Zoological Society of Pakistan
INTRODUCTION
In animal breeding, it is very prominent to survey the interrelationship between body morphological characteristics and yield characteristics viz. meat, milk and egg. On the other hand, it is essential to ascertain the effect of non-genetic factors affecting the examined yield characteristics, and in the scope of indirect selection, it is notable to exhibit causal relationship between economic yield characteristics and their related quantitative characteristics. Several examples for the causal relationship are the prediction of body weight from body and testicular characteristics, and the prediction of milk yield from udder traits, and the prediction of the spermatological traits from testicular traits, and so on. The main objective in the relational mechanism is to gain better offspring from parent generation in yield traits.
In animal science, the causal relationships can be revealed by several statistical approaches, simple linear regression analysis, multiple linear regression analysis, use of factor analysis scores in multiple regression analysis, use of principal component analysis scores in multiple regression analysis, Path Analysis and Regression Tree Analysis (Khan et al., 2014). However, general linear models have been widely used in the identification of significant factors on yield traits (Eyduran et al., 2008).
Regression tree analysis, one of the analysis methods for evaluating animal data, is thought as an alternative to the above mentioned methods (Eyduran et al., 2008) and it is a non-parametric analysis method partitioning the population into relationships among independent variables playing major role for homogenous subsets and identifying curve linear and interaction in the explanation of the variability in yield trait, a dependent variable (Kayri and Boysan, 2008). The preferability of the decision tree method is due to having more advantageous in multicollinearity, outliers and missing data without needing any assumption on the distribution of independent variables (Mendeş and Akkartal, 2009).
In the construction of the decision or regression tree diagram, CART, CHAID and Exhaustive CHAID algorithms are non-parametric techniques applied for performing the statistical analysis of nominal, ordinal and scale (continuous) variables (Ali et al., 2015). When the dependent variable is scale, the constructed tree is called regression tree, otherwise classification tree (Camdeviren et al., 2005). Regression tree analysis based on the algorithms is employable instead of multiple linear regression, ridge regression, use of factor analysis scores or principal component analysis scores in multiple linear regression analysis. The classification tree analysis on the basis of the algorithms is a good alternative to logistic regression analysis and discriminant analysis.
Regression tree analysis on the basis of some data mining algorithms, C4.5, CART, CHAID, and Exhaustive CHAID is a non-parametric method used mostly in medicinal, engineering and industrial fields. However, although its applications in animal science are increasing with each passing time (Dogan, 2003; Grzesiak et al., 2003; Eyduran et al., 2008; Mendes and Akkartal, 2009; Bakir et al., 2009, 2010; Topal et al., 2010; Yakubu, 2012; Grzesiak and Zaborski, 2012; Çak et al., 2013; Eyduran et al., 2013a, b, c; Yilmaz et al., 2013; Orhan et al., 2016), a satisfying stress on using goodness of fit criteria was rare in measuring predictive performance of the algorithms. Besides, there is very limited number of the studies on comparatively testing the data mining algorithms; playing a key role in future selection studies (Ali et al., 2015). But, the effect of various parent and child nodes on the predictive performance of the data mining algorithms has not been investigated, so far by taking a basis for goodness of fit criteria. With these reasons, the aim of this study was to evaluate predictive performances of CHAID, Exhaustive CHAID, and CART regression tree methods for different combinations of parent node: child node in the data set regarding animal science.
MATERIALS AND METHODS
Animal material
With the intention of comparatively surveying in CHAID, Exhaustive CHAID and CART data mining algorithms, the data on 1884 indigenous Mengali sheep (936 males and 948 females) reared at four different farms in Pakistan were used. The input (independent) variables in the data were sex (male and female), birth type (single and twin), lambing year (2005, 2006, 2007, 2008 and 2009), farm (Research Station, Mastung, Quetta and Noshki), dam age (20 to 78 months) and dam weight (25 to 48 kg), respectively in the prediction of weaning weight, a dependent (output) variable. In order to determine the effect of applying different number of animals in parent child nodes on the prediction performance, twenty six combinations from 500:250 to 10:5 were measured in the predictive ability of the algorithms, CART, CHAID and Exhaustive CHAID.
Method
The structure of independent variables can be nominal, ordinal and scale in regression tree method (Mendes and Akkartal, 2009). As in the present study, regression tree method with the specification of the CHAID, Exhaustive CHAID and CART data mining algorithms are the convenient method that informs about the relationship between each of quantitative traits (such as body weight, milk yield and fleece weight) and nominal, ordinal and scale variables more than one. The trees constructed for dependent variable taking limited values is called classification trees, otherwise the trees obtained by the outcome variable taking unlimited values are called regression trees.
Recursively, CART (Classification and Regression Tree) creates a binary regression tree dividing a subset into 2 small subsets by the time homogenous subsets are attained in the tree, but CHAID algorithms create a regression tree that establishes recursively multi-splits until reaching up to maximum variance among subsets in the tree structure (Ali et al., 2015; Akin et al., 2016). Risk estimate is expressed as the variance within subsets in the regression tree construction.
Regression tree depths were adopted for the valued algorithms, CART (5) and CHAIDs (3). Examine the paper of Ali et al. (2015) for reaching more information concerning the algorithms.
Formulas of the goodness of fit (GOF) criteria measured for comparing predictive performance of the algorithms are below (Grzesiak and Zaborski, 2012):
Coefficient of Determination

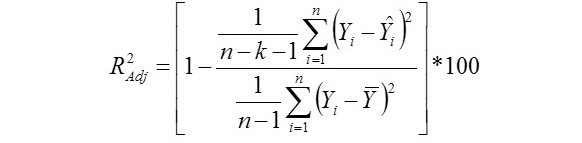
Adjusted Coefficient of Determination
Standard Deviation Ratio

Relative Approximation Error (RAE)

Root Mean Square Error

Coefficient of Variation (%)
 Where,
Yi, the actual or observed weaning weight (kg) of ith lamb; Ŷi, the predicted weaning weight value of ith lamb; Ȳ, average of the actual weaning weight values of the Mengali lambs; Ɛi, the residual value of ith lamb; Ɛi average of the residual values; k, number of significant independent variables in the model; and n, total lamb number. The residual value of each lamb is expressed as Ɛi= Yi - Ŷi.
The Pearson correlation coefficients between the observed and predicted weaning weight values were estimated by using each of the algorithms. The most predictive algorithm estimates the highest values in r, R2, R2Adj and the lowest values in CV(%), SDRATIO, RAE, and RMSE, respectively (Ali et al., 2015). The regression trees were constructed by using IBM SPSS 23 software SPSS Inc., 2015. We followed the command order,
Table I.- Goodness of fit criteria for CHAID algorithm.
| Parent node | Child node | RE |
R2 (%) |
RAE | RMSE | SDratio | r |
R2adj. (%) |
CV (%) |
| 500 | 250 | 0.992 | 50.176 | 0.249 | 0.996 | 0.706 | 0.708 | 50.128 | 6.222 |
| 480 | 240 | 0.992 | 50.176 | 0.249 | 0.996 | 0.706 | 0.708 | 50.128 | 6.222 |
| 460 | 230 | 0.992 | 50.176 | 0.249 | 0.996 | 0.706 | 0.708 | 50.128 | 6.222 |
| 440 | 220 | 0.992 | 50.176 | 0.249 | 0.996 | 0.706 | 0.708 | 50.128 | 6.222 |
| 420 | 210 | 0.992 | 50.176 | 0.249 | 0.996 | 0.706 | 0.708 | 50.128 | 6.222 |
| 400 | 200 | 0.992 | 50.176 | 0.249 | 0.996 | 0.706 | 0.708 | 50.128 | 6.222 |
| 380 | 190 | 0.992 | 50.176 | 0.249 | 0.996 | 0.706 | 0.708 | 50.128 | 6.222 |
| 360 | 180 | 0.951 | 52.235 | 0.249 | 0.996 | 0.706 | 0.708 | 50.102 | 6.222 |
| 340 | 170 | 0.976 | 52.979 | 0.244 | 0.975 | 0.691 | 0.723 | 52.184 | 6.092 |
| 320 | 160 | 0.966 | 51.482 | 0.246 | 0.983 | 0.697 | 0.717 | 51.429 | 6.140 |
| 300 | 150 | 0.955 | 52.034 | 0.244 | 0.977 | 0.693 | 0.721 | 51.981 | 6.105 |
| 280 | 140 | 0.955 | 52.034 | 0.244 | 0.977 | 0.693 | 0.721 | 51.955 | 6.105 |
| 260 | 130 | 0.953 | 52.135 | 0.244 | 0.976 | 0.692 | 0.722 | 52.071 | 6.098 |
| 240 | 120 | 0.926 | 53.491 | 0.240 | 0.962 | 0.682 | 0.731 | 53.368 | 6.011 |
| 220 | 110 | 0.926 | 53.491 | 0.240 | 0.962 | 0.682 | 0.731 | 53.401 | 6.011 |
| 200 | 100 | 0.902 | 54.696 | 0.237 | 0.950 | 0.673 | 0.739 | 54.575 | 5.933 |
| 180 | 90 | 0.814 | 59.116 | 0.225 | 0.902 | 0.640 | 0.769 | 59.015 | 5.636 |
| 160 | 80 | 0.801 | 59.769 | 0.224 | 0.895 | 0.635 | 0.773 | 59.631 | 5.592 |
| 140 | 70 | 0.791 | 60.271 | 0.222 | 0.889 | 0.630 | 0.776 | 60.156 | 5.555 |
| 120 | 60 | 0.721 | 63.787 | 0.212 | 0.849 | 0.602 | 0.799 | 63.707 |
5.303 |
| 100 | 50 | 0.761 | 61.778 | 0.218 | 0.872 | 0.618 | 0.786 | 61.696 | 5.448 |
| 80 | 40 | 0.687 | 65.495 | 0.207 | 0.829 | 0.588 | 0.809 | 65.397 | 5.178 |
| 60 | 30 | 0.663 | 66.700 | 0.203 | 0.814 | 0.577 | 0.817 | 66.614 | 5.085 |
| 40 | 20 | 0.571 | 71.321 | 0.189 | 0.756 | 0.536 | 0.844 | 71.222 | 4.721 |
| 20 | 10 | 0.532 | 73.280 | 0.182 | 0.730 | 0.517 | 0.856 | 73.173 | 4.558 |
| 10 | 5 | 0.510 | 74.385 | 0.178 | 0.714 | 0.506 | 0.863 | 74.320 |
4.460 |
Analyze > Classify > Tree…..in SPSS package program. Since our dependent variable (weaning weight) is scale, CART, CHAID and Exhaustive CHAID data mining algorithms are activated as growing methods in SPSS program to obtain a regression tree diagram. In the construction of the regression tree graph for each algorithm, the cross-validation value of 10 was employed.
RESULTS AND DISCUSSION
Performance of CART and both CHAID algorithms according to different parent: child node proportions specified for the study were compared in order to appoint some environmental factors that impress weaning weight well and summary results of goodness of fit criteria estimated for the algorithms are given in Tables I, II and III, respectively. This information is novel in literature. With being decreased the proportion from 500:250 through 10:5, their goodness of fit criteria were found better. The regression tree structure generated by CHAID algorithm was more interpretable than those constructed by CART and Exhaustive CHAID algorithms, causing over branching.
Following are results of Goodness of fit criteria for weaning weight
CHAID algorithm
When minimum parent: child node proportion was reached from 500:250 to 10:5, RE (0.992 to 0.510),
Table II.- Goodness of fit criteria for the Exhaustive CHAID algorithm.
| Parent node | Child node | RE |
R2 (%) |
RAE | RMSE | SDratio | r |
R2adj. (%) |
CV (%) |
| 500 | 250 | 0.992 | 50.176 | 0.249 | 0.996 | 0.706 | 0.708 | 50.128 | 6.222 |
| 480 | 240 | 0.992 | 50.176 | 0.249 | 0.996 | 0.706 | 0.708 | 50.128 | 6.222 |
| 460 | 230 | 0.992 | 50.176 | 0.249 | 0.996 | 0.706 | 0.708 | 50.128 | 6.222 |
| 440 | 220 | 0.992 | 50.176 | 0.249 | 0.996 | 0.706 | 0.708 | 50.128 | 6.222 |
| 420 | 210 | 0.992 | 50.176 | 0.249 | 0.996 | 0.706 | 0.708 | 50.128 | 6.222 |
| 400 | 200 | 0.992 | 50.176 | 0.249 | 0.996 | 0.706 | 0.708 | 50.128 | 6.222 |
| 380 | 190 | 0.992 | 50.176 | 0.249 | 0.996 | 0.706 | 0.708 | 50.128 | 6.222 |
| 360 | 180 | 0.951 | 52.235 | 0.244 | 0.975 | 0.691 | 0.723 | 52.158 | 6.092 |
| 340 | 170 | 0.976 | 50.979 | 0.247 | 0.988 | 0.701 | 0.714 | 50.903 | 6.173 |
| 320 | 160 | 0.966 | 51.482 | 0.246 | 0.983 | 0.697 | 0.717 | 51.429 | 6.140 |
| 300 | 150 | 0.955 | 52.034 | 0.244 | 0.977 | 0.693 | 0.721 | 51.955 | 6.105 |
| 280 | 140 | 0.955 | 52.034 | 0.244 | 0.977 | 0.693 | 0.721 | 51.955 | 6.105 |
| 260 | 130 | 0.953 | 52.135 | 0.244 | 0.976 | 0.692 | 0.722 | 52.071 | 6.098 |
| 240 | 120 | 0.926 | 53.491 | 0.240 | 0.962 | 0.682 | 0.731 | 53.368 | 6.011 |
| 220 | 110 | 0.922 | 53.692 | 0.240 | 0.960 | 0.681 | 0.733 | 53.575 | 5.998 |
| 200 | 100 | 0.877 | 55.952 | 0.234 | 0.937 | 0.664 | 0.748 | 55.812 | 5.852 |
| 180 | 90 | 0.808 | 59.417 | 0.225 | 0.899 | 0.637 | 0.771 | 59.341 | 5.615 |
| 160 | 80 | 0.795 | 60.070 | 0.223 | 0.892 | 0.632 | 0.775 | 59.979 | 5.570 |
| 140 | 70 | 0.792 | 60.221 | 0.222 | 0.890 | 0.631 | 0.776 | 60.092 | 5.561 |
| 120 | 60 | 0.746 | 62.531 | 0.216 | 0.864 | 0.612 | 0.791 | 62.442 | 5.395 |
| 100 | 50 | 0.740 | 62.833 | 0.215 | 0.860 | 0.610 | 0.793 | 62.707 | 5.374 |
| 80 | 40 | 0.706 | 64.540 | 0.210 | 0.840 | 0.596 | 0.803 | 64.442 | 5.248 |
| 60 | 30 | 0.662 | 66.750 | 0.203 | 0.813 | 0.577 | 0.817 | 66.656 | 5.082 |
| 40 | 20 | 0.565 | 71.622 | 0.188 | 0.752 | 0.533 | 0.846 | 71.535 | 4.695 |
| 20 | 10 | 0.534 | 73.179 | 0.183 | 0.731 | 0.518 | 0.855 | 73.106 | 4.564 |
| 10 | 5 | 0.511 | 74.335 | 0.179 | 0.715 | 0.507 | 0.862 | 74.273 |
4.464 |
SD ratio (0.706 to 0.506), RAE (0.249 to 0.178), RMSE (0.996 to 0.506) and CV (%) (6.222 to 4.460) reduced for CHAID algorithm, whereas the rest goodness of fit criteria ascended (Table I). It was drawn attention from the statistical evaluation that Pearson correlation coefficient between observed and predicted weaning weight values depictured an increment from 0.708 to 0.863, which is an indicator of reducing the variance within nodes forming in the tree diagram. From Table I, it is obvious that no alteration was found in goodness of fit criteria of CHAID algorithm between parent: child nodes 380:190 and 500:250.
A regression tree diagram was constructed by the CHAID algorithm for parent: child node proportions 500:250, 480:240, 460:230, 440:220, 420:210:400:200 and 380:190, respectively. The tree diagram is depicted in Figure 1. All lambs in the Mengali population were split into five sub-subsets or populations (Nodes 1-5) as a result of significantly including birth weight, respectively. The heaviest lamb weaning weight of 17.614 kg was found for a subset of the lambs in Node 5 whose birth weight was greater than 3.800 kg.
The decision tree generated for only the parent: child node proportion 140:70 is illustrated in Figure 2. Node 0 was divided by birth weight (the most effective variable) into 8 subsets named Nodes 1-8, respectively. As birth weight increased from Node 1 to Node 8, weaning weight also increased (Fig. 2). Nodes 2, 3, 4 and 5 were effected by year factor (Adjusted P=0.000). Nodes 11 and 13 were divided by means of farm factor into two subsets (Nodes 19-20 and Nodes 21-22), respectively (Adjusted P=0.000). Node 9 was split by dam age into two subsets, respectively (Adjusted P=0.043). Node 15 was split by means of sex factor into two child subsets (Nodes 23 and 24), (Adjusted P=0.000).
Exhaustive CHAID algorithm
Table II demonstrated that RE (0.992-0.511), RAE (0.249-0.179), RMSE (0.996-0.715) and SD ratio (0.706-0.507), CV (%) (6.222-4.464), R2 (50.176-74.335%) and adjusted R2 (50.128-74.273%) estimates of Exhaustive CHAID tree-based algorithm from the parent-child node proportion 500-250 to 10:5 were made, which means that its predictive performance in weaning weight improved as result of reducing the variance within nodes. However, higher coefficients of determination, and Pearson coefficients (0.708-0.862) between actual and predicted weaning weight were obtained (Table II). For a good fit, an algorithm must have R2 greater than 70%. Goodness of fit criteria of the Exhaustive CHAID was found the definitely same with CHAID algorithm between the parent-child node proportions 500:250 and 380:190 (Tables I and II). But, at the proportions 300:150, 240:120 and 80:40, birth weight generated splits in succession in some branches of the regression tree diagram of Exhaustive CHAID algorithm. It could be suggested that use of CHAID and CART algorithms was better at the proportions. In agreement with our results, Tariq et al. (2012) determined
Table III.- Goodness of fit criteria for CART algorithm.
|
Parent Node
|
Child Node | RE |
R2 (%) |
RAE | RMSE | SDratio | r |
R2adj (%) |
CV(%) | ||||||||||
| 500 | 250 | 1.022 | 48.667 | 0.253 | 1.011 | 0.719 | 0.697 | 48.593 | 6.463 | ||||||||||
| 480 | 240 | 1.022 | 48.667 | 0.253 | 1.011 | 0.719 | 0.697 | 48.593 | 6.332 | ||||||||||
| 460 | 230 | 1.022 | 48.667 | 0.253 | 1.011 | 0.719 | 0.697 | 48.593 | 6.332 | ||||||||||
| 440 | 220 | 1.022 | 48.667 | 0.253 | 1.011 | 0.719 | 0.697 | 48.593 | 6.332 | ||||||||||
| 420 | 210 | 1.022 | 48.667 | 0.253 | 1.011 | 0.719 | 0.697 | 48.593 | 6.332 | ||||||||||
| 400 | 200 | 1.022 | 48.667 | 0.253 | 1.011 | 0.719 | 0.697 | 48.593 | 6.332 | ||||||||||
| 380 | 190 | 1.022 | 48.667 | 0.253 | 1.011 | 0.719 | 0.697 | 48.593 | 6.332 | ||||||||||
| 360 | 180 | 0.920 | 53.790 | 0.253 | 1.011 | 0.719 | 0.697 | 48.538 | 6.332 | ||||||||||
| 340 | 170 | 0.920 | 53.790 | 0.240 | 0.959 | 0.680 | 0.733 | 53.701 | 5.991 | ||||||||||
| 320 | 160 | 0.863 | 56.653 | 0.240 | 0.959 | 0.680 | 0.733 | 53.701 | 5.991 | ||||||||||
| 300 | 150 | 0.863 | 56.653 | 0.232 | 0.929 | 0.659 | 0.753 | 56.553 | 5.803 | ||||||||||
| 280 | 140 | 0.863 | 56.653 | 0.232 | 0.929 | 0.659 | 0.753 | 56.553 | 5.803 | ||||||||||
| 260 | 130 | 0.863 | 56.653 | 0.232 | 0.929 | 0.659 | 0.753 | 56.553 | 5.803 | ||||||||||
| 240 | 120 | 0.829 | 58.361 | 0.232 | 0.929 | 0.659 | 0.753 | 56.553 | 5.803 | ||||||||||
| 220 | 110 | 0.829 | 58.361 | 0.227 | 0.910 | 0.645 | 0.764 | 58.292 | 5.686 | ||||||||||
| 200 | 100 | 0.802 | 59.717 | 0.227 | 0.910 | 0.645 | 0.764 | 58.292 | 5.686 | ||||||||||
| 180 | 90 | 0.802 | 59.717 | 0.224 | 0.895 | 0.635 | 0.773 | 59.622 | 5.593 | ||||||||||
| 160 | 80 | 0.743 | 62.681 | 0.224 | 0.895 | 0.635 | 0.773 | 59.622 | 5.593 | ||||||||||
| 140 | 70 | 0.732 | 63.233 | 0.215 | 0.862 | 0.611 | 0.792 | 62.575 | 5.385 | ||||||||||
| 120 | 60 | 0.712 | 64.238 | 0.214 | 0.855 | 0.606 | 0.795 | 63.150 | 5.343 | ||||||||||
| 100 | 50 | 0.693 | 65.192 | 0.211 | 0.844 | 0.598 | 0.802 | 64.154 | 5.270 | ||||||||||
| 80 | 40 | 0.672 | 66.247 | 0.208 | 0.832 | 0.590 | 0.807 | 65.099 | 5.200 | ||||||||||
| 60 | 30 | 0.637 | 68.005 | 0.205 | 0.820 | 0.581 | 0.814 | 66.166 | 5.120 | ||||||||||
| 40 | 20 | 0.582 | 70.767 | 0.199 | 0.798 | 0.566 | 0.825 | 67.919 | 4.983 | ||||||||||
| 20 | 10 | 0.572 | 71.270 | 0.191 | 0.763 | 0.541 | 0.841 | 70.676 | 4.764 | ||||||||||
| 10 | 5 | 0.565 | 71.621 | 0.189 | 0.756 | 0.536 | 0.844 | 71.169 | 4.724 | ||||||||||
that the Exhaustive CHAID algorithm had longer operation time compared to CHAID algorithm. However, all the algorithms succeeded in reducing the variance within nodes.
CART algorithm
When different parent-child node proportions were examined (Table III), it was concluded that RE (1.022-0.565), RAE (0.253-0.189), RMSE (1.011-0.756) and SD ratio (0.719-0.536) CV (6.463-4.724%), R2 (48.667-71.621%) and adjusted R2 (48.593-71.169%) estimates of CART algorithm provided much better fit from 500:250 through 10:5 as also found in other algorithms. The result may be ascribed to reducing the variance within nodes (subsets) in weaning weight in the regression tree diagrams. Also, corresponding goodness of fit criteria such as coefficient of determination, adjusted coefficient of determination and Pearson correlation between predicted and actual weaning weight values increased under same conditions. It was found in the study that, in line with the other algorithms, CART reduced the variability within nodes or increased the variability among nodes in weaning weight, a response variable. In addition, some authors mentioned that SD ratio estimates of the data mining algorithms should be less than 0.40 for a good fit (Grzesiak et al., 2003; Grzesiak and Zaborski, 2012; Ali et al., 2015), which was in virtually agreement with those obtained for the algorithms in the study.
CONCLUSION
Weaning weight in farm animals played a considerable role on animal husbandry studies. In this respect, we intended in the study to comparatively examine the effect of different parent and child node proportions on predictive performance of CART, CHAID and Exhaustive CHAID data mining algorithms, and to observe the agreeableness of their tree constructions. All the algorithms had much better fit at parent and child node proportions from 500:250 to 10:5. For Mengali sheep data, CHAID algorithm generated more appropriate and deductive regression tree constructions. In literature, for example, the data mining algorithms can give more effective responses in the prediction of live body weight by morphological measurements, which are genetically correlated to the body weight (Khan et al., 2014; Ali et al., 2015).
As a result, it is expected that employing quantitative traits genetically correlated highly to a target trait like body weight with individual breeding coefficients and the data mining algorithms will serve a useful purpose in gaining superior animals for animal breeding studies. In other words, cut-off values of individual inbreeding coefficients in the regression tree diagrams formed by the tree-based algorithms might release information on degree of inbreeding depression in a flock.
Acknowledgment
The authors would like to thank Prof. Mohammad Masood Tariq and Dr. Abdul Waheed for allowing us to use their data in the study.
Conflict of interest statement
We declare that we have no conflict of interest.
REFERENCES
Akin, M., Eyduran, E. And Reed, B.M., 2016. Using the CHAID data mining algorithm for tissue culture medium optimization. In: In vitro cellular and developmental biology-animal. Vol. 52, Spring ST, New York, NY 10013, USA, pp. 233.
Ali, M., Eyduran, E., Tariq, M.M., Tirink, C., Abbas, F., Bajwa, M.A., Baloch, M.H., Nizamani, A.H., Waheed, A., Awan, M.A., Shah, S.H., Ahmad, Z. and Jan, S., 2015. Comparison of artificial neural network and decision tree algorithms used for predicting live weight at post weaning period from some biometrical characteristics in harnai sheep. Pakistan J. Zool., 47: 1579-1585.
Bakir, G., Keskin, S. and Mirtagioğlu, H., 2009. Evaluating the relationship between mature age milk yield and several traits using CHAID analysis in brown Swiss cows. J. Anim. Vet. Adv., 8: 587-589.
Bakir, G., Keskin, S. and Mirtagioğlu, H., 2010. Determination of the effective factors for 305 days milk yield by regression tree (RT) method. J. Anim. Vet. Adv., 9: 55-59. http://dx.doi.org/10.3923/javaa.2010.55.59
Cak, B., Keskin, S. and Yilmaz, O., 2013. Regression tree analysis for determining of affecting factors to lactation milk yield in brown Swiss cattle. Asian J. Anim. Vet. Adv., 8: 677-682. http://dx.doi.org/10.3923/ajava.2013.677.682
Çamdeviren, H., Mendeş, M., Ozkan, M.M., Toros, F., Şaşmaz, T. and ve Oner, S., 2005. Determination of depression risk factors in children and adolescents by regression tree methodology. Acta Med. Okayama, 59:19-26.
Doğan, I., 2003. Holştayn irki ineklerde Süt verimine etki eden faktörlerin CHAID analizi ile incelenmesi. Ankara Üniv. Vet. Fakül. Derg., 50:65-70.
Eyduran, E., Karakus, K., Keskin, S. and Cengiz, F., 2008. Determination of factors influencing birth weight using regression tree (RT) method. J. appl. Anim. Res., 34: 109–112. http://dx.doi.org/10.1080/09712119.2008.9706952
Eyduran, E., Tatliyer, A., Tariq, M. and Waheed, A., 2013a. Application of classification and regression tree methods in agriculture. Ulusal Tarim Kongresi, 26-29 Ekim, Antalya.
Eyduran, E., Yilmaz, I., Kaygisiz, A. and Aktaş, Z.M., 2013b. An investigation on relationship between lactation milk yield, somatic cell count and udder traits in first lactation Turkish Saanen goat using different statistical techniques. J. Anim. Pl. Sci., 23: 956-963.
Eyduran, E., Yilmaz, I., Tariq, M. and Kaygisiz, A., 2013c. Estimation of 305-d milk yield using regression tree method in brown Swiss cattle. J. Anim. Pl. Sci., 23: 731-735.
Grzesiak, W., Lacroix, R., Wójcik, J. and Blaszczyk, P., 2003. A comparison of neural network and multiple regression predictions for 305-day lactation yield using partial lactation records. Canadian J. Anim. Sci., 83: 307-310. http://dx.doi.org/10.4141/A02-002
Grzesiak, W., Błaszczyk, P. and Lacroix, R., 2006. Methods of predicting milk yield in dairy cows predictive capabilities of wood’s lactation curve and artificial neural networks (ANNs). Comput. Electr. Agric., 54: 69-83. http://dx.doi.org/10.1016/j.compag.2006.08.004
Grzesiak, W. and Zaborski, D., 2012. Examples of the use of data mining methods in animal breeding. Additional information is available at the end of the chapter. http://dx.doi.org/10.5772/50893
Kayri, M. and Boysan, M., 2008. Assesment of relation between cognitive vulnerability and depression’s level by using classification and regression tree analysis. Hacettepe Univ. Egit. Fakul. Derg., 34: 168-177.
Khan, M.A., Tariq, M.M., Eyduran, E., Tatliyer, A., Rafeeq, M., Abbas, F., Rashid, N., Awan, M.A. and Javed, K., 2014. Estimating body weight from several body measurements in Harnai sheep without multicolinearity problem. J. Anim. Pl. Sci., 24: 120-126.
Mendeş, M. and Akkartal, E., 2009. Regression tree analysis for predicting slaughter weight in broilers. Italian J. Anim. Sci., 8: 615-624. http://dx.doi.org/10.4081/ijas.2009.615
Orhan, H., Eyduran, E., Tatliyer, A. and Saygici, H., 2016. Prediction of egg weight from egg quality characteristics via ridge regression and regression tree methods. Rev. Brasil. Zootec., 45: 380-385. http://dx.doi.org/10.1590/S1806-92902016000700004
Tariq, M.M., Rafeeq, M., Bajwa, M.A., Abbas, F., Waheed, A., Bukhari, F. A. and Akhtar, P., 2012. Prediction of body weight from body measurements using regression tree (RT) method for indigenous sheep breeds in Balochistan, Pakistan. J. Anim. Pl. Sci., 22: 20-24.
Topal, M., Aksakal, V., Bayram, B. and Yağanoğlu, A.M., 2010. An analysis of factors affecting birth weight and actual milk yield in Swedish red cattle using regression tree analysis. J. Anim. Pl. Sci., 20: 63-69.
Yakubu, A., 2012. Aplication of regresyon tree methodology in predicting the body weight of uda sheep. Scientific papers. Anim. Sci. Biotech., 45: 484-490.
Yilmaz, I., Eyduran, E. and Kaygisiz, A., 2013. Determination of non-genetic factors influencing birth weight sing regression tree method in Brown-Swiss cattle. Canadian J. appl. Sci., 1: 382-387.
To share on other social networks, click on any share button. What are these?


