
Antioxidant Defense System is a Key Mechanism for Drought Stress Tolerance in Wheat (Triticum aestivum L.)


Antioxidant Defense System is a Key Mechanism for Drought Stress Tolerance in Wheat (Triticum aestivum L.)
Muhammad Rashid, Mahmood Ahmad Sajid, Nosheen Noor Elahi, Sibgha Noreen and Kausar Hussain Shah*
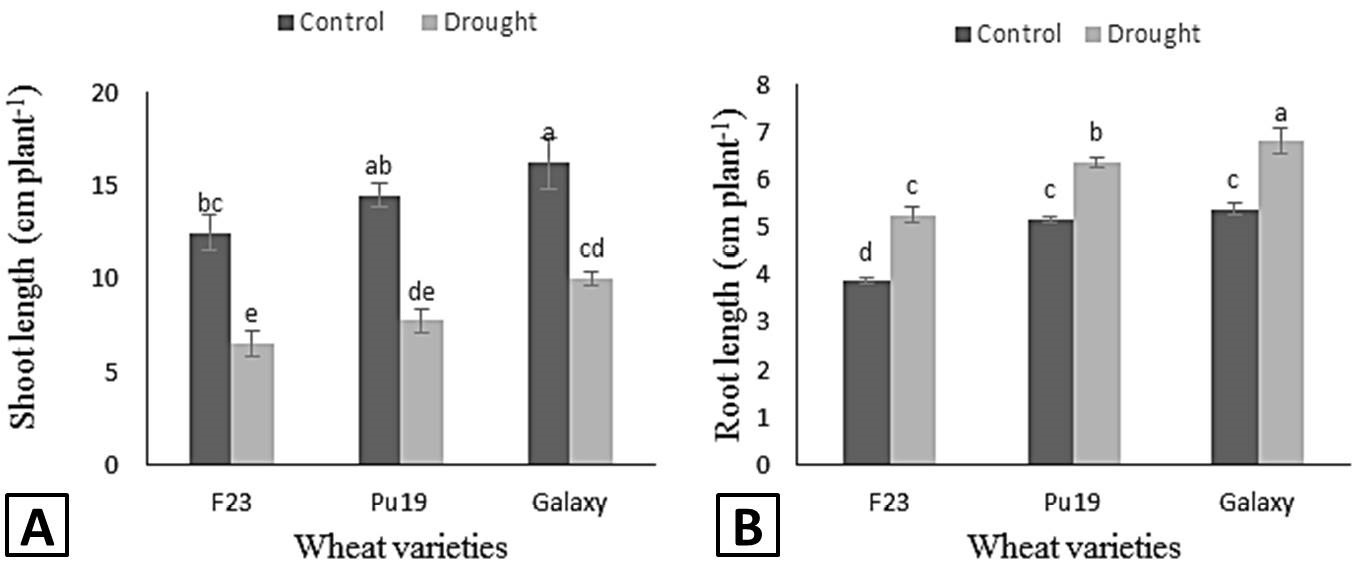
Shoot length (A) and root length (B) of wheat varieties grown under control and drought condition. Different letters show the significant differences calculated by LSD at p<0.05. The data presented are mean values ± standard error of four replicates.
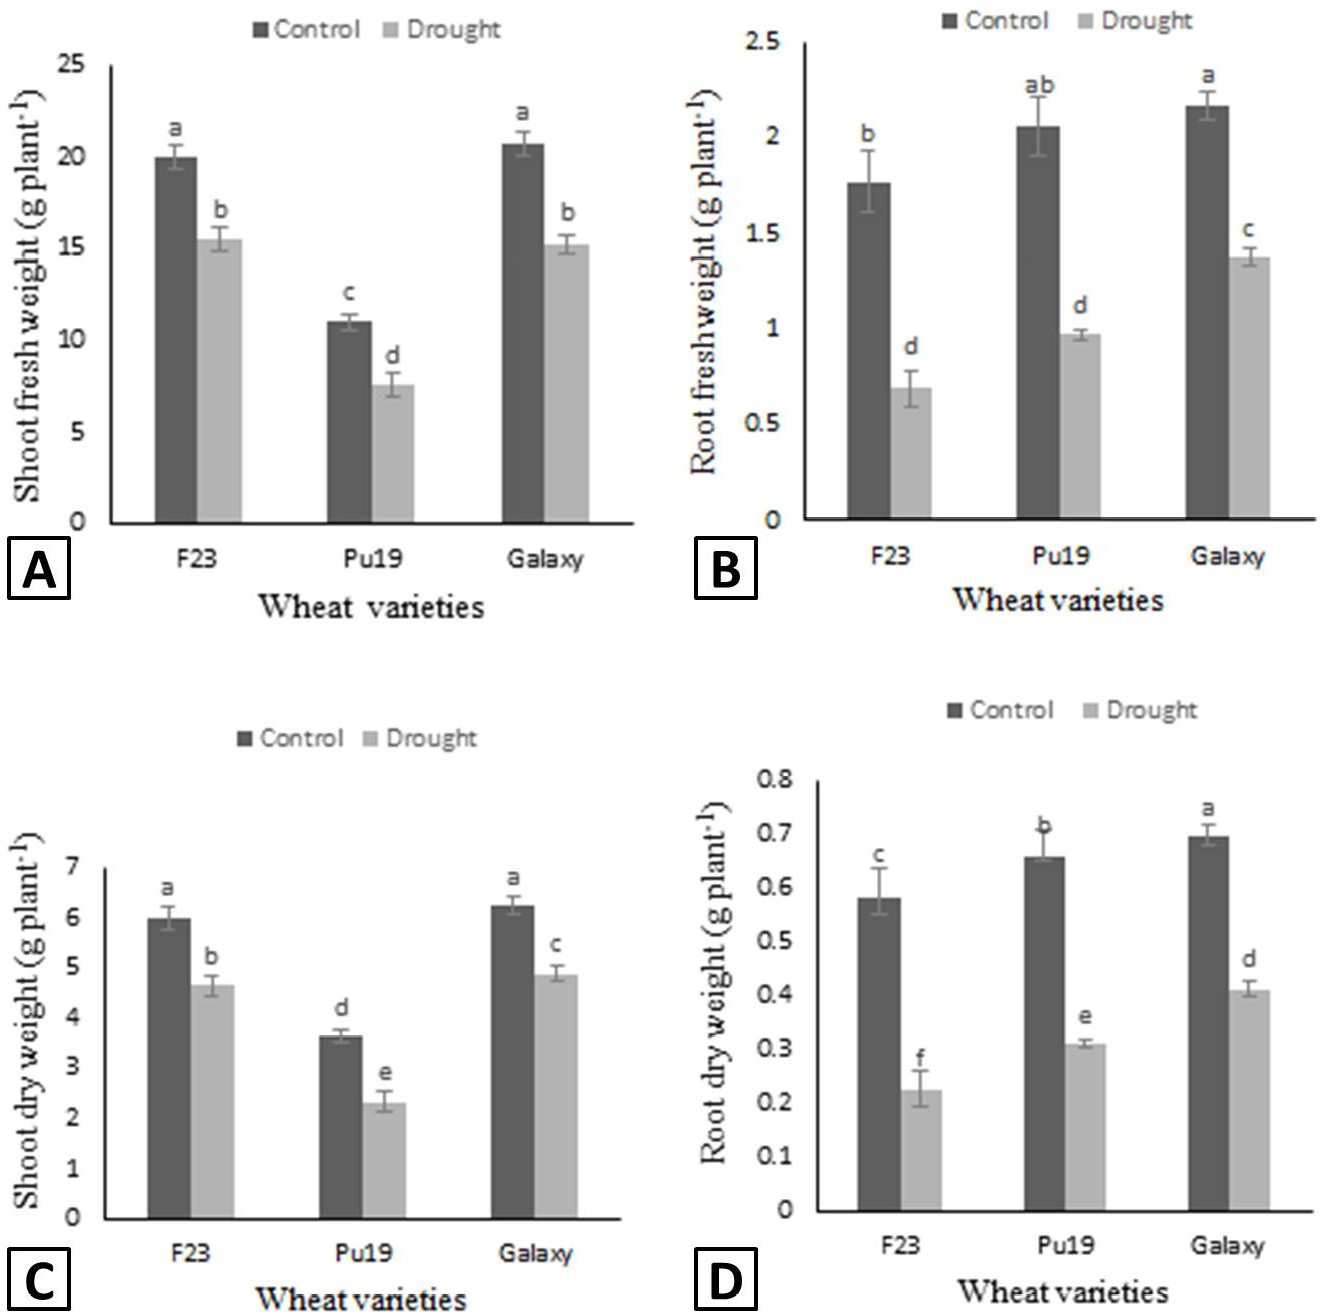
Fresh weight of shoot (A), fresh weight of root (B), dry weight of shoot (C) and dry weight of root (D) of wheat varieties grown under control and drought condition. Different letters show the significant differences calculated by LSD at p<0.05. The data presented are mean values ± standard error of four replicates.

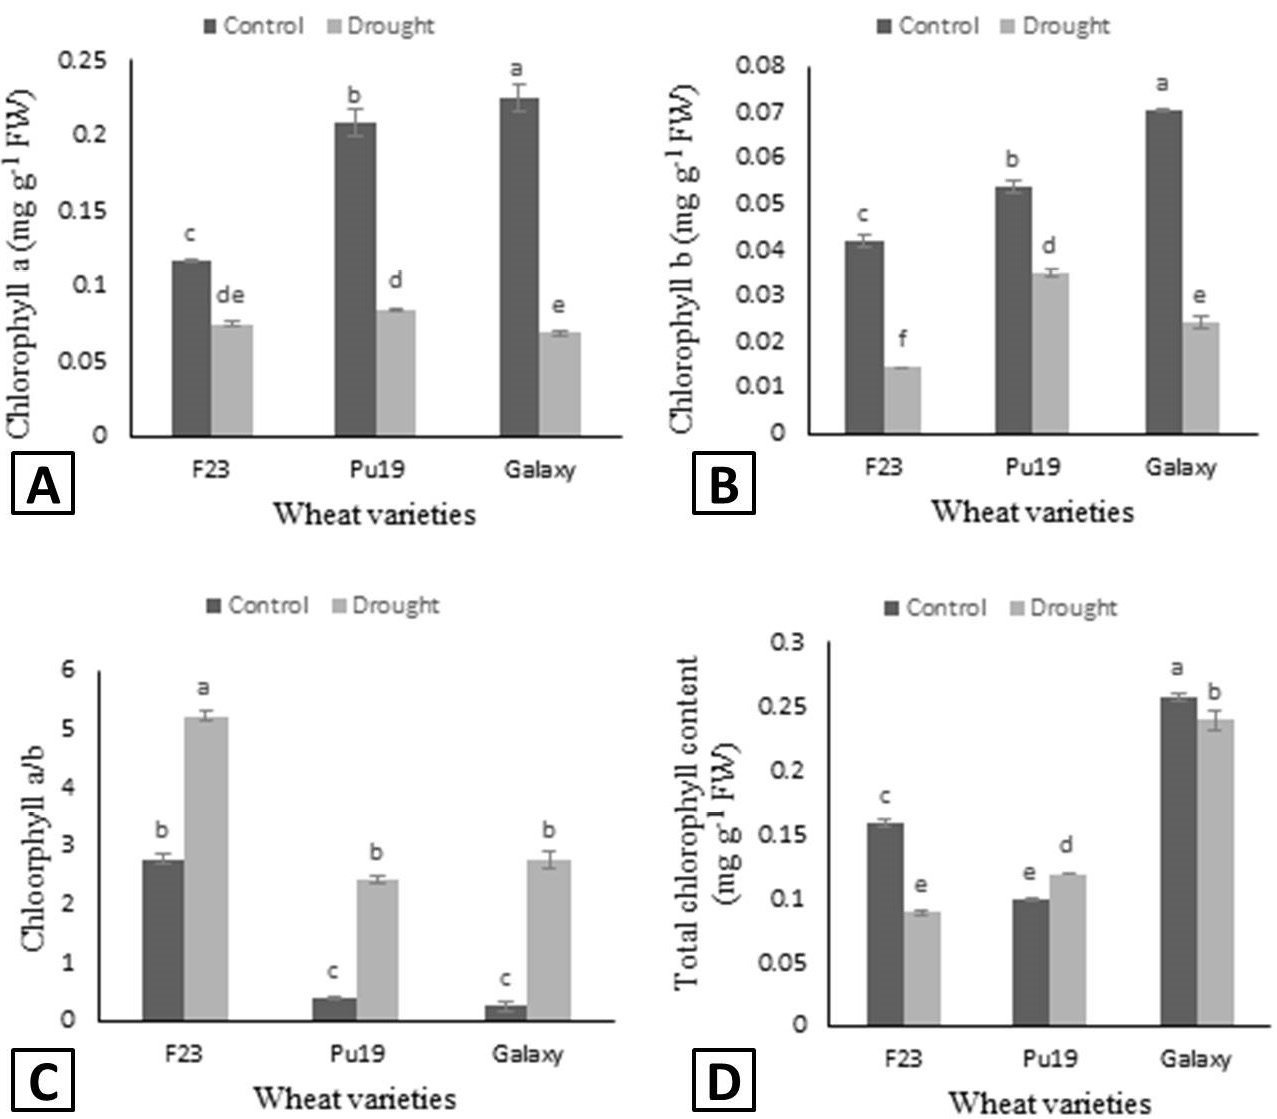
Chlorophyll a (A), chlorophyll b (B), chlorophyll a/b (C) and total chlorophyll contents (D) of wheat varieties grown under control and drought condition. Different letters show the significant differences calculated by LSD at p<0.05. The data presented are mean values ± standard error of four replicates.

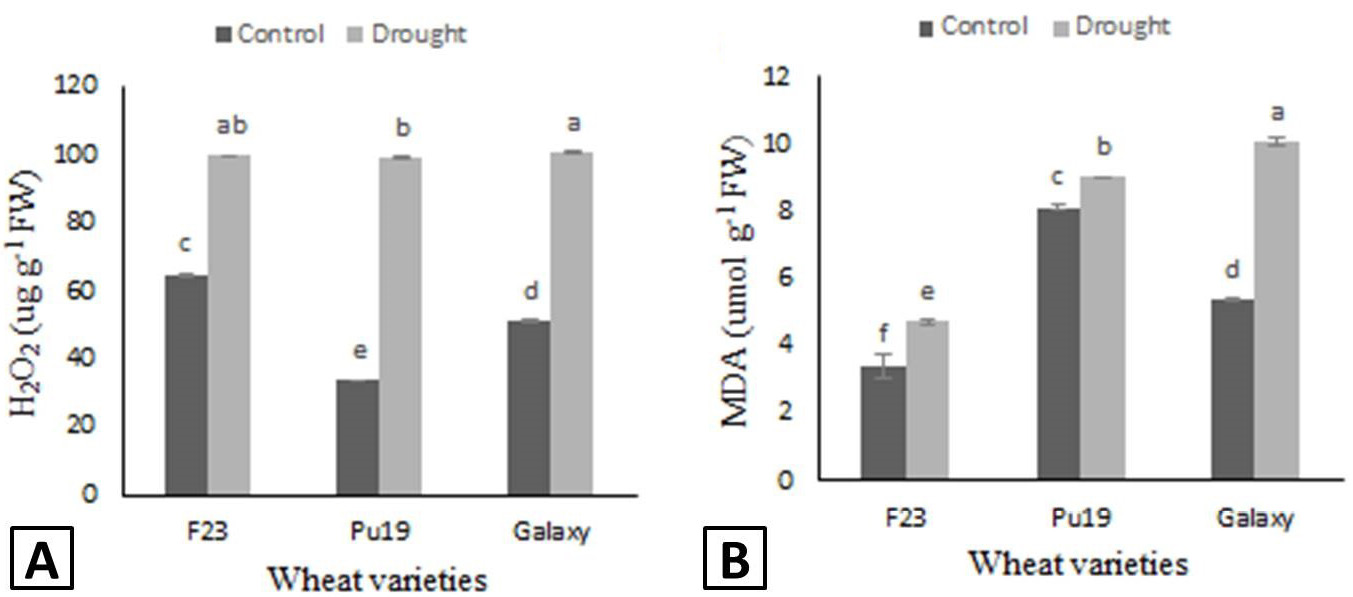
H2O2 contents of wheat leaves grown under control and drought condition. Different letters show the significant differences calculated by LSD at p<0.05. The data presented are mean values ± standard error of four replicates.
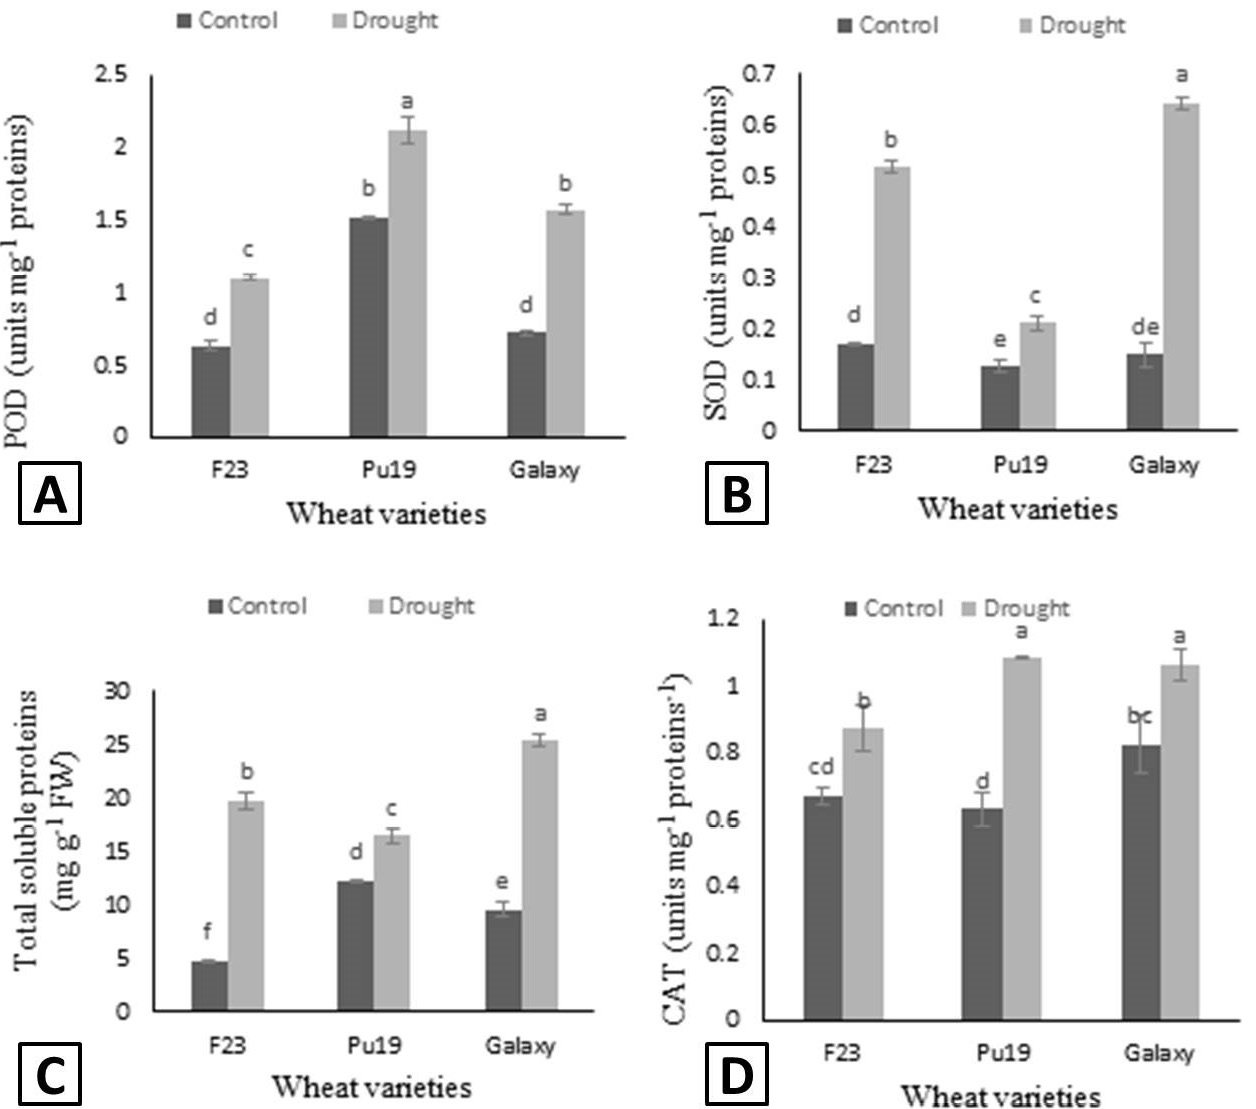
POD (A), SOD (B) total soluble proteins (C) and CAT (D) measured in three different wheat varieties grown under control and drought condition. Different letters show the significant differences calculated by LSD at p<0.05. The data presented are mean values ± standard error of four replicates.

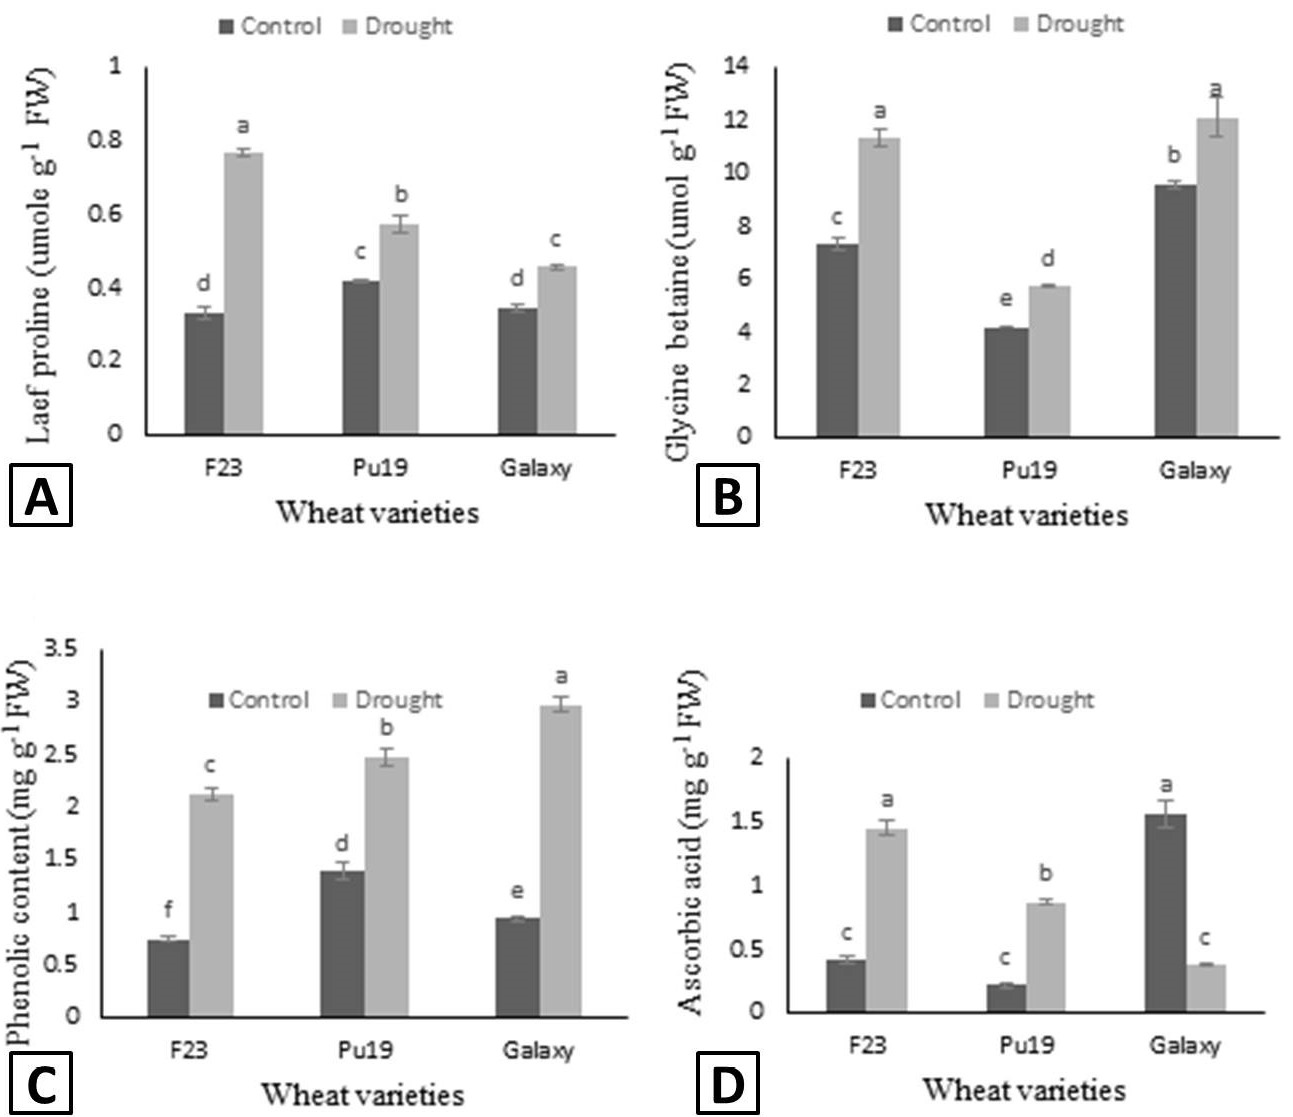
Leaf proline (A), glycine betaine (B), phenolic Contents (C) and ascorbic acid (D) of wheat varieties grown under control and drought condition. Different letters show the significant differences calculated by LSD at p<0.05. The data presented are mean values ± standard error of four replicates.
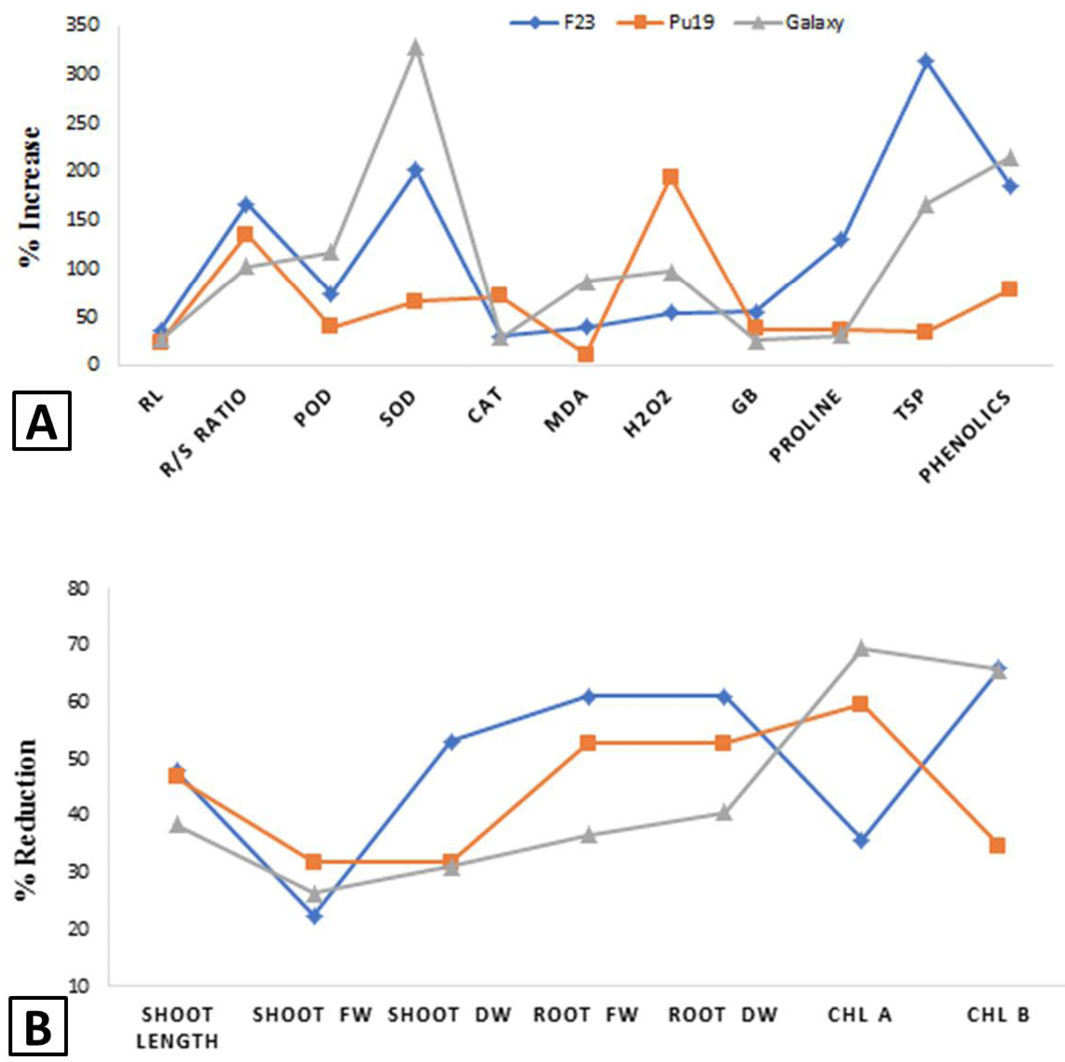
Percentage of reduction (A) and increase (B) in biomass, chlorophyll contents, antioxidants and osmoprotectants in wheat varieties grown under control and drought condition. RL, root length; R/S ratio, root and shoot ratio; TSP, total soluble proteins; GB, glycine betaine; POD, peroxidase; SOD, superoxide dismutase; CAT, catalase; MDA, malondialdehyde.


