


Research Article
An Empirical Analysis of Economic Efficiency and Farm Size of Cotton Farmers
Dilshad Ahmad1* and Muhammad Afzal2
1Department of Management Sciences, COMSATS University Islamabad, Vehari Campus, Pakistan; 2Department of Economics, Preston University, Islamabad, Pakistan.
Abstract | This paper attempted to analyze the impact of farm size on the economic efficiency of cotton farmers in southern Punjab of Pakistan. Farm-level allocative, economic and technical efficiency of samples of 240 small, medium and large-scale cotton farmers was estimated using Stochastic Frontier Approach of district Rahim Yar Khan Punjab, Pakistan. Empirical findings of the study indicated that medium farm size cotton farmers were more allocative, technically and economically efficient (0.90, 0.94, 0.85) rather than small farm farmers (0.79, 0.92, 0.76) and large farm farmers (0.70, 0.97, 0.68). Farmers schooling years, formal credit access, own tubewell availability, adequate extension access and sowing cotton crop timely were significant socioeconomic factors that affect farmers efficiency level. Medium farm size cotton farmers were producing higher cotton yield and earning higher per acre gross profit (Rs. 18142.28) relatively to small (Rs. 15232.94) and large (Rs. 8231.349) farm size cotton farmers. There is a need for significant prolong state-based policy measures for provision of adequate and quality based crop inputs, infusion of advanced mechanisation and regulating market mechanism for consistency in prices of crop inputs and outputs. It is essential to increase managerial competencies among farmers through increasing literacy, sufficient access of extension services, familiarity and infusion of advanced mechanisation and adequate access of formal credit through implementing adequate policy measures by concerned authorities of the state.
Received | January 30, 2019; Accepted | August 26, 2020; Published | October 14, 2020
*Correspondence | Dilshad Ahmad, Department of Management Sciences, COMSATS University Islamabad, Vehari Campus, Pakistan; Email: dilshad@ciitvehari.edu.pk
Citation | Ahmad, D. and M. Afzal. 2020. An empirical analysis of economic efficiency and farm size of cotton farmers. Sarhad Journal of Agriculture, 36(4): 1067-1078.
DOI | http://dx.doi.org/10.17582/journal.sja/2020/36.4.1067.1078
Keywords | Cotton, Cobb-Douglas, Efficiency, Punjab, Pakistan, JEL classification: C8, D2, Q0, Q1, Q5
Introduction
In developing countries, assuring food security, enhancing employment opportunities, providing industrial raw material and reducing poverty of the farming community agriculture plays a major role (Ahmad et al., 2020). In the scenario of incompatible climate change and environmental dynamics, agriculture is involved in uncertain risk, which caused farming risky enterprise (Azam-Ali, 2007; Wang et al., 2009; Ahmad et al., 2018). Production fluctuations, financial constraints, less developed human resources, marketing issues, and environmental dynamics are significant risks in agriculture. Production risk is considered more severe among these in reducing crop yield and a major threat to farmers livelihood (Musser and Patrick, 2002; Sarwar and Saeed, 2013; Ahmad and Afzal, 2020). In the scenario of farm size and efficiency status an inverse association was estimated in literature due to some significant reasons for imperfect factors of the market (insurance market, credit market, labour market, and land market), omitted variables (soil quality) and methodological constraints (inputs use, mechanisation application, managerial expertise) (Dercon and Krishnan, 1996; Barrett, 1996; Assuncao and Ghatak, 2003; Assuncao and Braido, 2007; Lipton, 2010; Mburu et al., 2014; Ahmad and Afzal, 2020). Emerging Asian economies have sustained economic growth through developing their agriculture sector with increasing agriculture productivity (Abdulai and Abdulai, 2016). Market mechanism imperfections as instability in agricultural output prices (Ahmad et al., 2018), inflationary pressure of crops inputs (pesticides, seeds, and fertilizers), water and power shortages are some significant challenges faced by the agricultural community in Pakistan (Saqib et al., 2018). In reducing poverty farming community and improving socioeconomic sustainability status of rural farmers it is prerequisite to having some applicable significant policy measures in the agriculture sector (Ahmad et al., 2017).
In Pakistan, agriculture is a most important sector of economy due to major source of livelihood almost sixty percent population inhabited in rural areas, indirectly or directly depends on this sector (Rehman et al., 2017; Chandio et al., 2017; Ahmad and Afzal, 2018; Ahmad et al., 2019). Agriculture is contributing 18.9 percent in gross domestic product and employing 42.3 percent labour force and foremost source in providing food basket for population and supply chain to industrial sector raw material Government of Pakistan (GOP, 2018). Cotton, wheat, maise, sugarcane and rice are main crops, share value-added 23.85 percent and contribute 4.66 percent in gross a domestic product of the country (GOP, 2017). Pakistan is a prominent textile exporting country with the contribution of 62 percent of national exports and employing 40 percent industrial labour force All Pakistan Textile Mills Association (APTMA, 2017). An adequate supply of local raw material to the manufacturing sector has a significant advantage to cost minimisation and competing for the international market. During a decade, Pakistan has to suffer severe status of importing cotton for the local textile industry due to inadequate production of the cotton crop (GOP, 2017).
Cotton a cash crop of Pakistan, which has extensive forward and backward linkages with the economy in supplying local textile industry raw material, providing foreign exchange in exporting cotton lint, fabric and garments yet major earning source for cotton farmers in the country (GOP, 2018). This crop provides 5.2 percent agriculture value-added and it contributes 1% of the gross domestic product of the country (GOP, 2017). Pakistan is 4th major cotton producer with a share of 1.68 million tonnes and 3rd major cotton consuming country with consumption of 2.23 million tonnes in the world Pakistan Central Cotton Committee (PCCC, 2017). The sequential decreasing production of the cotton crop and increasing demand of cotton to local textile industry during a couple of decades and such gap is widening as causing a severe issue for an agricultural country like Pakistan (GOP, 2018). In the year 2016-17 Pakistan imported 4.5 million bales of cotton, worth of $1.58 billion in foreign exchange to meet local textile industry consumption (Dawn News Jan 6, 2017).
In literature the studies of Chavas and Aliber (1993), Javed et al. (2009), Ahmad and Afzal (2012), Mahjoor (2013), Amin et al. (2016), Karli et al. (2017), Mardani et al. (2017), Bilgili et al. (2018) estimated the mixed relationship in farm size and efficiency with various aspects of efficiencies and different crop patterns as cotton, wheat, maise and sugarcane. A number of studies in the literature have estimated the aspect of technical efficiency. There is limited literature as focused on the aspect relationship of farm size and economic efficiency. There is no significant study in southern Punjab as the cotton zone of Punjab province to estimating economic, allocative and scale efficiency among categorised small, medium and large cotton farmers groups. In this paper it has tried to deal with this gap with the major objective of measuring economic efficiency and farm size, in district Rahim Yar Khan the core cotton area of cotton zone southern Punjab of Pakistan. The study is categorised into four sections, introduction elaborated in the first section while material and method discussed in the second section. In section three results and discussion as described while conclusion and suggestions indicated in the last section of the study.
Materials and Methods
This study has focused the region of Punjab province due to several considerable bases; firstly Punjab province contributes 53% of agricultural GDP of the country with the main share of fertile lands in the country (GOP, 2018; Ahmad and Afzal, 2020). Secondly, the Punjab province produces 73% of the total country cotton production (Government of Punjab, 2017). Thirdly, southern Punjab region purposively selected for this study because this region officially knows the cotton zone of Punjab and sharing more than 90% provincial cotton production (Government of Punjab, 2017). Lastly, in southern Punjab region district Rahim Yar Khan was selected for study due to core cotton-producing district of the cotton zone of Punjab (Government of Punjab, 2017).
Multistage sampling approach used in the study for data collection of categorised cotton farmers in the study area. Punjab province the reason of major contributor in cotton production of the country was selected in the first stage whiles the reason for higher cotton-producing areas in province southern Punjab region chosen in the second stage. In the third stage, district Rahim Yar Khan selected for the study due to core cotton-producing district of the cotton zone of southern Punjab. Khan Pur and Rahim Yar Khan, two tehsils from the district along with two union councils from each tehsil, were randomly selected in the fourth stage. Two villages were randomly selected from each union council with thirty respondents from each village using the list provided from local Patwari (land record-holder) according to landholding size in the last stage. An equal number of the respondent from each village were selected due to the reason for indicating the same representation from each location of cotton farmers for the significant outcome of the study.
Two hundred forty (240) cotton farmers’ data was collected from the study area and these cotton farmers were categorised into three groups according to landholding status (small, medium and large) cotton farmers. Cotton farmers were categorised of small farms holding land up to 12.5 acres, medium farms over 12.5 acres to 50 acres and large farms more than from 50 acres (Agriculture Census Organization, 2010). A pre-tested and well-developed questionnaire was designed in the English language while translated into the Urdu language for easy to understand. During the data collection process, local language Punjab and Saraiki were used for a conversation with the respondent for the accuracy of response. Enumerators were the COMSATS students who were already trained for data collection.
In literature, efficiency measurement is related to Farrell (1957) who first initiated the concept of efficiency measurement (economical, allocative and technical efficiency) in his masterpiece work. The scenario to produce on frontier isoquant is known technical efficiency while technical inefficiency denoted as production deviation from isoquant. Bravo-Ureata and Rieger (1991) indicated perceptions of functional literature; efficiency has an applicable and considerable effect regarding resources saving. In literature for empirical estimation of efficiency most frequently used methods are non-parametric and parametric approaches. Empirical estimates to find out the finest firms in total population sample as the non-parametric approach has applied frequently while in Data Envelopment Analysis (DEA), technical efficiency score has no outcome variation regarding firm’s marginal addition in DEA approach.
In the estimation procedure, the DEA approach could coexist through assumption if the data set has zero random shocks. Parametric approach as Stochastic Frontier Analysis (SFA) has most prominently significant for measuring of efficiency due to its significance of random estimation shocks. Production function deviation is not utterly in farmers direct in agriculture as a specific assumption of SFA (Aigner et al., 1977). Coelli (1995) and Ezeh (2004) have focused as natural stochastic foremost control in agriculture which comparatively more preference to SFA relatively to DEA. Homogeneity estimation confers of elasticity coefficients with returns to scale which are advantages related to Cobb-Douglas production function rather to other approaches. A lot of work specifically to agriculture has focused parametric approach for empirical estimation as (Basnayake and Gunartne, 2011; Hassan, 2004; Fatima et al., 2016; Ahmad and Afzal, 2012; Seymour, 2017). The stochastic Frontier approach employed in this study for an empirical estimation which primarily introduced by Aigner et al., (1977) and Meeusen and Broeck (1977) as indicated below Equation 1.

Equation 1 Yi output of ith farmers Yi the vector of inputs quantities of inputs of ith farmers, vectors of unknown parameters estimated in the equation as mention β.

Assume Vi as indicated independent as well as identically distributed N (0, σ2v) random error independent of Ui. Ui management factors as nonnegative inefficiency effect in model and also assumed as independently distributed mean Ui and variance σ2. The magnitude of Ui determines inefficiency of the farmer, when farmer producing at a potential level Ui is zero, as the deviation from production frontier determines the higher value of magnitude and higher inefficiency in production of the farmer (Drysdale et al., 2000). The estimator of the beta coefficient is attained with the estimation of maximum likelihood. Equation 3 defines an overall model variance σ2 combination of the variance of random error σ2v and technical and allocative inefficiency effect σ2u.

In Equation 3 technical and allocative inefficiency is the variation of output from frontier attained through the ratio of ϒ = σ2v / σ2 Battese and Corra (1977).

Equation 4 is indicated by subtracting vi on both sides of Equation 1. The estimated output related ith firm denoted by Yi* used to capture stochastic noise vi. Technically inefficient input vectors and production function dual cost frontier, as indicated in Equation 1 derived in Equation 4. Solving Equation 4 as Yi* denoted given output, inputs vectors of technically efficient ith firm Xit originated with the ratio of x1/xi =ki(i>1) as inputs x1 and xi observed ratio as indicated with ki. The production function usually indicated and assumed as self-dual while the general algebraic form of cost frontier written as:

Equation 5 elaborated minimum cost Ci of ith firms with Yi* output. Input prices vector of ith firms is Pi with the α vectors of parameters. Applying Shepherds Lemma and substituting firm’s prices of inputs and level of output consequential demand function of input economically efficient vectors inputs for ith firm Xie is derived.
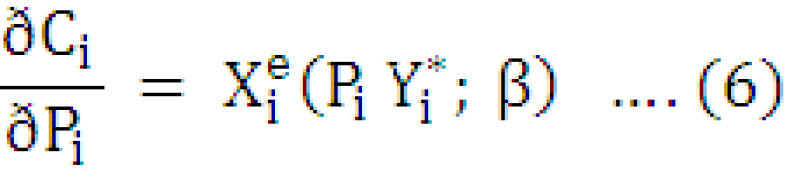
The vectors of estimated parameters indicated as β. P`iXi, Pi xi and P`iXie are respectively equal, economically and technically efficient of ith firms production cost, which uses technical efficiency and economic efficiency indices of cost measure of ith firms as given below.
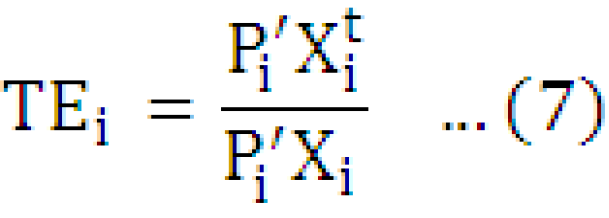
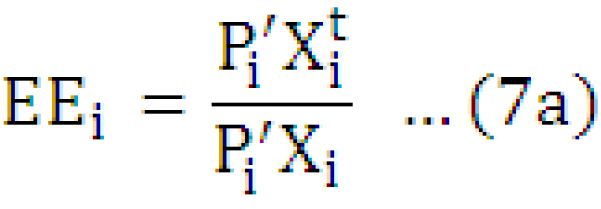
Equation 7 and 7a help derive allocative efficiency following Farrell (1957).
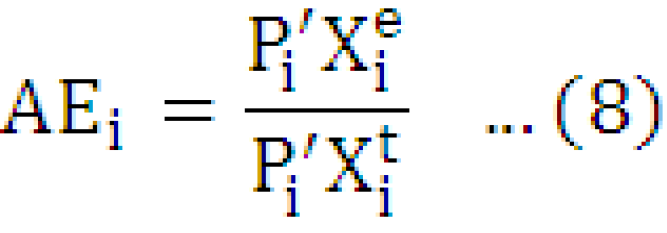
The ith firms P`i Xi - P`i Xie economic efficiency or total cost as crumbled in technical efficiency P`i Xi - P`i Xit and P`i Xit- P`iXie as allocative efficiency.
Production function as expressed in equation form Y =f (Xi) as output indicated with Y while the number of inputs as Xi. As in production function Y= f(L, K) labour and capital only two inputs while other constants in the short run. The functional relationship between output and input determines the various form of the Production function, which reported the technology of firms. The cost function of the firm routinely reported as firm technology knowledge duality. Cobb-Douglas production function prominently employed in agriculture empirical studies as compared to other production functions due to its various advantageous factors of validity as expressed.

In Equation 9 Y, as output with a combination of two inputs labour and capital A, as a scalar constant parameter. The elasticity of output denoted with α, b due to variation in L and K. Cobb-Douglas production function variation applied in the study as the stochastic frontier model in the equation below, simply linearisation general form using logs.

log= natural logarithm, Y= total cotton output (maunds), βs= parameters to be estimated, Area1= farm area of the cotton crop(acres), Seed2= cottonseed (kg per acre), Nitro3= nitro fertiliser in (kg per acre), Dap4= Dap fertiliser in kg per acre, Pest5= pesticide cost (Rs per acre), Irrig6= irrigation (number per acre), Lab7= Hired labour force (no, per acre), Cul8= Cultivation (no, per acre), Vi= random error, Ui= inefficiency measures as indicated in Equation 10.
The cost function, formally known input economic cost as minimum payment the input required to keep its employment level properly. This is also employed as the best alternative as a minimum input payment. Farmer’s allocative efficiency is estimated with base cost function of dual parallel cost stochastic frontier as given below in Equation 11.

In Equation 11 above the minimum cost of inputs denoted by Ci with Y the output level, the fifth functional form of Cobb-Douglas with input prices of cotton farms. Estimated parameters denoted with α and observed output of cotton farms as Yi* with adjusted captured statistical noise Vi and Ui information provided ith farm allocative efficiency level.
Specified cotton farmers Cobb-Douglas cost frontier function as given in Equation 12.
The total cost of production ith cotton farm denoted with Ci while detected cotton crop output adjusted for statistical noise Yi*. Price of land rent per acre as pArea2, prices of seed kg per acre pseed3, and pNitro4= prices of nitro fertiliser per acre. pDap5= prices of Dap fertiliser per acre, pPest6= prices of pesticides per acre, pIrrig7= prices of irrigation per acre, pLab8= prices (wages) of labour per acre, pCul9= prices of cultivation per acre, as indicated in the Equation 12.
In this study Stochastic production frontier model was applied with various distinctive advantages firstly it identifies the predicted level inefficiency among farms in the single-stage; secondly, the decomposition of error term does not require Jondrows et al. (1982) predictor which does not cover to true estimates (Green, 2007). The method of maximum likelihood proposed by Battese and Coelli (1988) allows computation as well as decomposition composite error term using predictor. The stochastic frontier approach allows the investigation of the potential source of inefficiency differential between the surveyed farms in a single stage.
Results and Discussion
The categorised cotton farmer’s descriptive statistics production, gross revenue, and inputs as indicated in Table 1. The average cotton yield of small and medium farmers is significantly higher in contrast to larger cotton farmers while medium and large cotton farmers gain relatively higher prices of cotton yield in contrast to small farmers. Medium farm size farmer earns a significantly higher net profit in cotton cultivation in contrast to large farm size farmers as indicated in Table 1 from collected data. The production cost of cotton cultivated land rent, fertiliser, pesticides, irrigation, and labor was significant in all farm size categories. Land rent, nitro fertiliser cost, and irrigation cost are relatively higher in small farm size farmers relative to medium and large farm size which was the reason for the higher yield of small farm size. Average per acre cost of cotton production does not consider much different in all farm sizes cotton farmers as indicated in Table 1 from collected data.
Input and output variables summary statistics mean and standard deviation of small, medium and large farm size were elaborated in Table 2. Small farms use of DAP fertiliser and irrigation number was significantly higher than medium and large farm size. Medium and large farms were comparatively using more nitrogen fertiliser as compared to small farm size. In below Table 2 large farm size cost of pesticides relatively higher than small and medium farm size farmers as indicated with the mean value.
Stochastic Frontier Analysis and inefficiency effects models empirical estimates for three categorised farm size as indicated in Table 3. The log-likelihood function value is small while relatively satisfied due to dealing with cross-sectional data. The statistical significant parameter ratio of ϒ with the significance level of at five percent elaborates as farm-specific efficiency is likely to be highly significant in explaining total variability small, medium and large farm size cotton farmers.

Table 1: Average per acre gross revenue and production costs of small, medium and large farms in the southern Punjab district Rahim Yar Khan for the year 2017-18.
|
Small farms |
Medium farms |
Large farms |
|||||
|
Yield (Maun per acre)* |
23.57 |
22.27 |
19.12 |
||||
|
Price (Rs Pakistani) |
2699 |
2891.1 |
2842.46 |
||||
|
Value of production (Rs) |
63678.71 |
64378.25 |
54423.42 |
||||
|
Gross revenue (Rs) |
63678.71 |
64378.25 |
54423.42 |
||||
|
Average per acre production expenses of cotton production of various farms sizes |
|||||||
|
Small farms |
Medium farms |
Large farms |
|||||
|
Sr.no |
Inputs |
Cost Rs |
% of total |
Cost Rs |
% of total |
Cost Rs |
% of total |
|
1 |
Land rent |
17586.6 |
36.85 |
17064.6 |
36.90 |
16521.22 |
35.77 |
|
2 |
Seed cost |
1000.8 |
2.06 |
1041.1 |
2.25 |
944.22 |
2.04 |
|
3 |
Nitro fertilizer |
7380.59 |
15.23 |
7430.95 |
16.07 |
7396.6 |
16.01 |
|
4 |
DAP fertilizer |
4211.99 |
8.69 |
3120.3 |
6.74 |
3635.24 |
7.87 |
|
5 |
Pesticides |
3780 |
7.80 |
3660 |
7.91 |
4380 |
9.48 |
|
6 |
Irrigation |
7786.7 |
16.07 |
7461.8 |
16.14 |
6007.4 |
13.01 |
|
7 |
Labor |
4371.2 |
9.02 |
4218 |
9.12 |
5272.8 |
11.41 |
|
8 |
Cultivation |
2327.9 |
4.80 |
2239.22 |
4.84 |
2034.6 |
4.40 |
|
Total cost |
48445.78 |
100 |
46235.97 |
100 |
46192.08 |
100 |
|
|
Gross profit |
15232.94 |
18142.28 |
8231.349 |
||||
Author calculation from collected data; *One Maun: 40 kg.
Table 2: Categorized cotton farm sizes summary statistics with standard deviation and mean.
|
Study variables |
Small farms |
Medium farms |
Large farms |
|||
|
Mean |
St. deviation |
Mean |
St. deviation |
Mean |
St. deviation |
|
|
Yield |
193.940 |
72.72859 |
385.16 |
125.9735 |
1209.16 |
1856.058 |
|
Crop acres |
8.23000 |
2.697713 |
17.47 |
3.137024 |
58.52 |
58.65334 |
|
Seed kg |
7.40000 |
1.399708 |
7.36 |
1.224911 |
7.84 |
1.218229 |
|
Nitrofertilizer (kg) |
207.600 |
51.01260 |
217.5 |
67.05351 |
217 |
73.96221 |
|
DAP fertilizer (kg) |
58.5200 |
33.15716 |
44.54 |
27.06169 |
53.76 |
29.69612 |
|
Pesticides (Rs) |
3780.00 |
1329.262 |
3660 |
1061.574 |
4380 |
1627.443 |
|
Irrigation (no) |
18.3000 |
5.175492 |
17.94 |
4.339708 |
17.24 |
5.223807 |
|
Labor (no) |
2.62000 |
0.725343 |
2.56 |
0.704504 |
4 |
1.010153 |
|
Cultivation (no) |
4.50000 |
1.373956 |
4.44 |
1.033322 |
4.55102 |
1.081304 |
Author calculation from collected data.
Empirical estimates of production function models were mentioned with the prominent parameter of all models cropped area, cultivation of land and irrigation as statistically significant in small, medium and large farm sizes. These findings indicated as cropped areas increases, cultivation for land preparation increases and adequate irrigation to cotton crop provided, cotton production of all categorised (small, medium and large) cotton farm size increases and these findings are similar to studies Gul et al. (2009), Barnes et al. (2011), Mburu et al. (2014), Fatima et al. (2016), Karli et al. (2017), Ahmad and Afzal (2018) and Bilgili et al. (2018). The coefficient of DAP fertiliser and pesticides reported as positive and significant for small and large cotton farmers indicated as DAP fertiliser and pesticide usage increases cotton production of small and medium farmers raising and these results consistent with studies as Hassan (2004), Ahmad and Afzal (2012), Bilgili et al. (2018) and Ahmad and Afzal (2020). The medium cotton farmers with the negative and significant coefficient of Dap fertiliser and pesticide indicated as the usage of fertiliser and pesticides increases cotton production decreases due to the reason of overuse and these results are alike the studies of Fatima et al. (2016) and Karli et al. (2017). The coefficients of seed, Nitro fertiliser, and labour in small, medium and large farmers groups reported as positi ve while insignificant elaborated as these variables not significantly affect cotton crop production.
Inefficiency effect model estimates, education, credit, own tubewell, sowing crop timely and agriculture extension were statistically significant in all small, medium and large farms size categorises while water shortage and farm size negatively impact the efficiency of all farm size in technical effect model. According to these findings an increase in farmers schooling, credit access, tubewell availability, appropriate sowing timing and access of agriculture extension, raises cotton production and these findings parallel the studies of Bravo-Ureta and Evenson (1994), Battese et al. (1996), Bakhsh and Ahmad (2006), Bozoglu and Ceyhan (2007), Uaiene and Arndt (2009), Ahamd and Afzal (2012), Mburu et al. (2014), Fatima et al. (2016), Karli et al. (2017) and Ahmad and Afzal (2020). The positive and significant of inefficiency effect model coefficient of farm size and water shortage as increases in farm size and water shortage it decreases cotton production in all categorised farm sizes and these findings are consistent the studies Hassan (2004), Bozoglu and Ceyhan (2007), Karli et al. (2017), Ahmad and Afzal (2018) and Bilgili et al. (2018).
Table 3: Empirical estimates of stochastic production and inefficiency effect models among categorized farms.
|
Small farms |
Medium farms |
Large farms |
||||
|
Parameters |
Coefficient |
St. Error |
Coefficient |
St. Error |
Coefficient |
St. Error |
|
Constant |
0.161 |
0.423 |
0.5417 |
0.123 |
0.334 |
0.889 |
|
lnArea |
0.994** |
0.215 |
0.427*** |
0.223 |
0.854* |
0.854 |
|
lnSeed |
0.166 |
0.466 |
0.128 |
0.183 |
-0.285 |
0.152 |
|
lnNitro |
0.402 |
0.680 |
0.128 |
0.138 |
-0.489 |
0.872 |
|
lnDap |
0.643* |
0.201 |
-0.346** |
0.288 |
0.353** |
0.240 |
|
lnPesticide |
0.852*** |
0.227 |
-0.232* |
0.940 |
0.229*** |
0.788 |
|
lnIrrigation |
0.144** |
0.442 |
0.227* |
0.112 |
0.479* |
0.637 |
|
lnLabor |
0.606 |
0.664 |
0.127 |
0.137 |
0.404 |
0.130 |
|
lnCultivation |
0.494** |
0.426 |
0.139** |
0.168 |
0.251*** |
0.137 |
|
Inefficiency effect model |
||||||
|
Constant |
0.681 |
0.301 |
0.370 |
0.394 |
-0.922 |
0.239 |
|
Farmer age |
0.411* |
0.448 |
0.134** |
0.795 |
0.406*** |
0.212 |
|
Education |
-0.944** |
0.266 |
-0.407*** |
0.205 |
-0.374* |
0.854 |
|
Farm size |
0.267*** |
0.315 |
0.303* |
0.248 |
0.225* |
0.533 |
|
Operat area |
-0.461 |
0.672 |
0.318 |
0.907 |
-0.110 |
0.625 |
|
Credit |
-0.153** |
0.173 |
-0.408*** |
0.817 |
-0.629** |
0.224 |
|
Sow dril/no |
0.107 |
0.118 |
-0.137 |
0.118 |
-0.677 |
0.111 |
|
Tub y/n |
-0.143*** |
0.714 |
-0.408* |
0.817 |
-0.241** |
0.158 |
|
Sown time |
-0.518** |
0.397 |
-0.129*** |
0.561 |
-0.109* |
0.314 |
|
Agri ext |
-0.143** |
0.714 |
-0.408** |
0.817 |
-0.315*** |
0.117 |
|
Water shrot |
0.176** |
0.139 |
0.335* |
0.114 |
0.267** |
0.616 |
|
Sigma sq |
0.190 |
0.647 |
0.401 |
0.125 |
0.149 |
0.435 |
|
Value of γ |
0.999 |
0.867 |
0.738 |
0.255 |
0.650 |
0.347 |
|
Function log likelihood |
0.454615 |
0.1013919 |
0.3437314 |
|||
*: at level of significance 1percent; **: at level of significance 5percent; ***: at level of significance 10 percent.
Cobb-Douglas production function parameter estimates as indicated in Table 3 and the parameters of corresponding cost functions of all farm size were recovered. The dual cost frontier for the small, medium and large farms size of cotton production as given below:
lnCsmall= 4.227 + 1.231ln Yi* + 0.180lnpL + 0.385lnpseed + 0.110lnpnitro + 0.575lnpDap + 0.104lnppest + 0.618lnpirrig + 0.373lnplab + 0.184lnpcult …(13)
lnCmedium= 7.224 + 0.973lnYi*+ 0.123lnpL + 0.776lnpseed + 0.178lnpnitro + 0.447lnpDap + 0.403lnppest + 0.369lnpirrig + 0.128lnplab +0.316lnpcult …(14)
lnClarge = 1.537 +1.421lnYi* + 0.123lnpL + 0.378lnpseed +0.668lnpnitro +0.411lnpDap + 0.505lnppest +0.513lnpirrig + 0.429lnplab + 0.834lnpcult …(15)
The above equations of cost models p determined the prices of inputs utilized for production of cotton (land, seed, nitro, Dap, pesticide, irrigation, labor and cultivation) small, medium and large farm size. The notion of C as cost expenses of inputs and Yi* small, medium and large farms size of cotton production level adjusted for the statistical and measurement errors captured by Vi. In Table 4 various categorised cotton farmers groups cotton production output and inputs variable cost as elaborated properly with the coefficients values and standard error.
Table 4: Stochastic cost functions for various categorized cotton farms.
|
Small farms |
Medium farms |
Large farms |
||||
|
Parameters |
Coefficients |
St. Error |
Coefficients |
St. Error |
Coefficients |
St. Error |
|
Constant |
4.227 |
0.751 |
7.224 |
0.329 |
1.537 |
0.998 |
|
ln Yi* |
1.231 |
0.163 |
0.973 |
0.231 |
1.421 |
0.179 |
|
lnpArea |
0.180 |
0.751 |
0.123 |
0.332 |
0.123 |
0.878 |
|
lnpSeed |
0.385 |
0.126 |
0.776 |
0.160 |
0.378 |
0.944 |
|
lnpNitro |
0.110 |
0.117 |
0.178 |
0.126 |
0.668 |
0.508 |
|
lnpDap |
0.575 |
0.222 |
0.447 |
0.243 |
0.411 |
0.625 |
|
lnpPesticide |
0.104 |
0.764 |
0.403 |
0.162 |
0.505 |
0.519 |
|
lnpIrrigation |
0.618 |
0.887 |
0.369 |
0.103 |
0.513 |
0.257 |
|
lnpLabor |
0.373 |
0.107 |
0.128 |
0.147 |
0.429 |
0.487 |
|
lnpCultivation |
0.184 |
0.955 |
0.316 |
0.164 |
0.834 |
0.838 |
Economic efficiency
Categorised (small, medium, large) cotton farms specific allocative, technical and economic efficiency estimated measures as reported in Table 5. Technical efficiency table exposed these categorised (small, medium, large) farms on average were 0.79, 0.90 and 0.70 efficient to utilize their given technology and crops inputs. Average technical efficiency score indicated a statistically significant difference among small, medium and large farms. Lower technical efficiency in small and large farms as a contrast to medium farms was estimated it must not be interoperated as medium farms advantage over large and small farm size while all farms were almost similar socioeconomic and input characteristics relative to the environment, land fertility, irrigation availability, and location. All such differences treated in such a way as, small and large farms farmers were facing more difficulties than medium farms farmers in exploiting potential use of existing state of technology and inputs.
These categorised (small, medium, large) cotton farms farmers allocative efficiency was relatively 0.92, 0.94 and 0.97 while overall average allocative efficiency was 0.94. Small, medium and large farms average allocative efficiency score was denoted difference among farm size statistically insignificant. All farm size average allocative efficiency of cotton farmers was relatively higher than average technical efficiency. Higher average allocative estimates among small, medium and large farms size of cotton farmers in view, easier for cotton farmers to make the adjustment and control closer to cost minimisation state adequately than full apply of accessible state of technology.
Economic efficiency was significantly found lower among all categorised (small, medium, large) cotton farms farmers 0.76, 0.85 and 0.68 as indicated in Table 5. Average lower economic efficiency of large and small farms compared to medium farms was respectively due to the lower score of technical efficiency. Cost-saving motive can be achieved with improving technical efficiency rather than allocative while both improving efficiencies can attain cost saving.
Table 5: Categorized cotton farms mean economic, technical and allocative efficiency scores.
|
Farm size |
Technical efficiency |
Allocative efficiency |
Economic efficiency |
|
Small scale |
0.79 |
0.92 |
0.76 |
|
Medium scale |
0.90 |
0.94 |
0.85 |
|
Large scale |
0.70 |
0.97 |
0.68 |
|
Overall |
0.796 |
0.94 |
0.76 |
Conclusions and Recommendations
In the current scenario, increasing population significantly with the tendency of increasing urbanisation, nutrition, and shelters which consequently squeezing the scare arable land. The association of efficiency and farm size measurement has a significant contribution to the potential use of available scarce resources and agricultural growth specifically in the scenario of developing countries like Pakistan. This study aimed to empirically examine the economic efficiency and farm size of cotton farmers in southern Punjab of Pakistan. The conclusions of study signified as cropped area, irrigation, and cultivation positively and significantly affect the cotton production in all farm size farmers. Pesticide and DAP fertiliser positively effect in small and large farmers cotton production while negatively in medium farmers the reason for overuse of these inputs. The socioeconomic factors as age, farm size, and water shortage increase farmers inefficiency while the increase in farmers schooling years, credit access, extension access, sowing timely and increased operational area decrease farmers’ inefficiency in these three categories of small, medium and large cotton farmers groups. In the mean efficiencies estimates, medium farm size cotton farmers were economical, allocative and technically more efficient due to expertise within managerial competencies crop inputs and use advance mechanisation in farms comparatively to small and large farm size farmers.
In these three farmers groups, inefficiency still exists which need to be overcome with the significant policy measures for potential farms’ output for sustainable cotton production as a prerequisite for the national interest. In developing farm-specific characteristics it is essential to regulate fair price and adequate supply of inputs as quality based seeds, agro fertiliser, pesticides, farming types of equipment and reasonable prices of the cotton crop. Farming managerial competencies need to enhance in cotton farmers through improving education facilities in rural areas, enhancing farming extension services and training to farmers, the familiarity of crop-related current research improvements as the prerequisite for adequate production of the cotton crop for competing in the world market. Appropriate supervision of government extension services regarding farming practices in the utilisation of the proper combination of inputs will economise the cost and controlling misallocation of resources as result productivity and profitability of cotton farmers will increase.
Novelty Statement
In research scenario specifically to cotton region of Pakistan many aspects were focused in literature whereas the aspect of economic efficiency and farm size particu-larly to cotton crop in cotton zone of Punjab Pakistan not properly explored. This study focused to investigate this aspect and con-tribute in farm based research.
Author’s Contribution
In this manuscript initial idea, data collection, methodology, write up was contributed by first author Dr. Dilshad Ahmad while results and suggestions and proofreading was contributed to both authors Dr. Dilshad Ahmad and Prof. Muhammad Afzal.
Conflicts of interest
The authors have declared no conflict of interest.
References
Abdulai, A.N. and A. Abdulai. 2016. Allocative and scale efficiency among maize farmers in Zambia: a zero efficiency stochastic frontier approach. Appl. Econ., 48(55): 5364-5378. https://doi.org/10.1080/00036846.2016.1176120
Agriculture Census Organization. 2010. Agricultural census 2010: Pakistan report. Statistics Division, Government of Pakistan. Available at: http://www.pbs.gov.pk [Accessed 15 October 2015].
Ahmad, D., M.I. Chani and A.A. Humayon. 2017. Major crops forecasting area, production and yield evidence from agriculture sector of Pakistan. Sarhad J. Agric. 33(3): 385-396.
Ahmad, D., M. Afzal and A. Rauf. 2018. Analysis of wheat farmers’ risk perceptions and attitudes: Evidence from Punjab, Pakistan. Natl. Hazard., pp. 1-17.
Ahmad, D. and M. Afzal. 2012. Technical efficiency of cotton farmers: Evidence from Punjab (Pakistan). Int. J. Manage. IT Eng., 2(12); 74.
Ahmad, D. and M. Afzal. 2018. Estimating the economic perspective of cotton crop in southern Punjab of Pakistan. Int. J. Adv. Appl. Sci., 5(6): 50-55. https://doi.org/10.21833/ijaas.2018.06.007
Ahmad, D. and M. Afzal. 2020. Climate change adaptation impact on cash crop productivity and income in Punjab province of Pakistan. Environ. Sci. Pollut. Res. Int., https://doi.org/10.1007/s11356-020-09368-x
Ahmad, D., M. Afzal and A. Rauf. 2019. Analysis of wheat farmers’ risk perceptions and attitudes: evidence from Punjab, Pakistan. Natl. Hazard., 95(3): 845-861. https://doi.org/10.1007/s11069-018-3523-5
Ahmad, D., M. Afzal and A. Rauf. 2020. Flood hazards adaptation strategies: A gender-based disaggregated analysis of farm-dependent Bait community in Punjab, Pakistan. Environ. Dev. Sustainability, pp. 1-22. https://doi.org/10.1007/s10668-020-00612-5
Aigner, D., C.K. Lovell and P. Schmidt. 1977. Formulation and estimation of stochastic frontier production function models. J. Econ., 6(1): 21-37. https://doi.org/10.1016/0304-4076(77)90052-5
Al-Amin, A.A., M.S. Rahman and M.I. Hossain. 2016. Impact of land fragmentation and soil fertility on Aus rice producers technical efficiency in Barisal district of Bangladesh. J. Bangladesh Agric. Univ., 14(1): 75-81. https://doi.org/10.3329/jbau.v14i1.30601
All Pakistan Textile Mills Association (APTMA), 2017. Trade and development authority pakistan (2016-17), Ministry of Textile and Industry Pakistan.
Assunção, J.J. and L.H. Braido. 2007. Testing household-specific explanations for the inverse productivity relationship. Am. J. Agric. Econ., 89(4): 980-990. https://doi.org/10.1111/j.1467-8276.2007.01032.x
Assuncao, J.J. and M. Ghatak. 2003. Can unobserved heterogeneity in farmer ability explain the inverse relationship between farm size and productivity? Econ. Lett., 80(2): 189-194. https://doi.org/10.1016/S0165-1765(03)00091-0
Azam-Ali, S., 2007. Agricultural Diversification: The Potential for Underutilised. Riv. Biol. Biol. Forum, 100: 27-38.
Bakhsh, K. and B. Ahmad. 2006. Technical efficiency and its determinants in potato production, evidence from Punjab, Pakistan.
Barnes, A.P., C. Revoredo-Giha and J. Sauer. 2011. A metafrontier approach to measuring technical efficiencies across the UK dairy sector. Evidence-based agricultural and rural policy making: Methodological and empirical challenges of policy evaluation.
Barrett, C.B., 1996. On price risk and the inverse farm size-productivity relationship. J. Dev. Econ., 51(2): 193-215. https://doi.org/10.1016/S0304-3878(96)00412-9
Basnayake, B.M.J.K. and L.H.P. Gunaratne. 2011. Estimation of technical efficiency and its determinants in the tea small holding sector in the Mid Country Wet Zone of Sri Lanka. Sri Lankan J. Agric. Econ., pp. 4. https://doi.org/10.4038/sjae.v4i0.3488
Battese, G.E. and G.S. Corra. 1977. Estimation of a production frontier model: with application to the pastoral zone of Eastern Australia. Aust. J. Agric. Econ., 21(3): 169-179. https://doi.org/10.1111/j.1467-8489.1977.tb00204.x
Battese, G.E. and T.J. Coelli. 1988. Prediction of firm-level technical efficiencies with generalization frontier production function and panel data. J. Econ., 38: 387-399. http://www.sciencedirect.com/science/article/pii/0304-4076(88)90053-X, https://doi.org/10.1016/0304-4076(88)90053-X
Battese, G.E., S.J. Malik and M.A. Gill. 1996. An investigation of technical inefficiencies of production of wheat farmers in four districts of Pakistan. J. Agric. Econ., 47(1‐4): 37-49. https://doi.org/10.1111/j.1477-9552.1996.tb00670.x
Bilgili, M.E., H. Yilmaz, S. Akkoyun, Y. Vurarak and M. Gül. 2018. Factors Affecting Cotton Production Decisions of Farmers: Eastern Mediterranean Region, Turkey. Sci. Pap. Ser. Manage., Econ. Eng. Agric. Rural Dev., 18(2): 41-51.
Bozoğlu, M. and V. Ceyhan. 2007. Measuring the technical efficiency and exploring the inefficiency determinants of vegetable farms in Samsun province, Turkey. Agric. Syst., 94(3): 649-656. https://doi.org/10.1016/j.agsy.2007.01.007
Bravo-Ureta, B.E. and R.E. Evenson. 1994. Efficiency in agricultural production: the case of peasant farmers in eastern Paraguay. Agric. Econ., 10(1): 27-37. https://doi.org/10.1111/j.1574-0862.1994.tb00286.x
Bravo-Ureta, B.E. and L. Rieger. 1991. Dairy farm efficiency measurement using stochastic frontiers and neoclassical duality. Am. J. Agric. Econ., 73(2): 421-428. https://doi.org/10.2307/1242726
Chandio, A.A., H. Magsi, A. Rehman and J.G.M. Sahito. 2017. Types, sources and importance of agricultural credits in Pakistan. J. Appl. Environ. Biol. Sci., 7: 144-149.
Chavas, J.P. and M. Aliber. 1993. An analysis of economic efficiency in agriculture: A nonparametric approach. J. Agric. Resour. Econ., pp. 1-16.
Coelli, T., 1998. A multi-stage methodology for the solution of orientated DEA models. Oper. Res. Lett., 23(3-5): 143-149. https://doi.org/10.1016/S0167-6377(98)00036-4
Coelli, T.J., 1995. Recent developments in frontier modelling and efficiency measurement. Aust. J. Agric. Econ., 39(3): 219-245. https://doi.org/10.1111/j.1467-8489.1995.tb00552.x
Dawn News. 2017. Pakistan cotton export and import statistics, Dawn News Jan 6, 2017.
Dercon, S. and P. Krishnan. 1996. Income portfolios in rural Ethiopia and Tanzania: Choices and constraints. J. Dev. Stud., 32(6): 850-875. https://doi.org/10.1080/00220389608422443
Drysdale, P., Y. Huang and K.P. Kalirajan. 2000. China’s trade efficiency: Measurement and determinants’. APEC and liberalisation of the Chinese economy, Asia Pacific Press, Canberra. pp. 259-71.
Ezeh, C.I., 2004. A comparative study of Fadama and non-Fadama crop farmers in Osisioma-Ngwa LGA, Abia State, Nigeria. J. Sustainable Trop. Agric. Res., 11: 26-31.
Farrell, M.J., 1957. The measurement of productive efficiency. J. R. Stat. Soc. Ser. A (General), 120(3): 253-281. https://doi.org/10.2307/2343100
Fatima, H., M.A. Khan, M. Zaid-Ullah and K.N. Saddozai. 2016. Technical Efficiency of Cotton Production in Pakistan: A Comparative Study on Non-BT and BT-cotton Farms. Sarhad J. Agric., 32(4): 267-274. https://doi.org/10.17582/journal.sja/2016/32.4.267.274
Government of Pakistan. 2017. Economic survey of Pakistan 2016-2017, Economic advisor’s wing, finance division, ministry of finance Islamabad, Pakistan.
Government of Pakistan. 2018. Economic Survey of Pakistan 2017-2018, Economic advisor’s wing, finance division, ministry of finance Islamabad, Pakistan.
Government of Punjab. 2017. Agriculture marketing information service (2017) Directorate of agriculture (Economics and Marketing) Punjab Lahore, Pakistan.
Greene, H., 2007. The econometric approach to efficiency analysis. H. Fried, K. Lovel and S. Schmidt, eds., Oxford University Press. https://doi.org/10.1093/acprof:oso/9780195183528.003.0002
Gul, M., B. Koc, E. Dagistan, M.G. Akpinar and O. Parlakay. 2009. Determination of technical efficiency in cotton growing farms in Turkey: A case study of Cukurova region. Afr. J. Agric. Res., 4(10): 944-949.
Hassan, S., 2004. An analysis of technical efficiency of wheat farmers in the mixed farming system of the Punjab, Pakistan (Doctoral dissertation, University of Agriculture, Faisalabad).
Javed, M.I., S.A. Adil, S. Hassan and A. Al. 2009. An efficiency analysis of Punjab’s cotton-wheat system. https://doi.org/10.35536/lje.2009.v14.i2.a4
Jondrow, J., C.K. Lovell, I.S. Materov and P. Schmidt. 1982. On the estimation of technical inefficiency in the stochastic frontier production function model. J. Econ., 19(2-3): 233-238. https://doi.org/10.1016/0304-4076(82)90004-5
Karli, B., F.M. Kart, M. Gul and M.G. Akpinar. 2017. Cost and profit analysis in cotton production in Şanliurfa province, turkey. Sci. Pap. Manage. Econ. Eng. Agric. Rural Dev., 17(2): 207-220.
Khalid Bashir, M. and Y. Mehmood. 2010. Institutional credit and rice productivity: A case study of District Lahore, Pakistan. China Agric. Econ. Rev., 2(4): 412-419. https://doi.org/10.1108/17561371011097722
Lipton, M., 2010. From policy aims and small-farm characteristics to farm science needs. World Dev., 38(10): 1399-1412. https://doi.org/10.1016/j.worlddev.2009.06.010
Mahjoor, A.A., 2013. Technical, allocative and economic efficiencies of broiler farms in Fars Province, Iran: A data envelopment analysis (DEA) approach. World Appl. Sci. J., 21(10): 1427-1435.
Mardani, A., E.K. Zavadskas, D. Streimikiene, A. Jusoh and M. Khoshnoudi. 2017. A comprehensive review of data envelopment analysis (DEA) approach in energy efficiency. Renewable Sustainable Energy Rev., 70: 1298-1322. https://doi.org/10.1016/j.rser.2016.12.030
Mburu, S., C. Ackello-Ogutu and R. Mulwa. 2014. Analysis of economic efficiency and farm size: A case study of wheat farmers in Nakuru District, Kenya. Econ. Res. Int., 2014. https://doi.org/10.1155/2014/802706
Meeusen, W. and J. van den Broeck. 1977. Technical efficiency and dimension of the firm: Some results on the use of frontier production functions. Empirical Econ., 2(2): 109-122. https://doi.org/10.1007/BF01767476
Musser, W.N. and G.F. Patrick. 2002. How much does risk really matter to farmers? A comprehensive assessment of the role of risk in US agriculture Springer, Boston, MA. pp. 537-556. https://doi.org/10.1007/978-1-4757-3583-3_24
Pakistan Central Cotton Committee (PCCC). 2017. Pakistan central cotton committee, 2016-17, Ministry of Textile and Industry Pakistan.
Rehman, A., L. Jingdong, A.A. Chandio and I. Hussain. 2017. Livestock production and population census in Pakistan: Determining their relationship with agricultural GDP using econometric analysis. Inf. Proc. Agric., 4(2): 168-177. https://doi.org/10.1016/j.inpa.2017.03.002
Saqib, S.E., J.K. Kuwornu, S. Panezia and U. Ali. 2018. Factors determining subsistence farmers’ access to agricultural credit in flood-prone areas of Pakistan. Kasetsart J. Soc. Sci., 39(2): 262-268. https://doi.org/10.1016/j.kjss.2017.06.001
Sarwar, B. and R. Saeed. 2013. Risk perception and risk management strategies by farmers in agriculture sector of Pakistan. Sci. Pap., pp. 267.
Seymour, G., 2017. Women’s empowerment in agriculture: Implications for technical efficiency in rural Bangladesh. Agric. Econ., 48(4): 513-522. https://doi.org/10.1111/agec.12352
Uaiene, R.N. and C. Arndt. 2009. Farm household efficiency in Mozambique. In 2009 Conference, August 16-22, 2009, Beijing, China (No. 51438). Int. Assoc. Agric. Econ.
Wang, E., H. Cresswell, B. Bryan, M. Glover and D. King. 2009. Modelling farming systems performance at catchment and regional scales to support natural resource management. NJAS-Wageningen J. Life Sci., 57(1): 101-108. https://doi.org/10.1016/j.njas.2009.07.002
Xu, X. and S.R. Jeffrey. 1998. Efficiency and technical progress in traditional and modern agriculture: evidence from rice production in China. Agric. Econ., 18(2): 157-165. https://doi.org/10.1111/j.1574-0862.1998.tb00495.x
To share on other social networks, click on any share button. What are these?


