
Alterations of VEGF Expression and Ovarian Follicles in Doxorubicin Treated Rats: Role of Curcumin Selenium Nanoparticles


Alterations of VEGF Expression and Ovarian Follicles in Doxorubicin Treated Rats: Role of Curcumin Selenium Nanoparticles
Rawya Shakir Mohammed*, Baraa Najim Al-Okaily
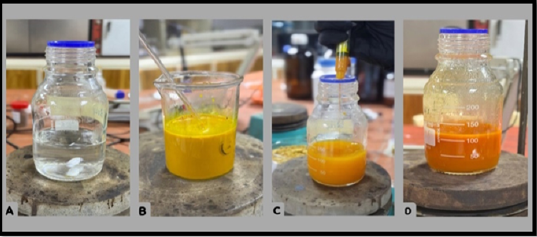
The image displayed the color transformation of sodium selenite into CurSeNPs by the use of an alcohol-based Curcuma longa extract; A: demonstrated a solution of sodium selenite lacking color; B: displayed an alcoholic extract of Curcuma longa; C: displayed curcumin selenium nanoparticles; D: depicted an image of CurSeNPs after a 24-hour period.
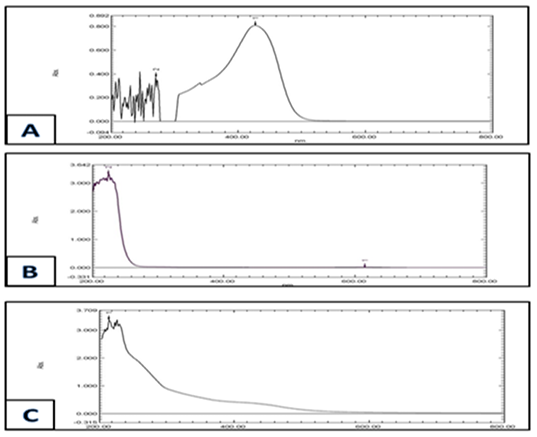
UV-Vis measure the absorbance of; A: Curcuma longa extract; B: Sodium hydrogen selenite; C: CurSeNPs.
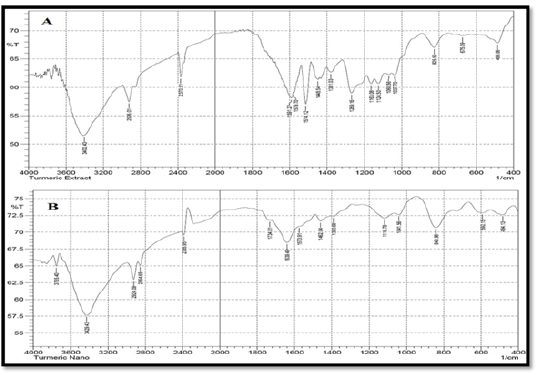
The FT-IR spectra of the alcoholic extract of Curcuma longa; B: the FT-IR spectrum of the functional groups of Curcuma longa extract coupled to SeNPs are provided.
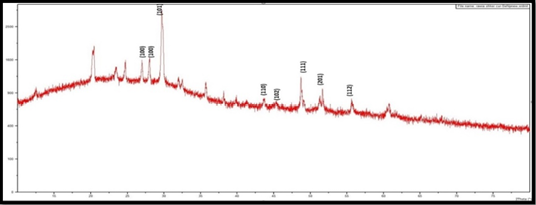
Sodium selenite solution and an alcoholic extract of Curcuma longa were used to synthesize curcumin selenium nanoparticles, which were characterized by the X-ray diffraction pattern.
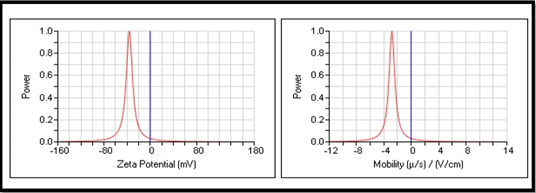
Zeta potentials of curcumin selenium nanoparticles A and B.
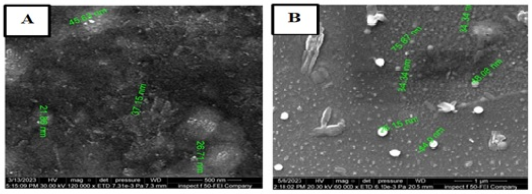
The FESEM image displayed the dimensions and properties of the synthesised Cur-Se-NPs, with (A) measuring 500nm and (B) measuring 1 μm.
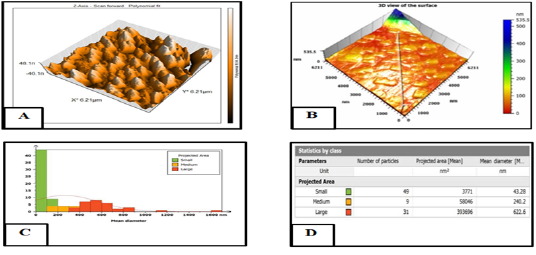
Atomic force microscopy (AFM) was used to analyze the size distribution of selenium nanoparticles (CurSeNPs). The results were shown in the form of a two-dimensional picture (a), a three-dimensional image (b), and a size distribution histogram (c) and (d).
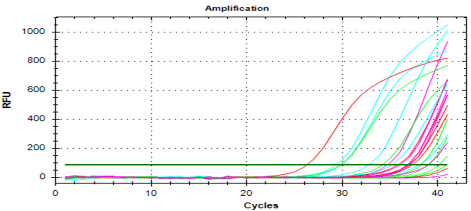
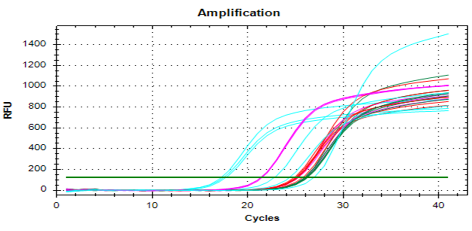
The real time amplification plots of VEGF gene expression of ovarian tissue in rats experimental samples. the real time PCR polts of VEGF gene. The blue plots (control group), green plots (G1 group), red plots (G2group), purple plots (G3 group).
The real time amplification plots of housekeeping (GAPDH) gene expression of ovarian tissue in rats experimental samples. the real time PCR polts of VEGFgene. The blue plots (control group), green plots (G1 group), red plots (G2group), purple plots (G3 group).
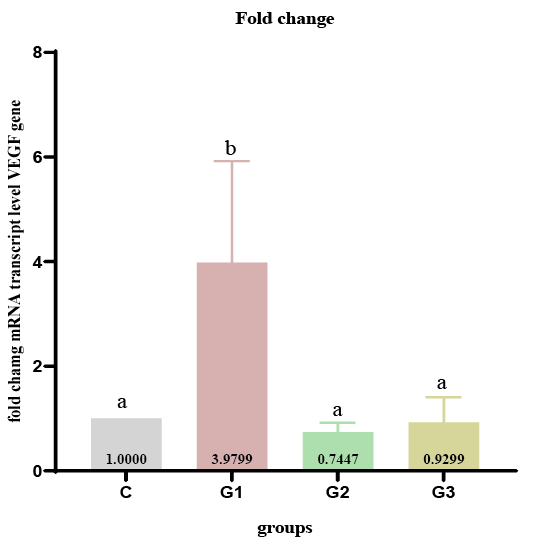
Assessment of VEGF gene expression in ovarian tissues of rats treated with CurSeNPs, doxorubicin and both after 14 days; *Values are expresses as mean ± SD; n:5; C: Control group; G1: Injected with i/p doxorubicin 4.40 mg /kg. b. w.; G2: Administrated with CurSeNPs 10.47 μg / kg bw. Orally; G3: Administrated with CurSeNPs 10.47 μg / kg bw; orally and with doxorubicin 4.40 mg! kg b. w. i/p.Different small letters mean significantly differences between groups P<0.05.
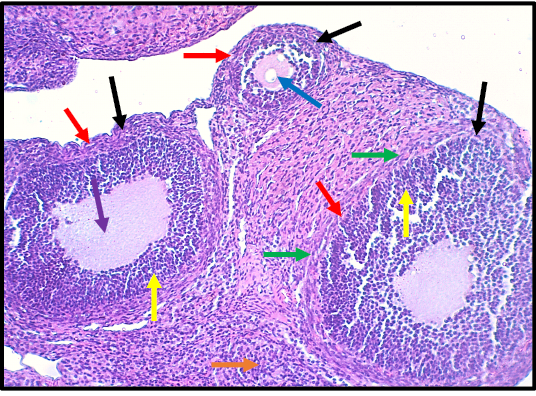
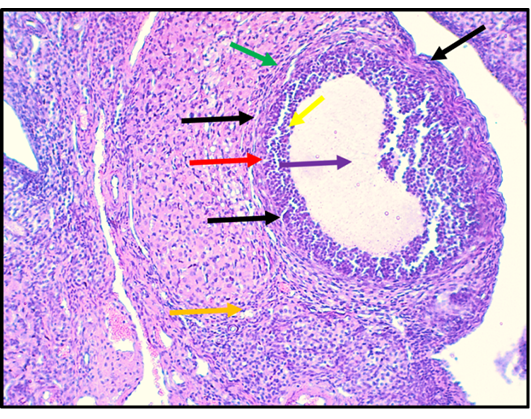
Histological section in ovary of rat in control group. The section shows graffian follicles (Black arrows), germinal epithelium (Red arrows), theca layer (Green arrows), granulosa cell layer (Yellow arrows), Oocyte (Blue arrow), antrum (purple arrow) and Oogonium (Orange arrow). The tissue is stained with H and E stain and the section is captured using light microscope and digital camera at 10X magnifier scale.
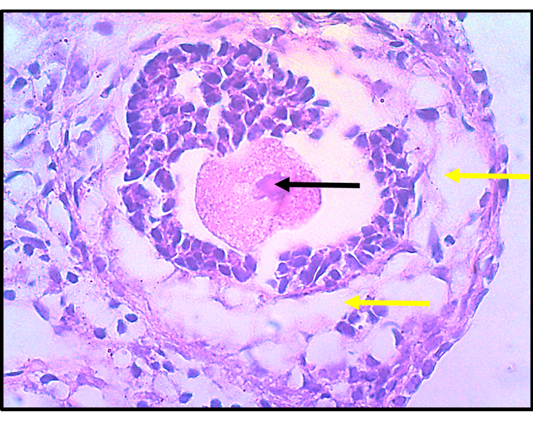
Histopathological section in ovary of rat that treated with doxorubicin group G1. (4.4mg./kg.b.w. for 14 days). The section shows clear congestion of graffian follicles (Oocyte, Black arrow) with sloughing and degenerative lesion in the granulosa cell layer (Yellow arrow). The section shows clear necrotic lesion in the graffian follicle with lysis of Oocyte (Red arrows). The Oogonium shows clear damage and necrosis of epithelia (Blue arrows). The tissue is stained with H&E stain and the section is captured using light microscope and digital camera at 10X magnifier scale.
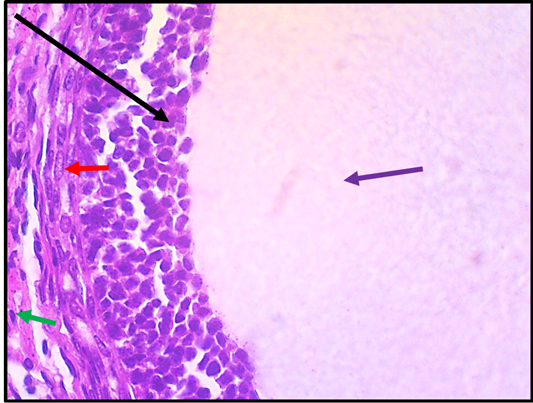
Histopathological section in ovary of rat that treated with doxorubicin group G1 (4.4mg./kg.b.w. for 14 days). The section shows clear congestion of graffian follicles (Oocyte, Black arrows) with sloughing and degenerative lesion in the granulosa cell layer (Yellow arrows). The tissue is stained with H and E stain and the section is captured using light microscope and digital camera at 40X magnifier scale.
Histological section in ovary of rat in G2 group (CurSeNPs 10.47 μg/kg.bw.). The section shows graffian follicles (Black arrows), germinal epithelium (Red arrows), theca layer (Green arrows), granulosa cell layer (Yellow arrows), antrum (purple arrow) and Oogonium (Orange arrow). The tissue is stained with H and E stain and the section is captured using light microscope and digital camera at 10X magnifier scale.
Histological section in ovary of rat in (G2 group, CurSeNPs 10.47 μg/kg.bw.). The section shows graffian follicles (Black arrow), germinal epithelium (Red arrow), theca layer (Green arrows) and antrum (purple arrow). The tissue is stained with H and E stain and the section is captured using light microscope and digital camera at 40X magnifier scale.
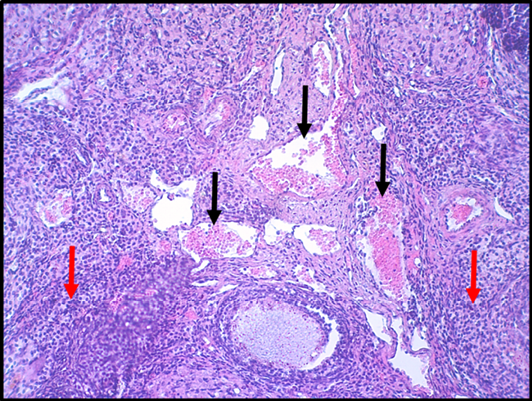
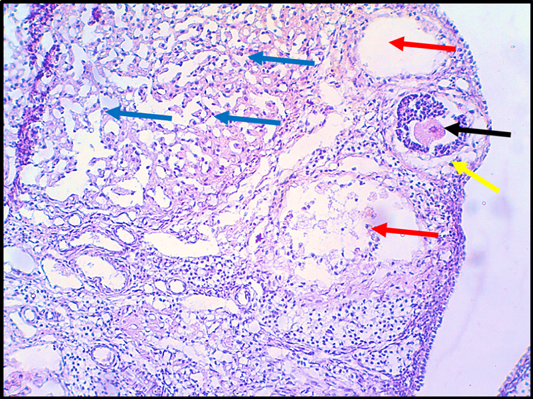
The histopathological section of ovary in rats of G3 group that treated with (Doxorubicin 4.40 mg /kg. b. w. + CurSeNPs 10.47 μg / kg bw.). The section sows clear blood vessels congestion of ovarian veins (Black arrows) with infiltration of inflammatory cells in theovarian tissue (Red arrows). The tissue is stained with H and E stain and the section is captured using light microscope and digital camera at 10X magnifier scale.

