A Statistical Study of the Determinants of Rice Crop Production in Pakistan
Muhammad Akbar Ali Shah1, Gamze Özel2, Christophe Chesneau3, Muhammad Mohsin4, Farrukh Jamal5* and Muhammad Faheem Bhatti6
1Department of Statistics, The Islamia University of Bahawalpur, Pakistan; 2Department of Statistics, Hacettepe University, Turkey; 3Department of Mathematics, LMNO, University of Caen, Caen, France; 4Department of Geography, Govt. Degree College (Boys), Choti Zareen, D.G. Khan, Pakistan; 5Department of Statistics, Govt. S.A. Postgraduate College, Dera Nawab Sahib, Bahawalpur, Pakistan; 6Department of Statistics, The Islamia University of Bahawalpur, Pakistan.
drfarrukh1982@gmail.com
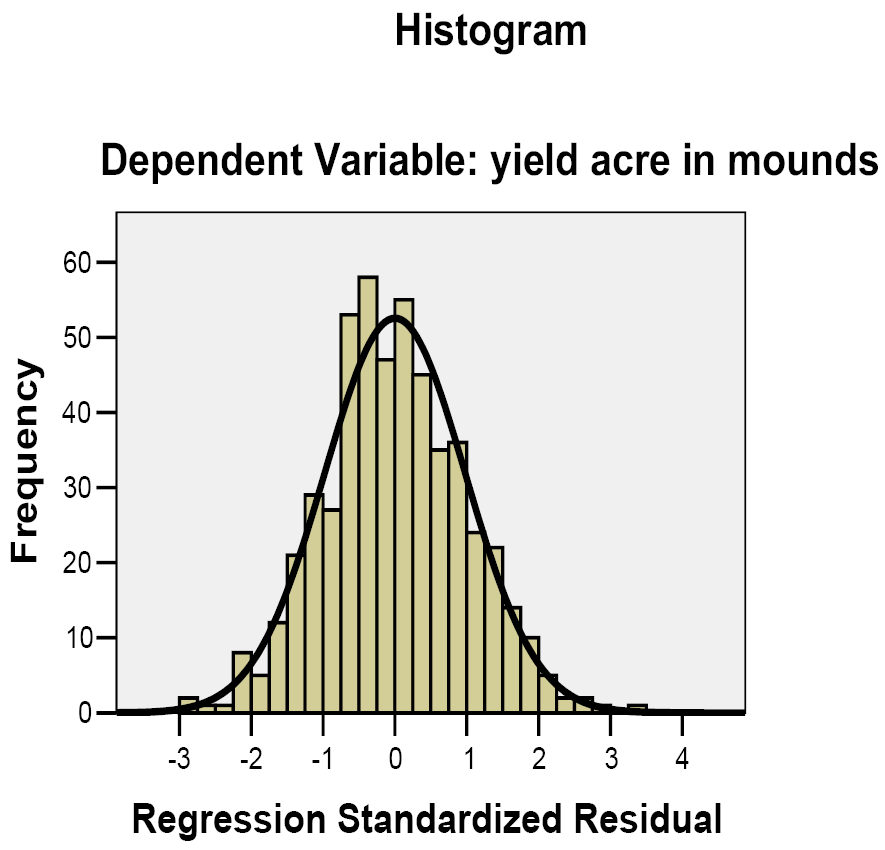
Figure 1
Histogram of the data with a normal curve.
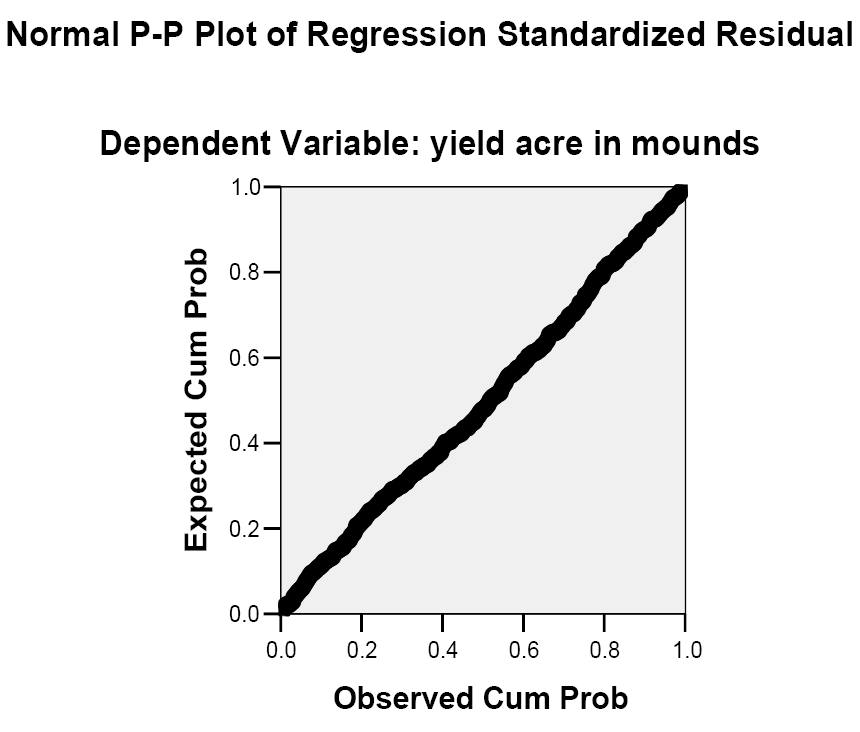
Figure 2
P-P plots of the data.
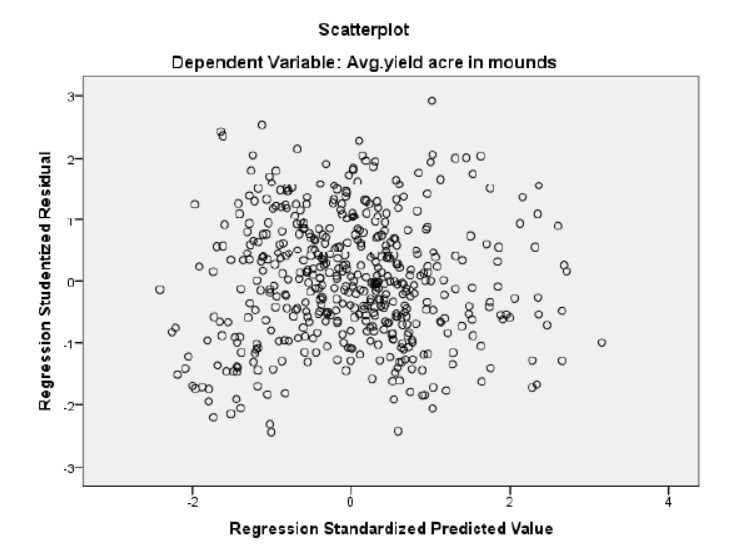
Figure 3
Predicted values versus standardized residuals.
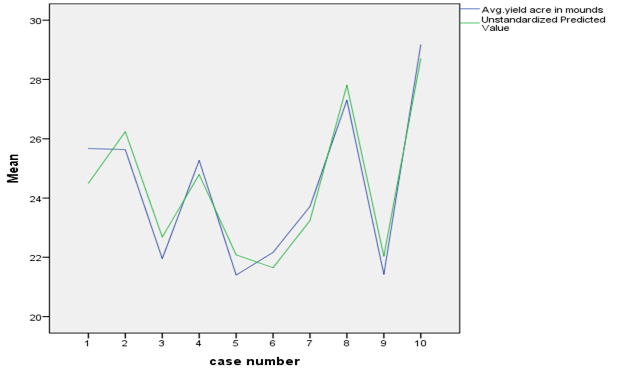
Figure 4
Observed and predicted the yield of Model II.


