


A Perspective on Household Dairy Farming in District Naushahro Feroze, Sindh, Pakistan
Israr Yasin1, Ismail Qureshi1*, Shahjahn Qaimkhani1, Gulam Mustafa Solangi3, Ismail Qaimkhani1, Ismail Brohi1 and Abdul Ahad Soomro2


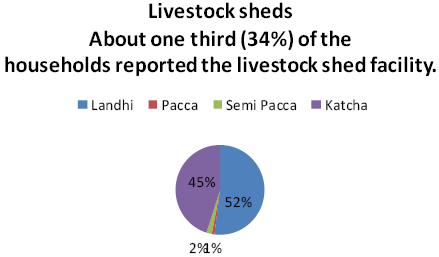
Reveals the distribution of livestock sheds by type. Landhi (made of wood and straw) was reported as more than one-half (52%) of all the livestock sheds. Proportion of katcha sheds (made of mud) was estimated 45%, whereas pacca and semi pacca sheds were 1 and 2%, respectively. Table 4 shows the area of livestock sheds. Average uncovered area of livestock sheds was reported to be 1,655 sq feet while average covered area was 1956 sq feet with minimum and maximum shed area of about 50 and 60,000 sq feet, respectively. Majority of the respondents reported that the livestock is tethered by chain under trees outside their houses.

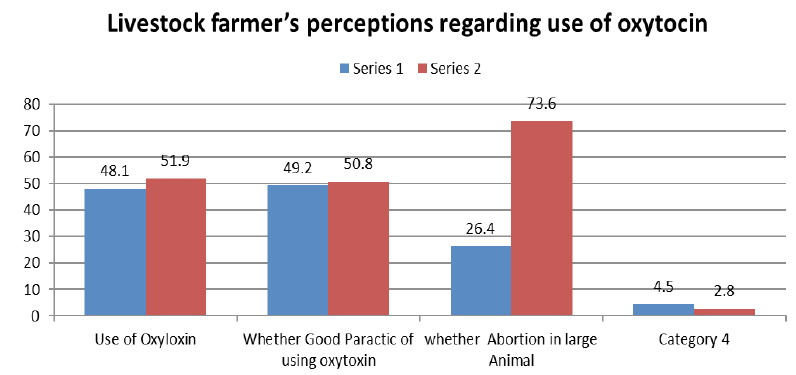
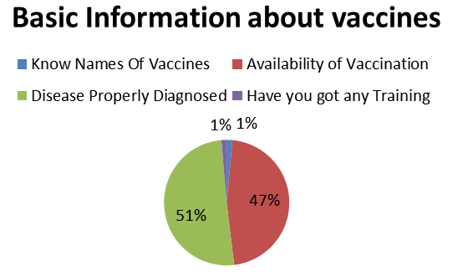
Summarizes information regarding respondents’ perceptions about vaccines. A very small number (2.4%) of the respondents knew the names of vaccines. Majority (75.3%) of the respondent shared information that vaccines are available in the market. Likewise, quite a large proportion (81.7%) of the respondents reported that diseases are properly diagnosed. However, quite a small number (22%) of the respondents agreed that proper rates are charged. Only 2.2% of the respondents reported that they have got any training in livestock vaccination.

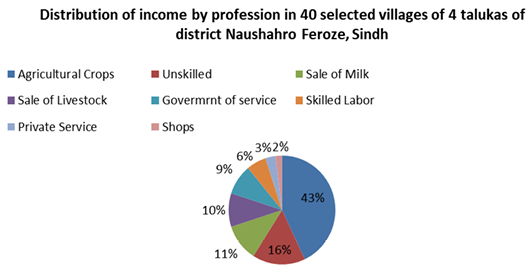
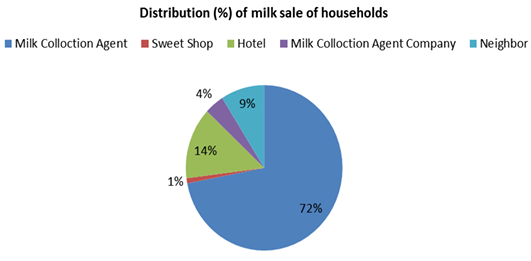
Contribution of livestock in household income. Average monthly income of a household was about Rs. 19,000 with standard error of the mean of about Rs 960. Reveals the distribution of income by profession. About 43% of the income was estimated form agricultural crops. Income of unskilled labor contributed about 16%, and was ranked as the second major source of income. Income earned from “sale of milk” and “sale of livestock” was ranked as the third and fourth source of income accounting for about 11% and 10%, respectively. Collectively, livestock contributed about 21% to household income. Share of income from government services was 9% followed by skilled labor (6%), private service (3%), and business and shop (2%).

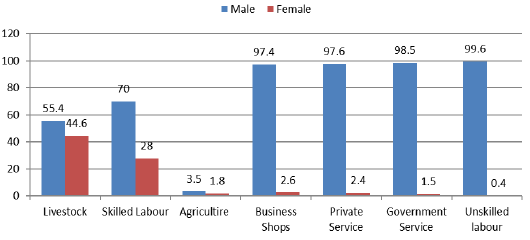
Labor Force by Gender in 40 selected villages of 4 talukas of district Naushahro Feroze, Sindh. Labor force by gender. Figure 9 shows the labor force by gender. Very small contribution of females was recorded in service and business professions. However, relatively more proportion (44.6%) of females was recorded in livestock rearing followed by skilled labor (handicrafts: 28%), Agriculture (1.8 %), business shops (2.6%), Private services (2.4%) and government service (1.5%).

